.svg)

Every guide on market analysis reads the same way. A definition, a numbered list of components, a template download. What they almost never include is a finished market analysis you can study.
This guide gives you three real ones, six frameworks with honest commentary on their limits, and a process for building your own.
It also includes something most guides skip: the perspective of practitioners who have used these frameworks across more than 100 companies and can tell you where they hold up and where they fall apart.
What a market analysis actually is
A market analysis is a structured examination of the conditions around a business opportunity. That covers market size, competition, customer behavior, industry trends, and the external factors shaping demand. The purpose is to convert market data into decisions about where to compete, how to position, and where to allocate resources.
People often conflate market research with market analysis. They are related, but the work is different. Market research is data collection: surveys, focus groups, interviews, published reports, secondary research. Market analysis is what happens after. It is interpretation. The layer where raw data turns into strategic direction.
Data collection without analysis produces expensive reports that sit on shelves. Analysis without rigorous market research underneath it produces conclusions that sound confident but rest on nothing. A thorough market analysis covers demand and supply dynamics in your target market, profiles of potential customers, an honest read on competition, and a scan of external factors like regulation and shifts in consumer behavior.
Here is the test that matters: if the analysis does not change a decision, it was not worth doing.
Why it matters
The case for market analysis is easier to make in hindsight than in advance. Before the research is done, it feels academic. After, the decisions it informed tend to look obvious.
Better resource allocation
Companies that understand their target market spend money more effectively. When you know who your potential customers actually are, what they care about, and how they evaluate alternatives, the downstream decisions about pricing, positioning, and channel selection become less speculative. Conducting a market analysis forces specificity where most planning stays abstract.
Reduced exposure
Market analysis replaces guesswork with data driven insights. For companies building a business plan, the market analysis section is the evidence base that pricing, distribution, and marketing strategies depend on. It also reduces the risk of building products for markets that turn out to be smaller, more competitive, or more structurally difficult than assumed. The companies that skip this work tend to discover those problems after they have committed budget.
Identifying what competitors missed
Understanding consumer preferences through market research lets businesses build offerings around what the target audience actually needs rather than what the company assumes they need. Market gaps, the needs that existing companies have not addressed, are where the most defensible positions tend to emerge. But identifying those gaps requires research that goes deeper than a Google search and a few competitor screenshots.
The components of market analysis
Every market analysis draws from the same set of building blocks. The difference between a useful analysis and a performative one is how rigorously each block is constructed.
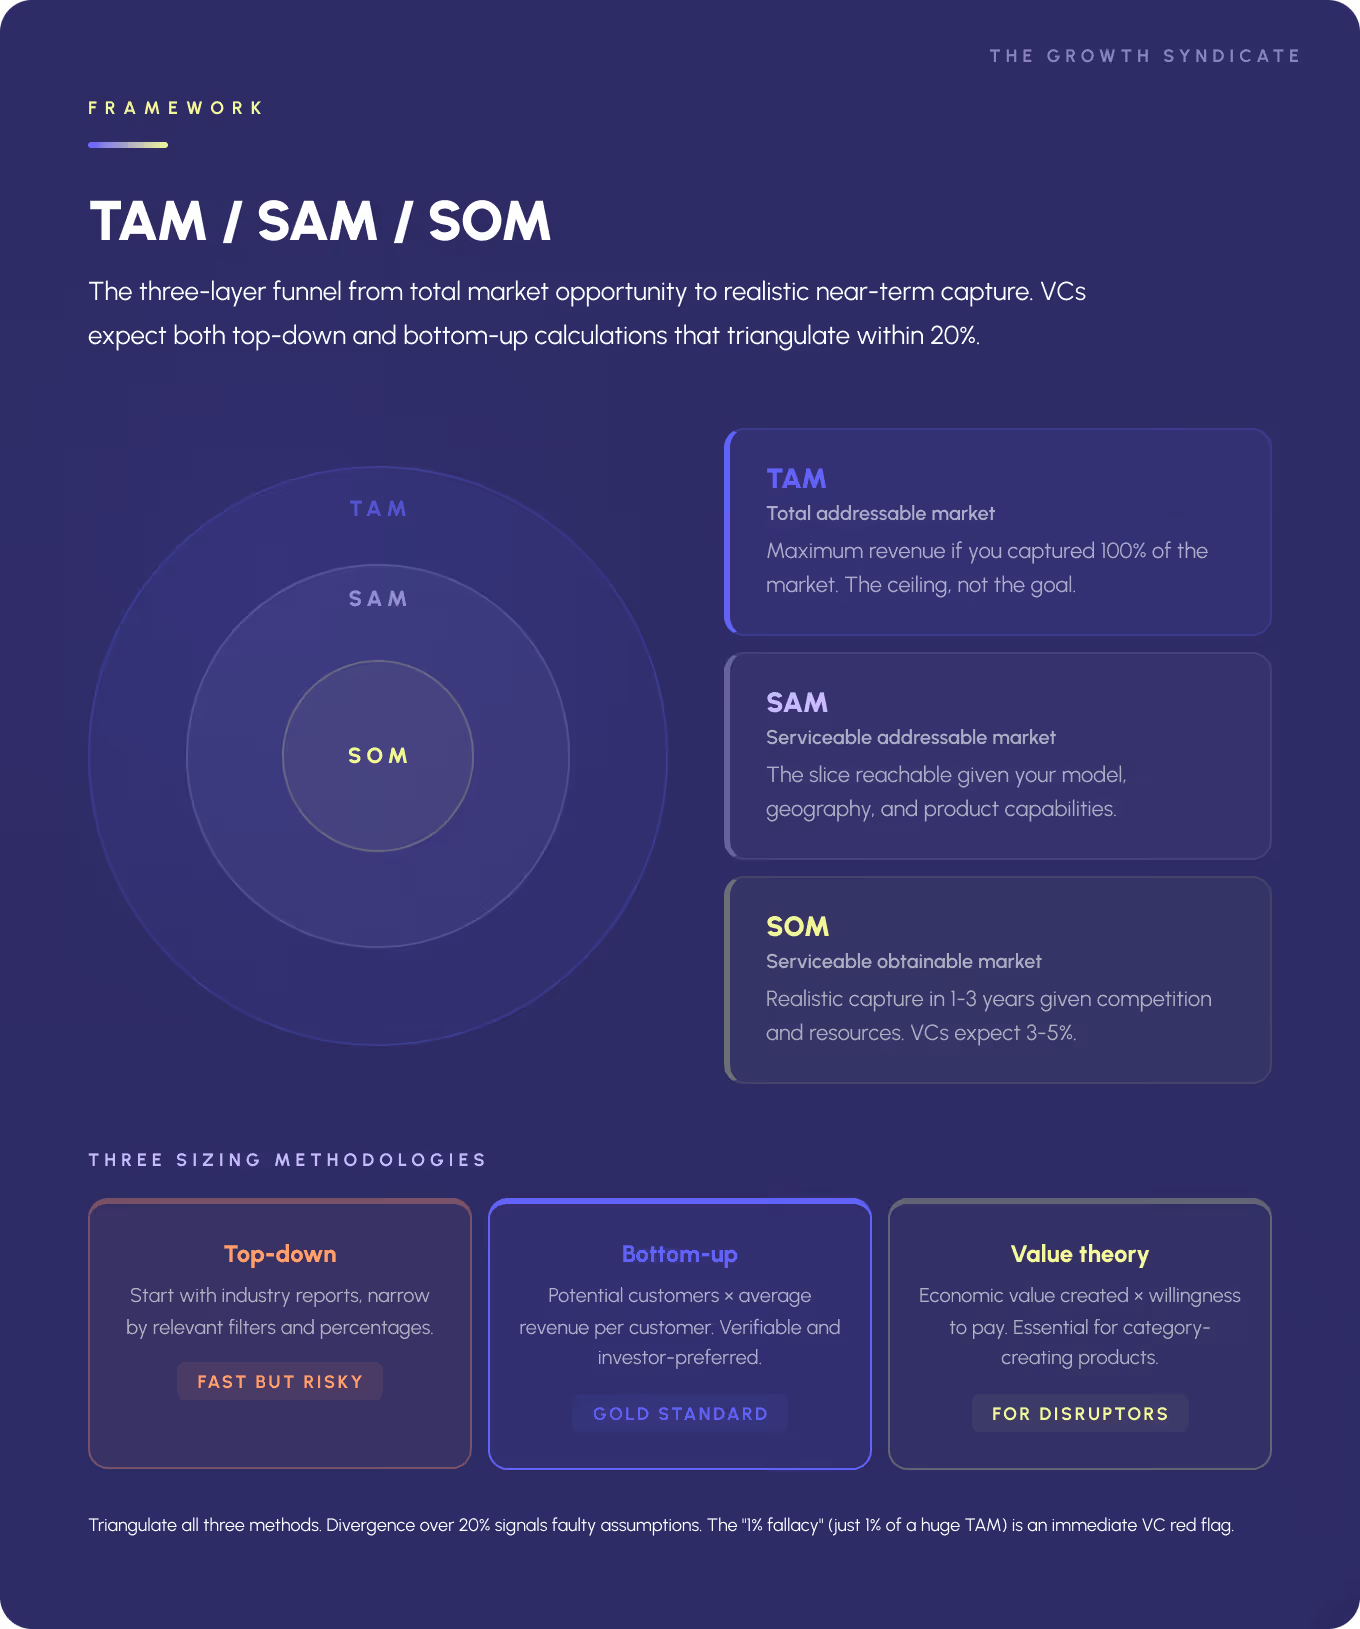
Sizing the market
Market sizing estimates how much revenue opportunity exists and what slice your business can realistically capture. The standard structure breaks this into three layers. TAM (total addressable market) is the theoretical maximum if you served every possible customer. SAM (serviceable addressable market) narrows that to the portion your business model and geography can actually reach. SOM (serviceable obtainable market) is the honest near-term number given your current resources and competition.
Two approaches dominate. Top-down market research starts from industry data and applies filters to narrow the number. Bottom-up starts from unit economics: the number of potential customers in a target market, multiplied by average revenue per customer. The best market research processes use both and then compare. When the two estimates diverge by more than 20%, at least one of the underlying assumptions needs revisiting.
Customer analysis and segmentation
Market segmentation divides a broad market into groups based on shared characteristics: demographic, geographic, psychographic, behavioral. Each approach reveals something different about consumer behavior and buying patterns.
The real payoff of customer analysis is specificity. You move from "everyone who might buy" to "these particular people with these particular problems evaluating against these particular criteria." Focus groups and interviews do the heaviest lifting here because they surface things quantitative research misses: the language customers use, the anxieties behind their decisions, the reasons they went with someone else.
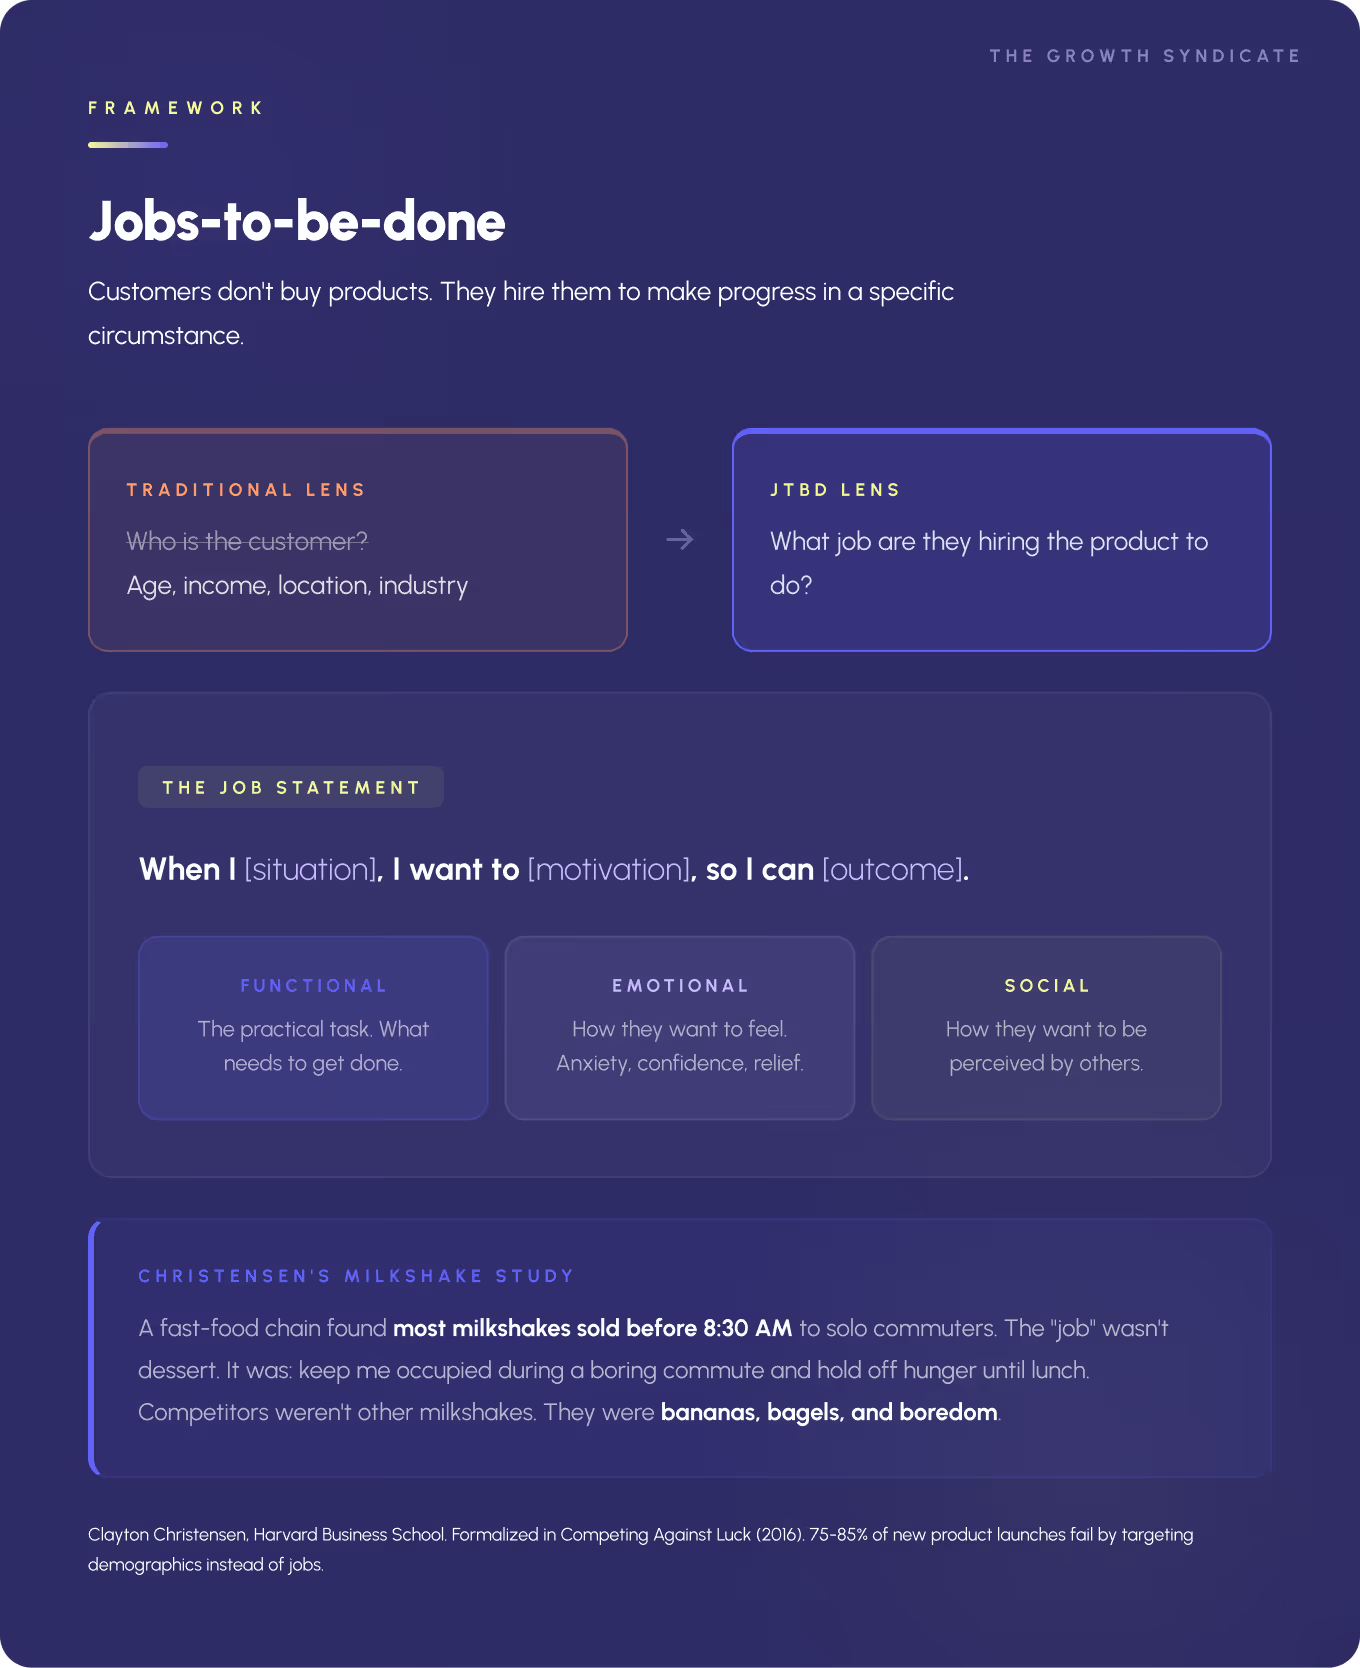
Clayton Christensen's Jobs-to-Be-Done framework takes this further. His research team at Harvard found that McDonald's milkshake buyers were not choosing between milkshake brands. They were choosing between milkshakes, bananas, and coffee for the job of making a boring commute less boring. That reframing changed who the competition actually was. Traditional market segmentation by age, income, or location would have missed the insight entirely.
Understanding who you compete against
A competitive market analysis maps your rivals: how they position, where they are strong, where they leave room. This covers direct competitors selling similar products and indirect alternatives that solve the same underlying problem through different means. Mapping the competitive landscape in this way surfaces market gaps that a surface-level scan would miss.
SWOT analysis evaluates internal strengths and weaknesses against external opportunities and threats. It remains a common starting point, though it tends to work better as a foundation than a destination. Porter's Five Forces examines the structural forces that determine industry profitability: rivalry, threat of new entrants, supplier power, buyer power, and substitutes. PESTLE analysis maps the macro factors (political, economic, social, technological, legal, environmental) shaping conditions for everyone in the market.
Creating a competitor SWOT matrix helps visualize where rivals leave gaps your company could fill. Digital tools like SEMrush and SimilarWeb let you see where competitors perform well in search and content and where the openings sit. The goal is not a comprehensive catalogue of everything every competitor does. The goal is to find the positioning opportunity that gives you a real competitive edge in a specific market segment.
Tracking shifts and market trends
Trend analysis monitors changes in consumer behavior, technology adoption, regulation, and economics. The rise of clean beauty, plant-based proteins, AI-assisted workflows: each restructured how companies in those markets competed.
Combining published market reports with secondary research, social media platforms, and predictive analytics provides a forward-looking view that static analysis misses. Economic trends and purchasing data add context that pure industry-level analysis tends to overlook. The companies that track market trends consistently, rather than reviewing them once a year during planning season, tend to hold a competitive edge because they spot shifts early enough to respond rather than react.
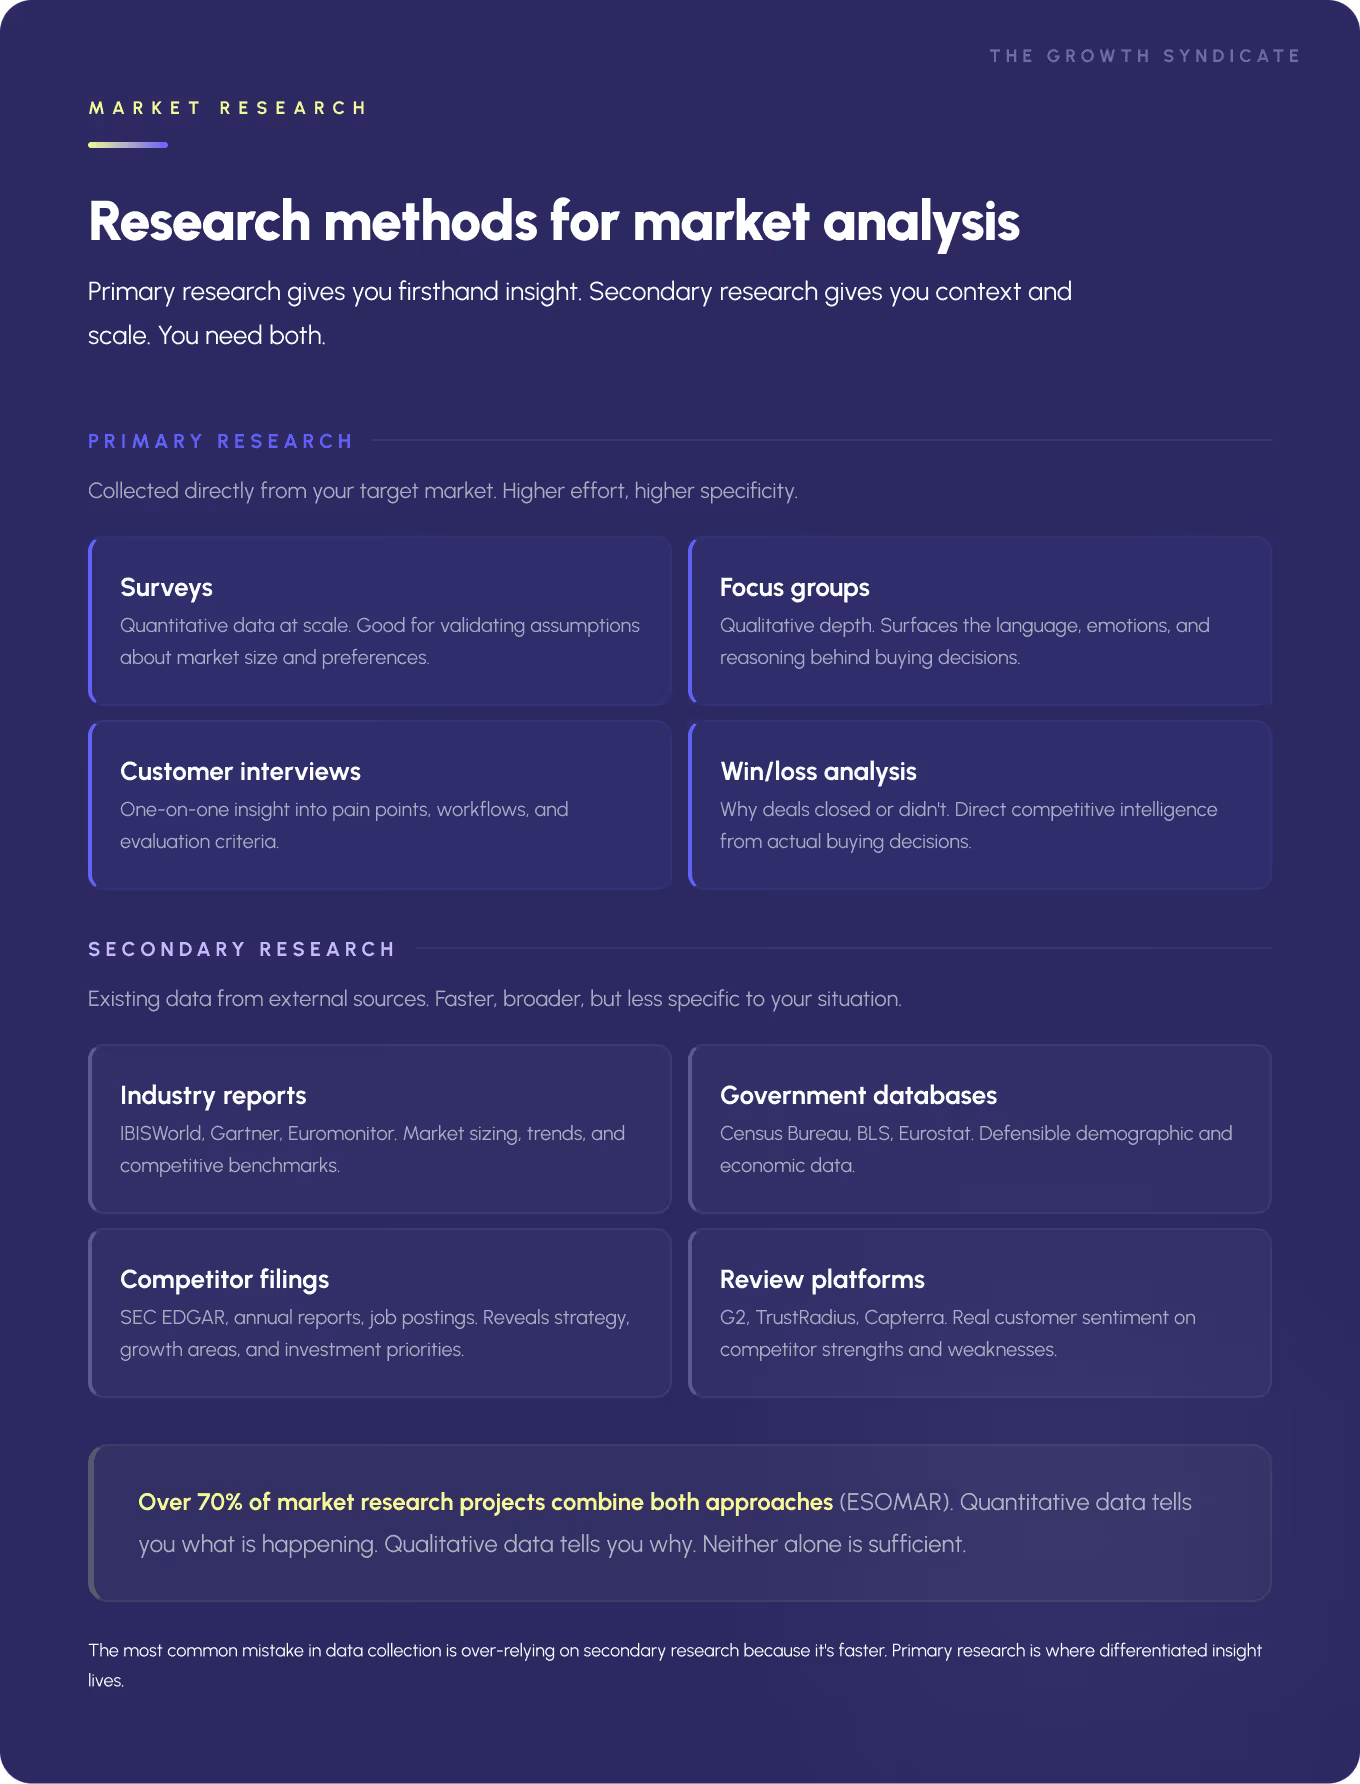
Gathering and validating data
Market research data collection combines primary data (surveys, focus groups, interviews, direct observation) with secondary data (published reports, government databases, competitor filings, market reports).
Focus groups remain one of the most effective qualitative research methods for understanding consumer preferences. They reach depth that surveys cannot: the reasoning behind choices, the emotional weight of purchasing criteria, the way people naturally describe their problems. Quantitative data from statistical analysis provides the numerical foundation: market share figures, pricing benchmarks, customer satisfaction scores. Qualitative data explains why those numbers look the way they do.
The most reliable market research process uses both. Over 70% of market research projects combine primary and secondary research (ESOMAR). Data analysis converts the combined inputs into market insights worth acting on. Common methods include surveys, focus groups, interviews, and statistical analysis, often supported by data visualization tools that surface patterns spreadsheets would hide.
Data validation matters more than data volume. Triangulating findings across multiple independent sources prevents the common mistake of building strategy on a single data set that happens to confirm what you already believed. Data accuracy is the foundation. Without it, the analysis is just speculation wearing a suit.
Three market analysis examples worth studying
The best way to understand what good market analysis looks like is to study real ones. These three cover different contexts: a consumer IPO filing, an academic pricing debate, and a practical B2B SaaS exercise.
Airbnb's S-1: redefining what the competition actually is
Airbnb's IPO filing in November 2020 contained one of the strongest market sizing exercises in recent corporate history. Rather than citing a single TAM figure, Airbnb broke its total addressable market into three defensible segments: $1.8 trillion in short-term stays, $210 billion in long-term stays, and $1.4 trillion in experiences.
The move that makes this a standout market analysis example is the reframe. Airbnb did not position as a hotel competitor. It positioned as the creator of an entirely new accommodation category, citing 4 million hosts and 5.6 million active listings as proof of market creation rather than market share capture. The data was anchored in 2019 pre-pandemic actuals, which gave the market forecast something investors could independently verify.
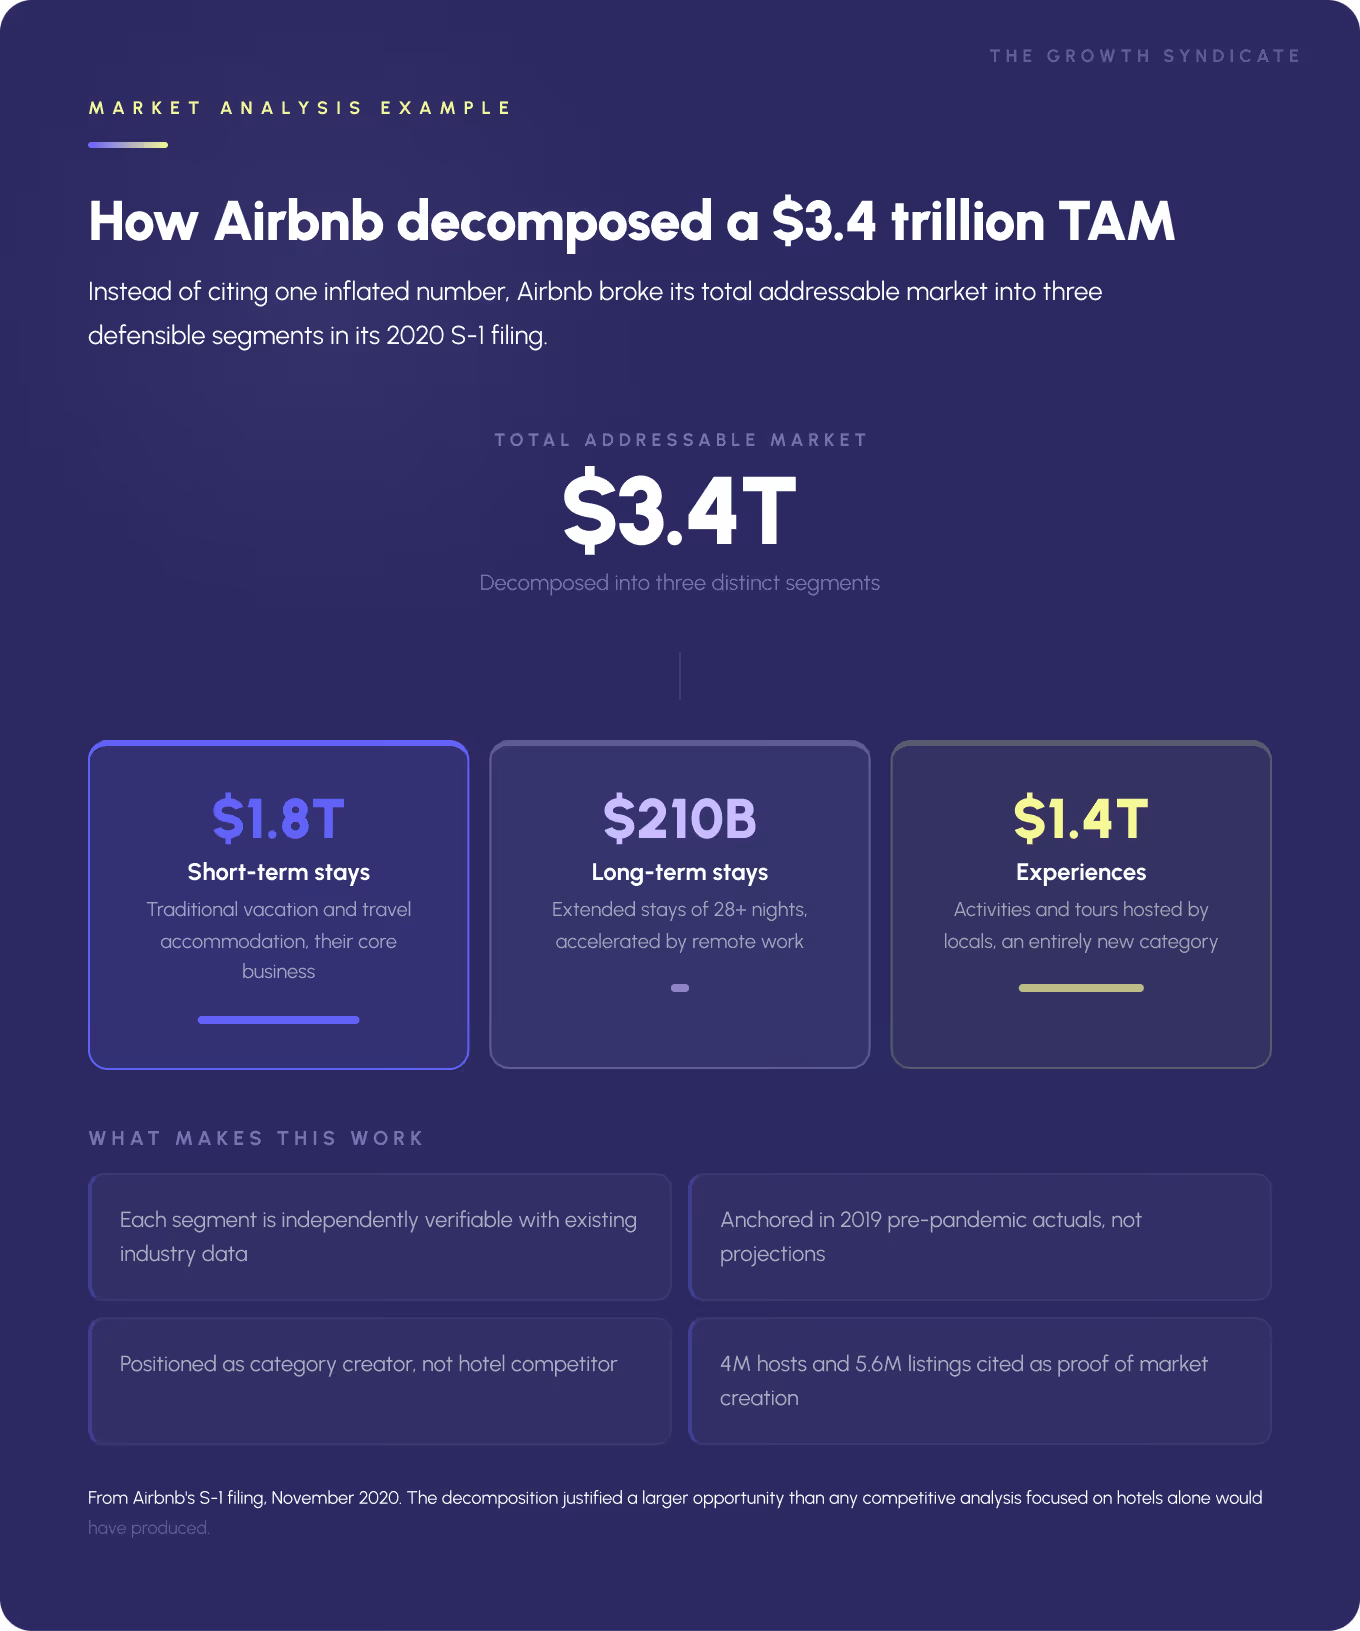
By redefining the boundaries of its target market, Airbnb justified a larger opportunity than any competitive analysis scoped to hotels alone would have produced.
The Uber TAM debate: same market, wildly different answers
This is probably the most widely taught market sizing case study in business schools today. In 2014, NYU professor Aswath Damodaran sized Uber's market using a top-down approach. He started from the global taxi and limousine industry at roughly $100 billion and arrived at a $5.9 billion valuation. Bill Gurley at Benchmark Capital responded with a bottom-up analysis arguing the true opportunity was between $450 billion and $1.3 trillion, because Uber could replace car ownership within a $6 trillion personal transportation market.
Gurley's core argument was that products which reshape the experience expand the market rather than taking market share from incumbents. When you materially improve an offering and create new use cases, sizing the opportunity based on the existing industry becomes misleading.
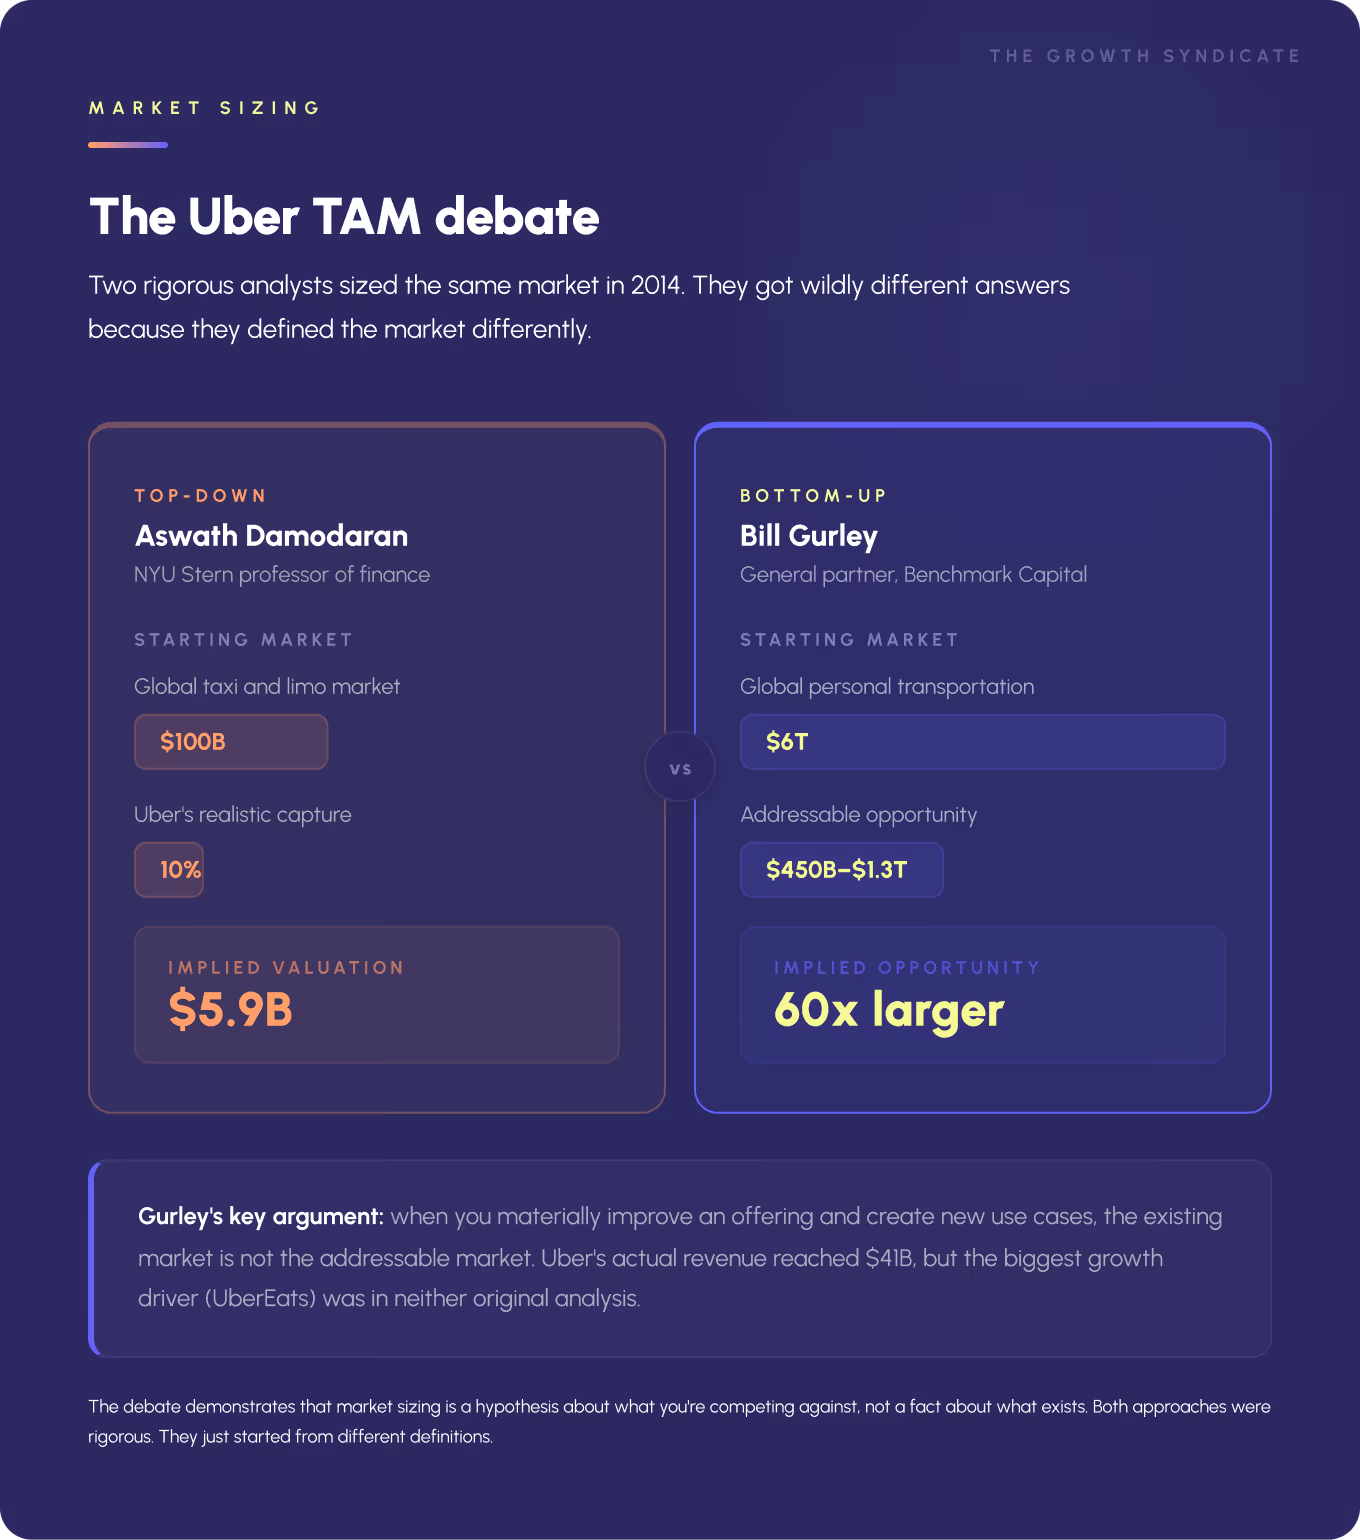
Uber's actual trajectory partially validated both. Revenue reached $41 billion at a market cap near $180 billion. But the single largest growth driver turned out to be UberEats, which now generates over 30% of revenue and appeared in neither original analysis. The case is worth studying because it demonstrates that market analysis is a hypothesis about what you are competing against, not a fact about what already exists. Even careful data analysis on both sides missed the growth vector that actually mattered.
A B2B SaaS walkthrough: project management for construction
Consider a company building project management software specifically for construction firms. A working market analysis would layer several types of market research.
Market sizing uses both approaches. Top-down: the global construction PM software market sits at approximately $9.3 billion (2024), growing at around 10% CAGR. Bottom-up: estimated number of construction firms in the target geography, multiplied by average annual software spend per firm.
Customer analysis draws on focus groups and interviews with construction project managers to map workflows, frustrations, and purchasing criteria. Secondary research from published reports and review platforms like G2 adds a layer of competitor intelligence.
Competitive market analysis profiles direct competitors (Procore, Autodesk Construction Cloud, Buildertrend) alongside indirect alternatives (spreadsheets, email-based coordination, generic PM tools). Each competitor's market position, pricing, and differentiation is documented.
External factors round out the picture: labor shortages pushing demand for efficiency tools, regulatory changes around building information modeling, economic trends splitting commercial from residential construction.
What the analysis reveals is that enterprise construction firms are well-served by existing tools, but mid-size specialty contractors face a genuine gap. Enterprise-grade tools are overpriced for their needs. Generic software does not understand construction workflows. That gap is the target market where the company concentrates its marketing strategies.
Where frameworks fall short
Most guides present market analysis frameworks as though completing one produces a reliable answer. That framing is wrong. The frameworks provide structure. Structure is useful. But structure is not truth, and the distance between filling in a framework and understanding a market is larger than most people acknowledge.

Essentially, TAM figures are routinely reverse-engineered from whatever conclusion the founder wanted to reach. You can define the variables broadly enough to produce almost any number you want, which means the output carries the same subjectivity as the judgment behind it.
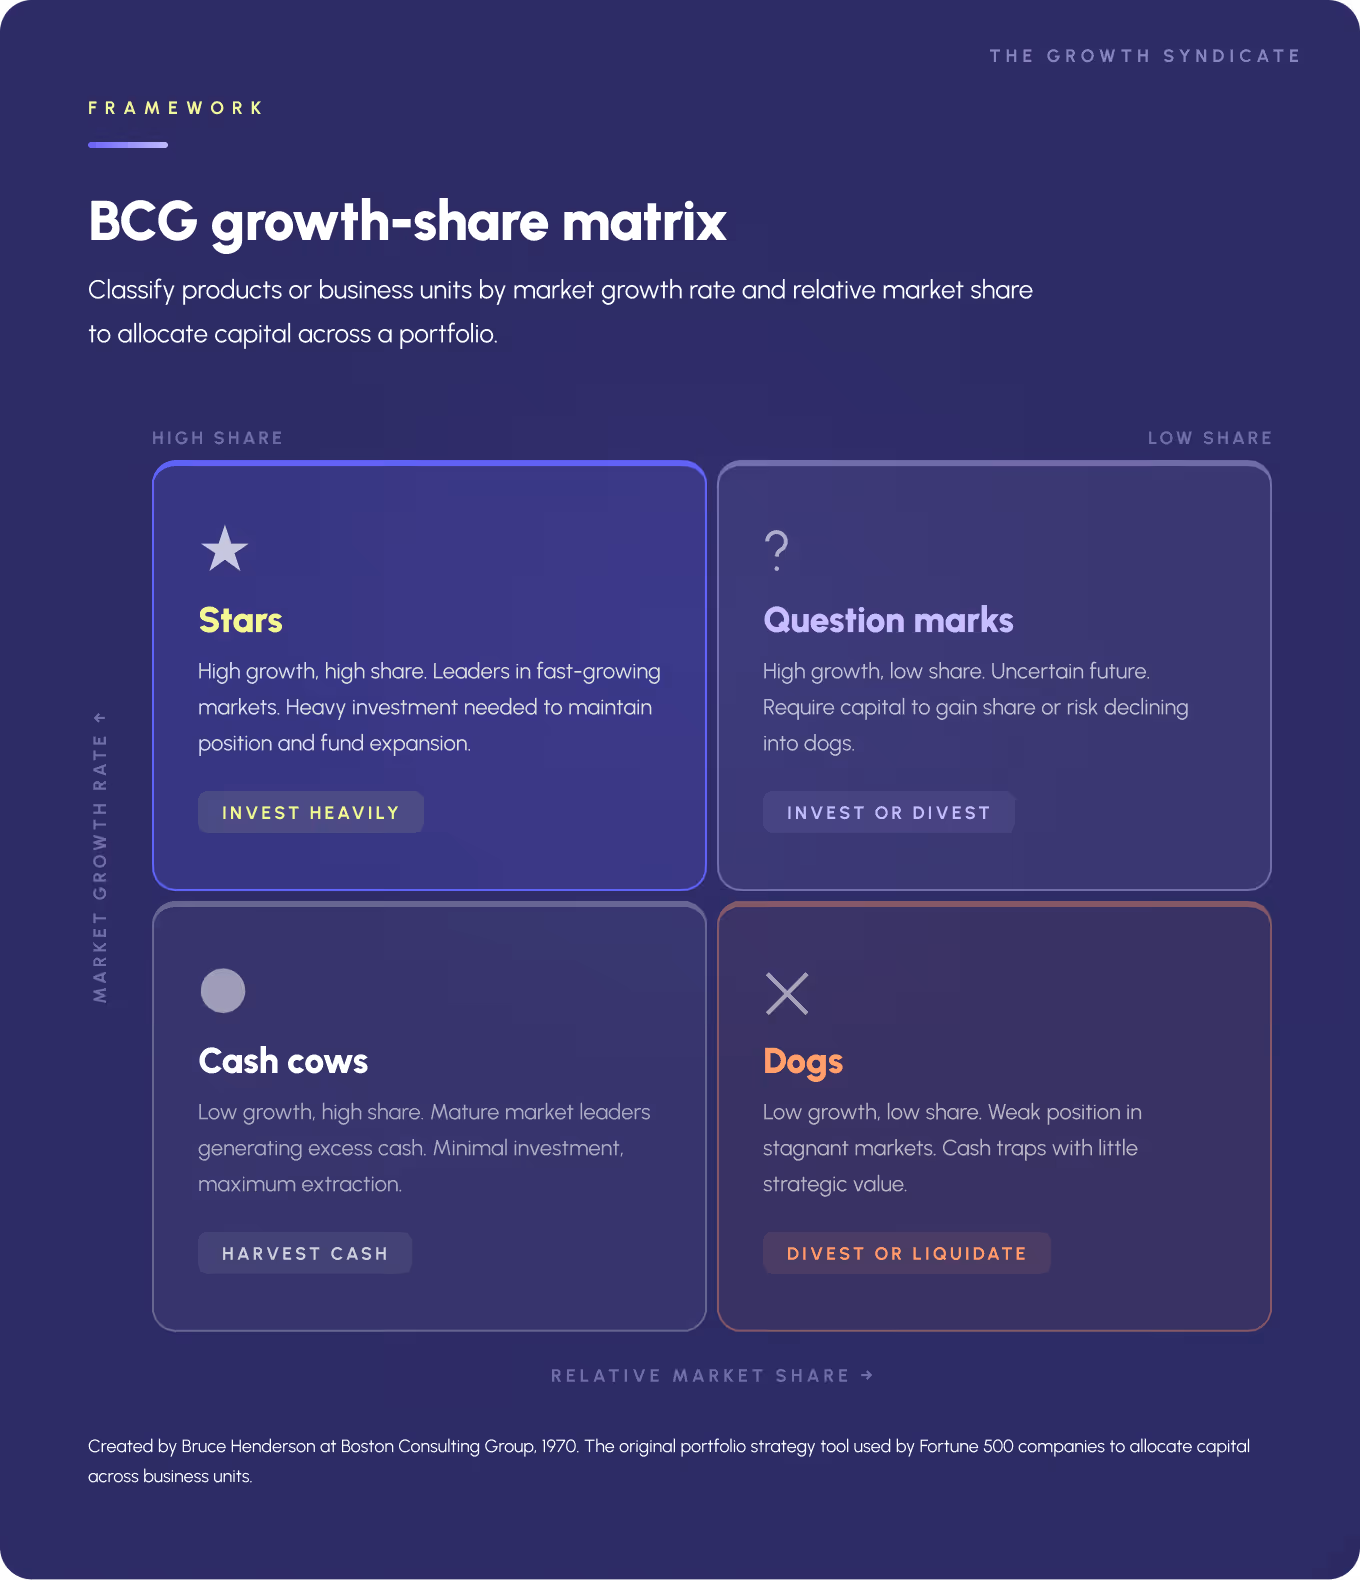
That does not make the frameworks worthless. The BCG Growth-Share Matrix helps when a company faces a genuine question about resource allocation across a portfolio. April Dunford's positioning work forces companies to commit to a category, name their actual competitors, and pick one differentiator they will hang everything on. These frameworks earn their keep when they force hard decisions.

The honest answer about when formal market analysis is worth the investment comes down to three situations. Entering a market where you lack firsthand knowledge of how customers behave and who the real competition is. Raising capital and needing to demonstrate opportunity to investors who have not seen the market themselves. Responding to a dramatic shift in competition that puts your current market position at risk.
Outside those situations, structured experimentation with real customers in real conditions will teach you more about your market than any framework will.
.avif)
How to conduct a market analysis
When you conduct a market analysis, the process determines whether the output is useful or decorative. Here is how to structure it.
Define what you actually need to know
Every market analysis should begin with a specific question. Are we entering a new market segment? Is our target audience actually the right one? Where is competition moving? The question shapes everything downstream. Without one, market research turns into data collection that nobody acts on.
Size the opportunity
Use top-down and bottom-up approaches to estimate market size. Cross-reference with industry reports, government databases, trade associations, and market research firms. Where estimates converge, you have something you can plan around. Where they diverge, the assumptions underneath need examination, not the numbers on top.
Identify and segment the target market
Define your target audience through a combination of demographic, firmographic, psychographic, and behavioral criteria. Then test those definitions. Conduct market research through surveys, focus groups, and customer interviews to check what you think you know about consumer preferences against what buyers actually say. Focus groups are especially valuable here because they surface the needs a market has not articulated yet, the ones that do not show up in search data or survey responses.
Map the competition
Profile five to ten competitors. Document their market position, pricing, strengths, weaknesses, marketing strategies, and marketing efforts in content and search. Understanding the full competitive landscape means looking beyond direct rivals to include indirect alternatives. A SWOT analysis gives you a reasonable starting framework, but stacking too many without clear purpose creates noise.
Scan for external shifts
Assess the broader environment for political, economic, social, technological, legal, and environmental factors that could reshape market dynamics within the next 12 to 24 months. Emerging trends in consumer behavior, technology adoption, and regulation tend to create the openings that incumbents miss and new entrants exploit.
Collect and validate
Gather data through primary and secondary research. Primary market research from focus groups, surveys, and interviews gives you specificity. Secondary research from industry reports, market reports, and competitor filings gives you scale and benchmarks. Triangulate to avoid building on a single source. Analyzing data from multiple independent inputs catches the blind spots that any individual market research method will have.
Distinguish what you know from what you assume
Qualitative data tells you why. Quantitative data tells you what. Data transformation from raw observations to structured insights requires honest assessment of what the data supports versus what you want it to support. The difference between good market research and self-serving market research is whether the analyst is willing to discard findings that contradict the preferred business strategies. That distinction matters more than most people admit.
Turn analysis into decisions
This is where the majority of market analyses fail. The output should not be a report that gets filed. It should be a set of decisions. What market segment are you targeting? What is your competitive advantage there? What business strategies follow from that position? What will you stop doing?
Market analysis that ends in a document rather than changed behavior is market analysis that accomplished nothing.
Data sources worth knowing
The quality of a market analysis depends on what it is built from. Here is where the most reliable market research data comes from and what each source is best suited for.
Government and public databases
Government databases remain the most defensible secondary data for market research. The U.S. Census Bureau, Bureau of Labor Statistics, and Bureau of Economic Analysis cover domestic markets. Eurostat, OECD Data, and World Bank indicators serve international analysis.
Premium research providers
Industry reports from IBISWorld, Euromonitor International, Gartner, and Forrester offer depth that general databases cannot. A word of caution: lower-tier report mills that publish uniform double-digit growth projections across unrelated markets exist in large numbers.
Digital intelligence and data visualization
SimilarWeb provides traffic intelligence across 190 countries. SEMrush covers keyword and content analysis. Google Trends remains the most accessible free tool for spotting shifts in search behavior and consumer spending patterns. Social listening tools that incorporate natural language processing now detect sentiment and emerging trends in real time. Data visualization platforms make it possible to surface patterns in market data that raw spreadsheets would obscure. Data analysis at scale has become substantially more accessible than it was even three years ago.
Primary research tools
Survey platforms, customer interview protocols, and structured focus groups remain the most reliable tools for primary market research. Quantitative research establishes what is happening. Qualitative research explains why. Statistical methods and statistical analysis convert both into something you can build a successful business strategy on.
How market analysis connects to growth
Market analysis is often treated as a one-time exercise that produces a document. The companies that get the most from it treat it as an input that shapes how they show up in their market over months and years.
The companies that educate tend to win
The gap between completing a market analysis and actually growing is smaller than most companies assume. But that gap only closes if the analysis changes what you do.
"The company that educates the market usually wins the deal. Not because they have the best product. Because they shaped how the buyer thinks about the problem."Ferdinand Goetzen, co-founder, The Growth Syndicate
What this means in practice is that market analysis is not just about sizing an opportunity. It is about understanding where your market learns, what frameworks buyers use when they evaluate options, and how your marketing efforts can shape those evaluation criteria before competitors do.
Most of your market is not buying right now
There is a pattern that shows up across B2B companies regardless of industry or size. The buyer already knows who they will call before they start looking. Clément Dumont, co-founder of The Growth Syndicate, describes it from personal experience.
Ninety to 95% of potential customers in any B2B market are out of market at any given moment. They are not searching, not comparing, not ready. The companies that appear on buyer shortlists when intent finally emerges are the ones that showed up consistently for months or years before the purchase trigger arrived.
Two layers of strategy
This means market analysis should inform two distinct layers of marketing strategies. Demand capture targets the 4 to 5% of your target audience that is actively evaluating solutions right now. Demand generation builds awareness and credibility with the other 95% so your company already sits on the shortlist when they move from out-of-market to in-market.
The strongest market analysis examples connect both layers. They identify the market size and the competitive dynamics, but they also surface the specific customer analysis insights that determine how and where a company shows up throughout the buyer's full decision process. That connection between market research and sustained market presence is where competitive advantage actually compounds.
What to remember
If you take one thing from this guide, let it be this: the frameworks are containers, not answers. What you put in them determines what you get out.
Qualities of strong market analysis
A market analysis is a structured process for understanding market conditions, customer behavior, and the competitive dynamics of your industry. The strongest market analysis examples share a few qualities. They draw on multiple data collection methods and research methodologies. They check market data against independent sources rather than relying on a single input. They connect their findings to specific business decisions. And they stay honest about the boundaries of what they actually know versus what they are guessing at.
Frameworks are starting points
Frameworks like SWOT, Porter's Five Forces, and TAM/SAM/SOM provide structure. That structure is useful. But the companies that extract the most value from market analysis are the ones that conduct market research with discipline, interpret it with appropriate skepticism, and revisit their conclusions as new market data arrives rather than treating the initial analysis as settled.
Market trends shift. Consumer preferences evolve. Competition reorganizes. The ability to conduct a market analysis iteratively, to track market trends as they develop and adjust business strategies in response, is a competitive edge that compounds over time.

.png)