.svg)


Every quarter, the same question lands in B2B marketing meetings. Are these numbers any good? A 2.9% website conversion rate sounds modest until you learn it sits right on the B2B average. A $5.58 cost per click feels expensive until you see what competitors pay for the same intent. B2B marketing benchmarks exist to answer that question, and the good ones turn a wall of marketing metrics into a clear read on where you stand.
The catch is that benchmarks are easy to misuse. Pulled from the wrong source or compared against the wrong segment, they flatter weak campaigns and trigger panic about strong ones. This guide collects the marketing benchmarks that matter across the full B2B funnel, from first visit to closed revenue, with the context you need to apply them properly. Every figure comes with its source and its caveats, because a benchmark without context is just a number with good PR.
A quick note on timing. The 2025 to 2026 period changed the underlying conditions that produce these numbers. Buying cycles got longer, AI search started reshaping how buyers discover vendors, and brand building came back into fashion for reasons the data now supports.
What B2B marketing benchmarks actually measure, and where they mislead
A benchmark is a reference point. It tells you how your marketing metrics compare to a wider set of companies so you can judge whether a result is strong, average, or a problem. That comparison has real commercial value when it is done well. It lets you set realistic goals, identify gaps in your funnel, and prove ROI to the people who control the budget.
Used carelessly, the same numbers do damage. Three failure modes show up again and again.
Why most benchmarking goes wrong
The first problem is definitional drift. A "lead," an "MQL," a "conversion," and a "win rate" mean different things in different studies. When one report counts every email signup as a lead and another counts only sales-accepted contacts, their conversion rates are not comparable. Roughly two thirds of B2B organizations lack shared definitions for their own funnel stages, which makes external comparison even shakier.
The second problem is source bias. Most published industry benchmarks come from vendors with an interest in the result. An SEO agency reports that SEO produces the lowest customer acquisition cost. An email platform reports that email delivers the highest ROI. These figures are useful as direction, but they often draw from the vendor's own client base, so treat any single source as one data point rather than ground truth.
The third problem is the median trap. Industry averages flatten enormous variation. B2B is not one market. A self-serve product with a $40 monthly price and an enterprise platform with six-figure contracts share almost no benchmarks, yet both get averaged into the same "B2B" figure. Company size, deal size, vertical, and sales motion all move the numbers more than the label "B2B" ever could.
How to read any benchmark before you trust it
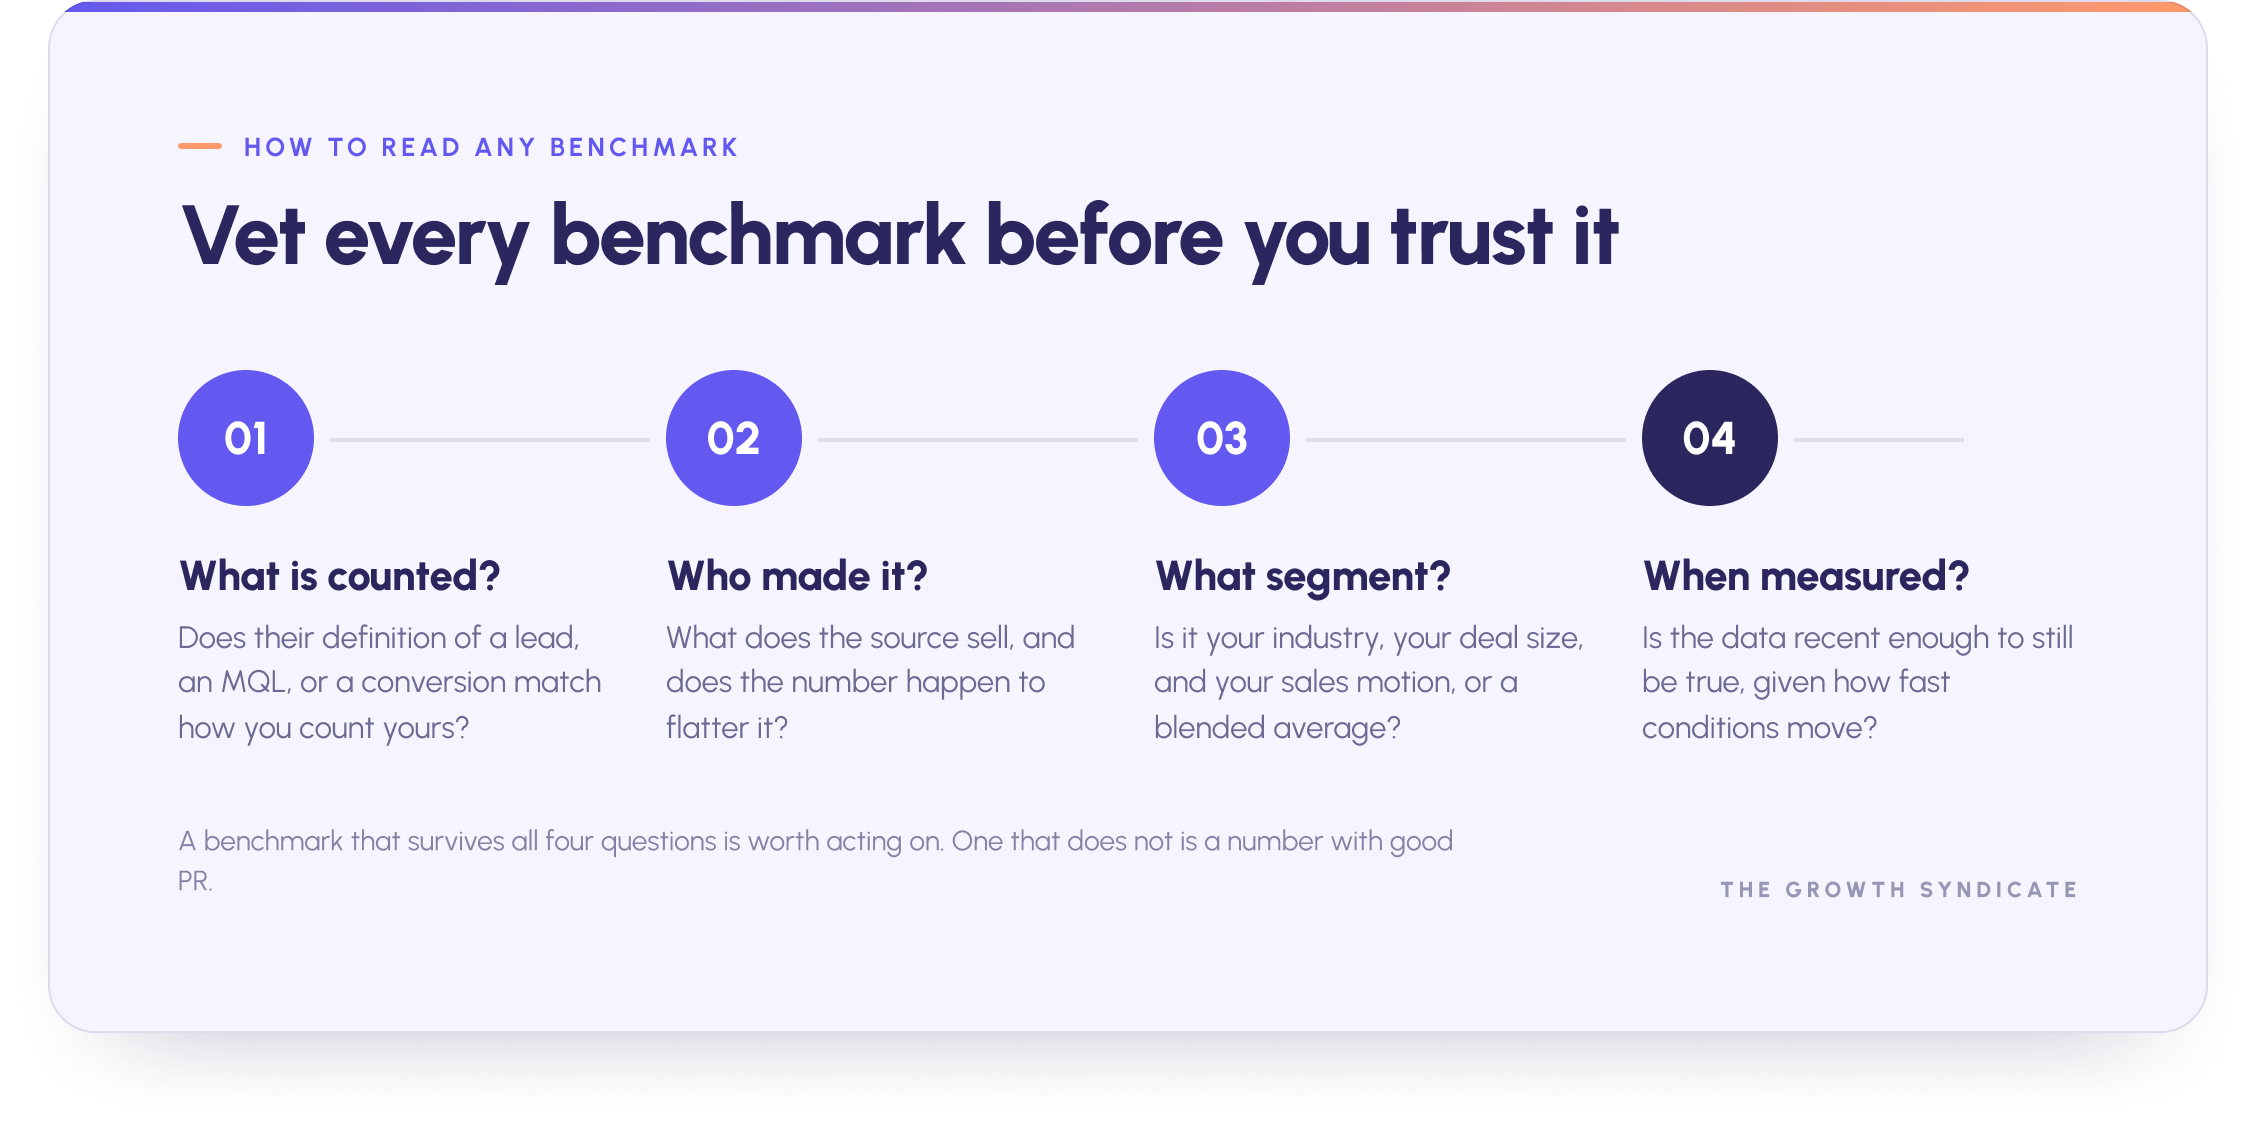
Before you compare your result to a headline figure, run it through four questions. What exactly is being counted, and does it match how you count? Who produced the data, and what do they sell? What segment does it cover, and is that your segment? When was it measured, given how fast conditions change? A benchmark that survives those four questions is worth acting on. One that does not is worth ignoring, however confident the number looks. With that discipline in place, here are the benchmarks themselves.
The full-funnel view: conversion rates from visitor to customer
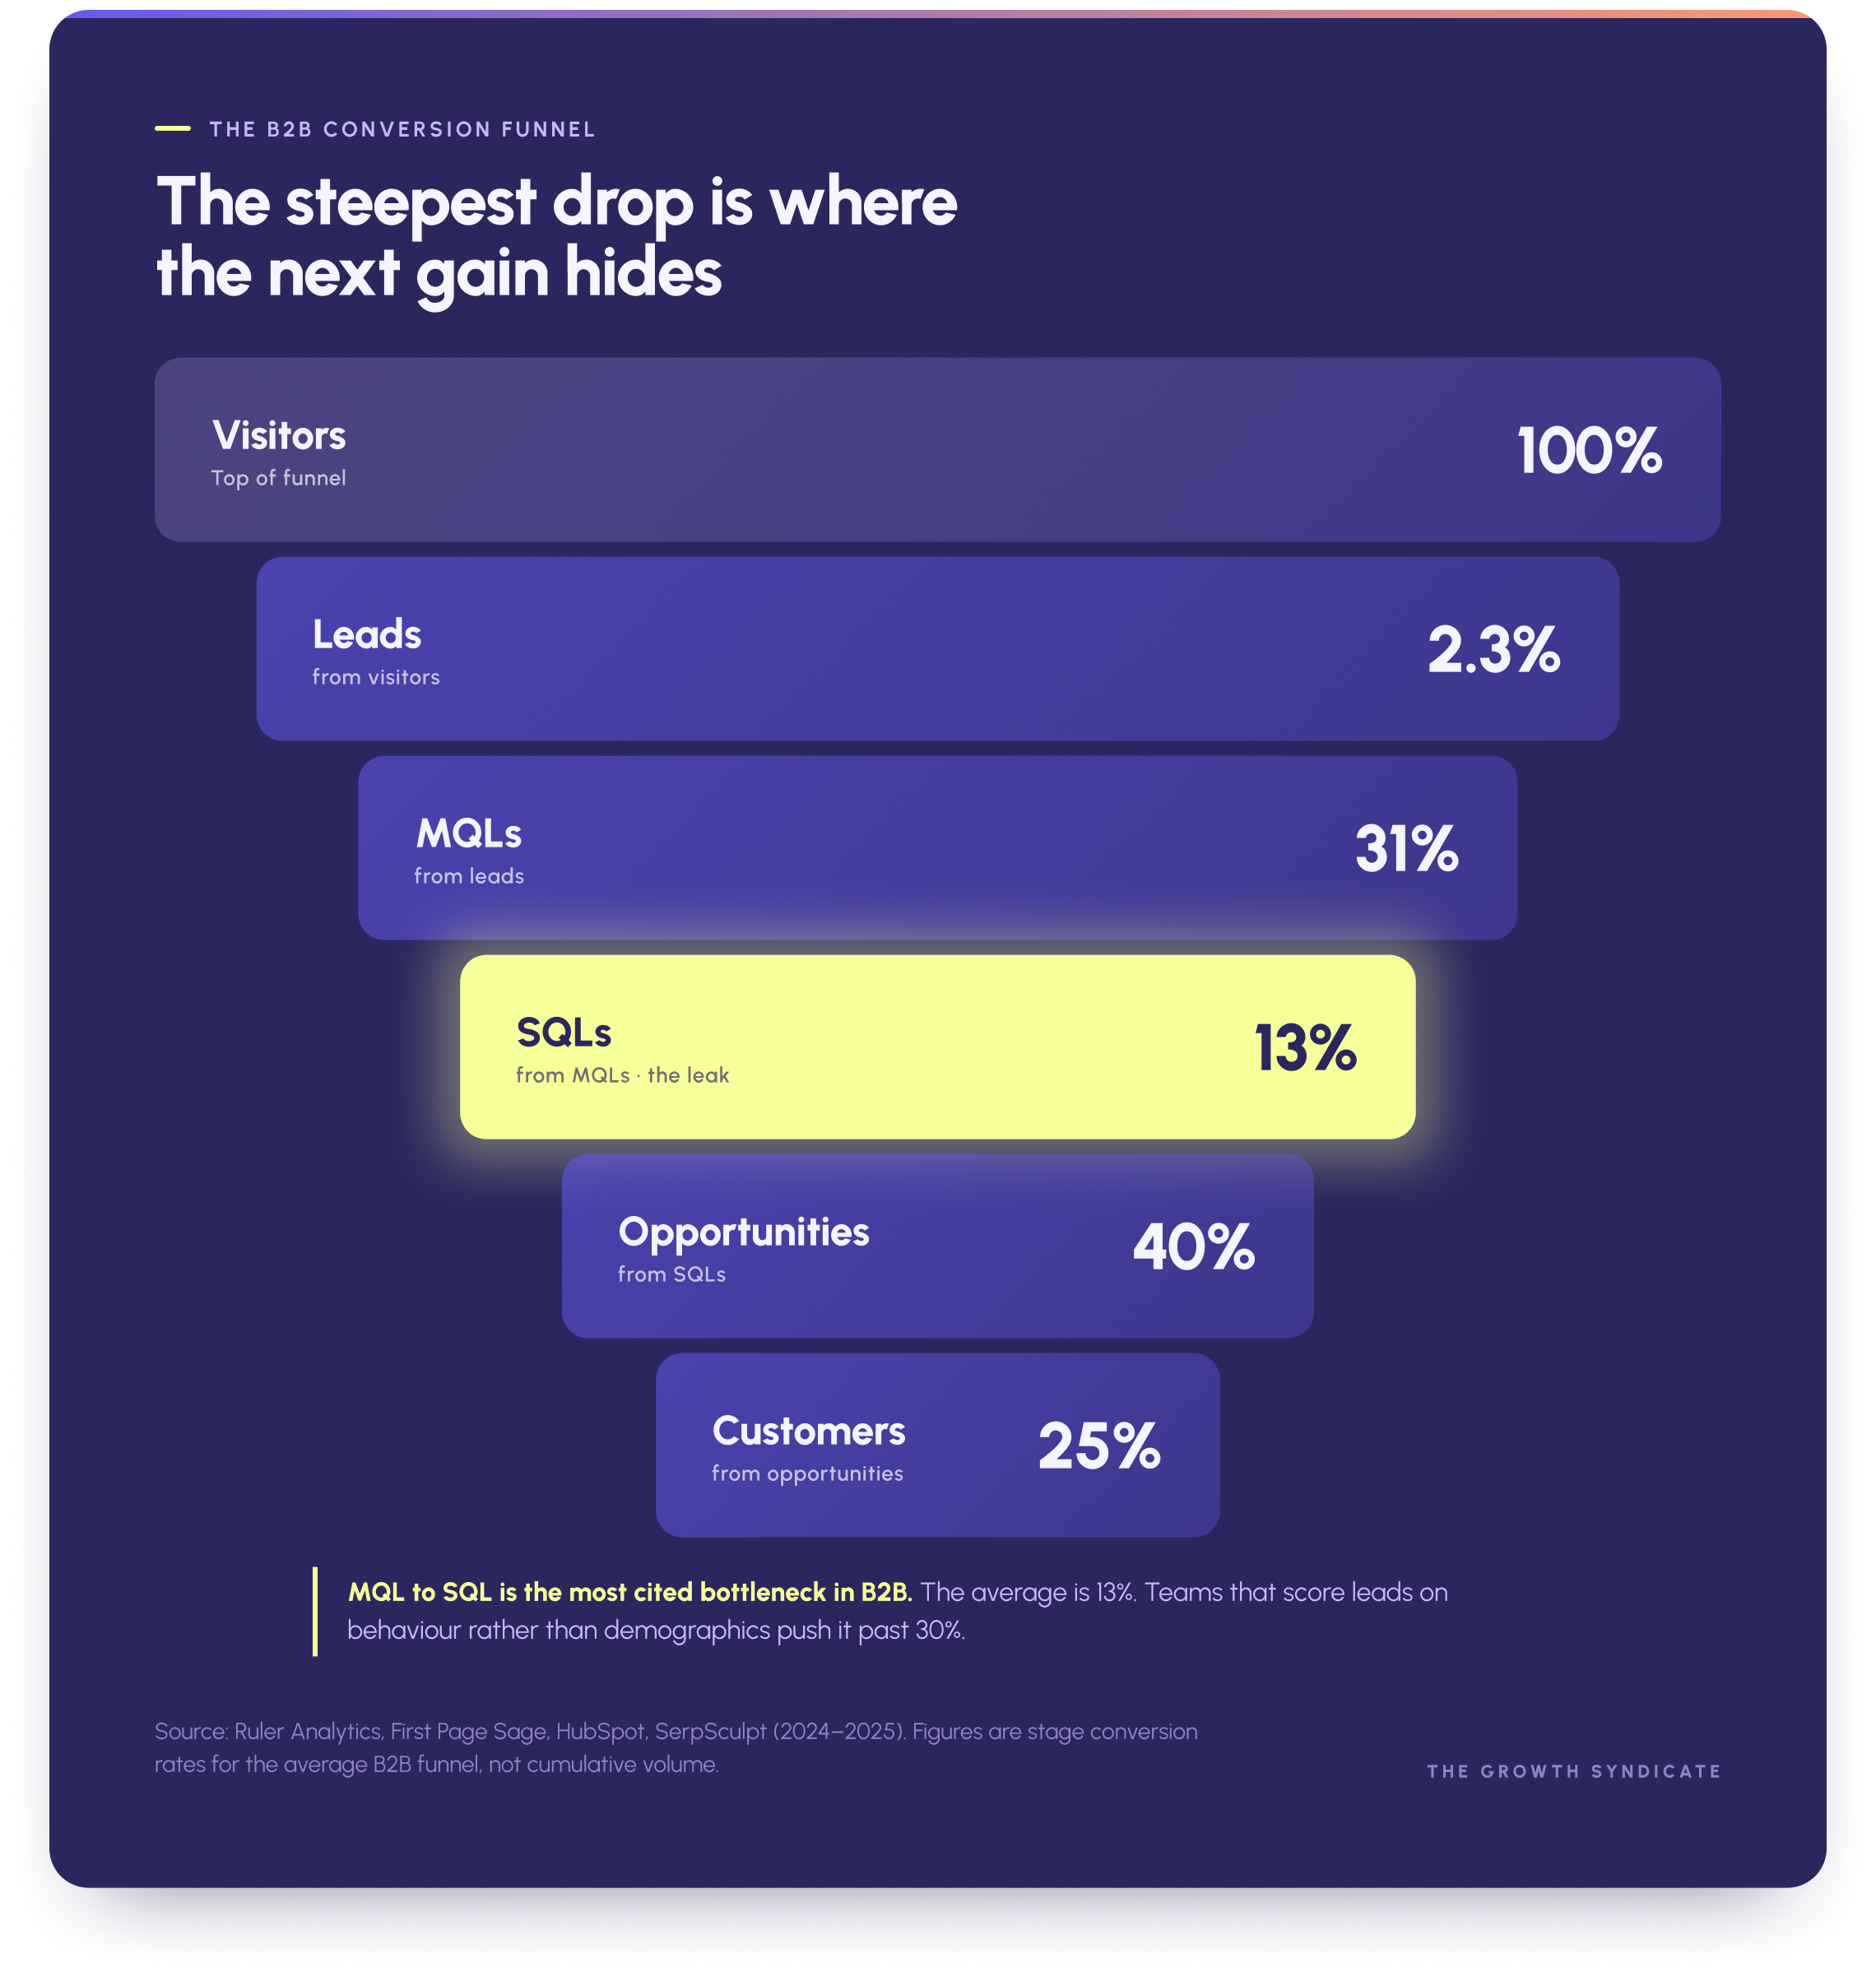
B2B funnel math is unforgiving. Across a typical funnel, a small fraction of visitors become leads and around one percent of leads become customers. The point of mapping each stage is to find the steepest drop, because that is where the next gain hides.
Visitor to lead
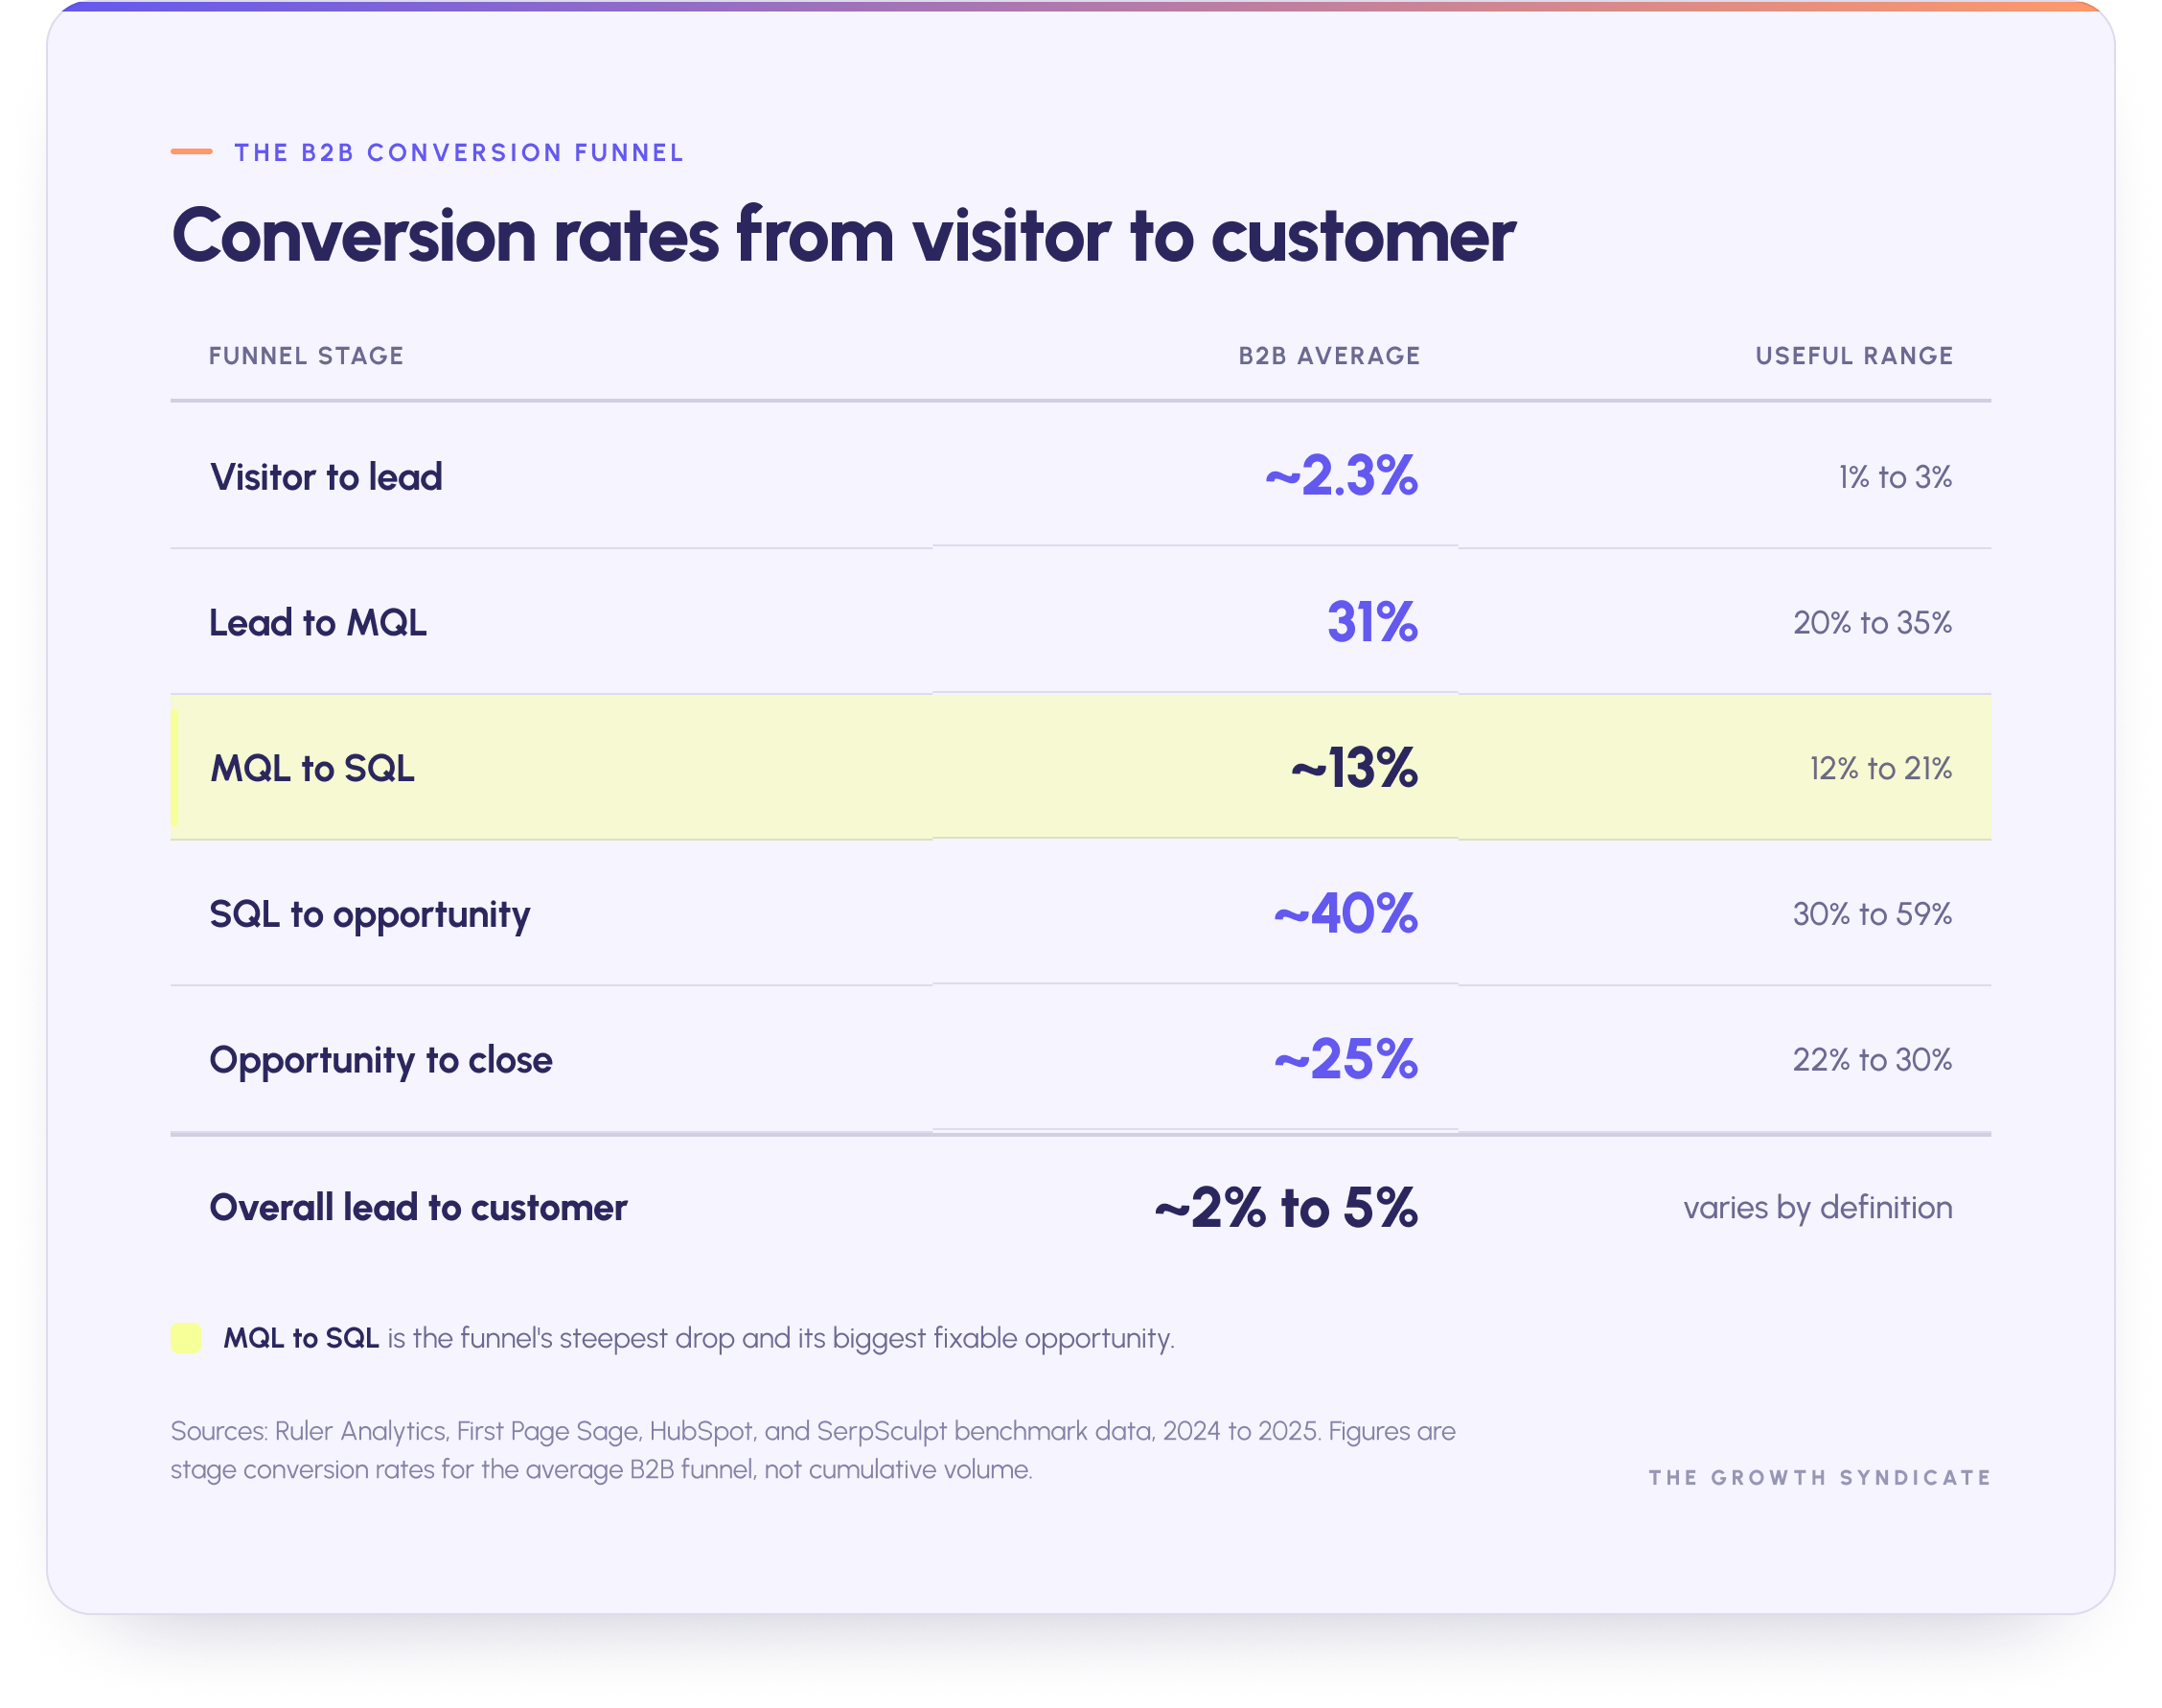
The average B2B visitor-to-lead conversion rate sits near 2.3%, and most B2B sites land somewhere between 1% and 3%. Channel matters here. Leads from organic search and referral traffic tend to convert at the higher end, while paid search often sits lower at the top of the funnel because it captures broader intent. If your visitor-to-lead rate is below 1%, the issue is usually traffic relevance or a weak offer rather than the form itself.
Lead to MQL
The lead-to-MQL conversion rate is typically 31%. This is where marketing qualifies raw interest into something worth nurturing. A rate well below that range often points to loose lead capture or a scoring model that lets unqualified contacts through.
MQL to SQL, the steepest drop
The handoff from marketing-qualified to sales-qualified is the most cited bottleneck in B2B. The industry average runs around 13%, with credible sources placing the range between 12% and 21%. Teams that use behavioural lead scoring rather than demographic scoring push this number far higher, with top performers reaching the high thirties. Because this stage is both low and high-leverage, it is the single best place to look first. Modelling from The Digital Bloom suggests that a five-point improvement here can lift downstream revenue by as much as 18%.
Opportunity to close
Once a deal becomes a real opportunity, B2B win rates cluster between 22% and 30% across all opportunities. The figure swings with deal size, which the sales section covers in detail. A low close rate paired with a healthy pipeline usually signals a qualification problem upstream rather than a closing problem at the end.
Website and engagement benchmarks
Your website is where most of the funnel above plays out, so its performance metrics deserve their own read. Google Analytics gives you everything you need to measure this, provided you compare against sensible industry standards rather than consumer web averages.
Traffic and sessions
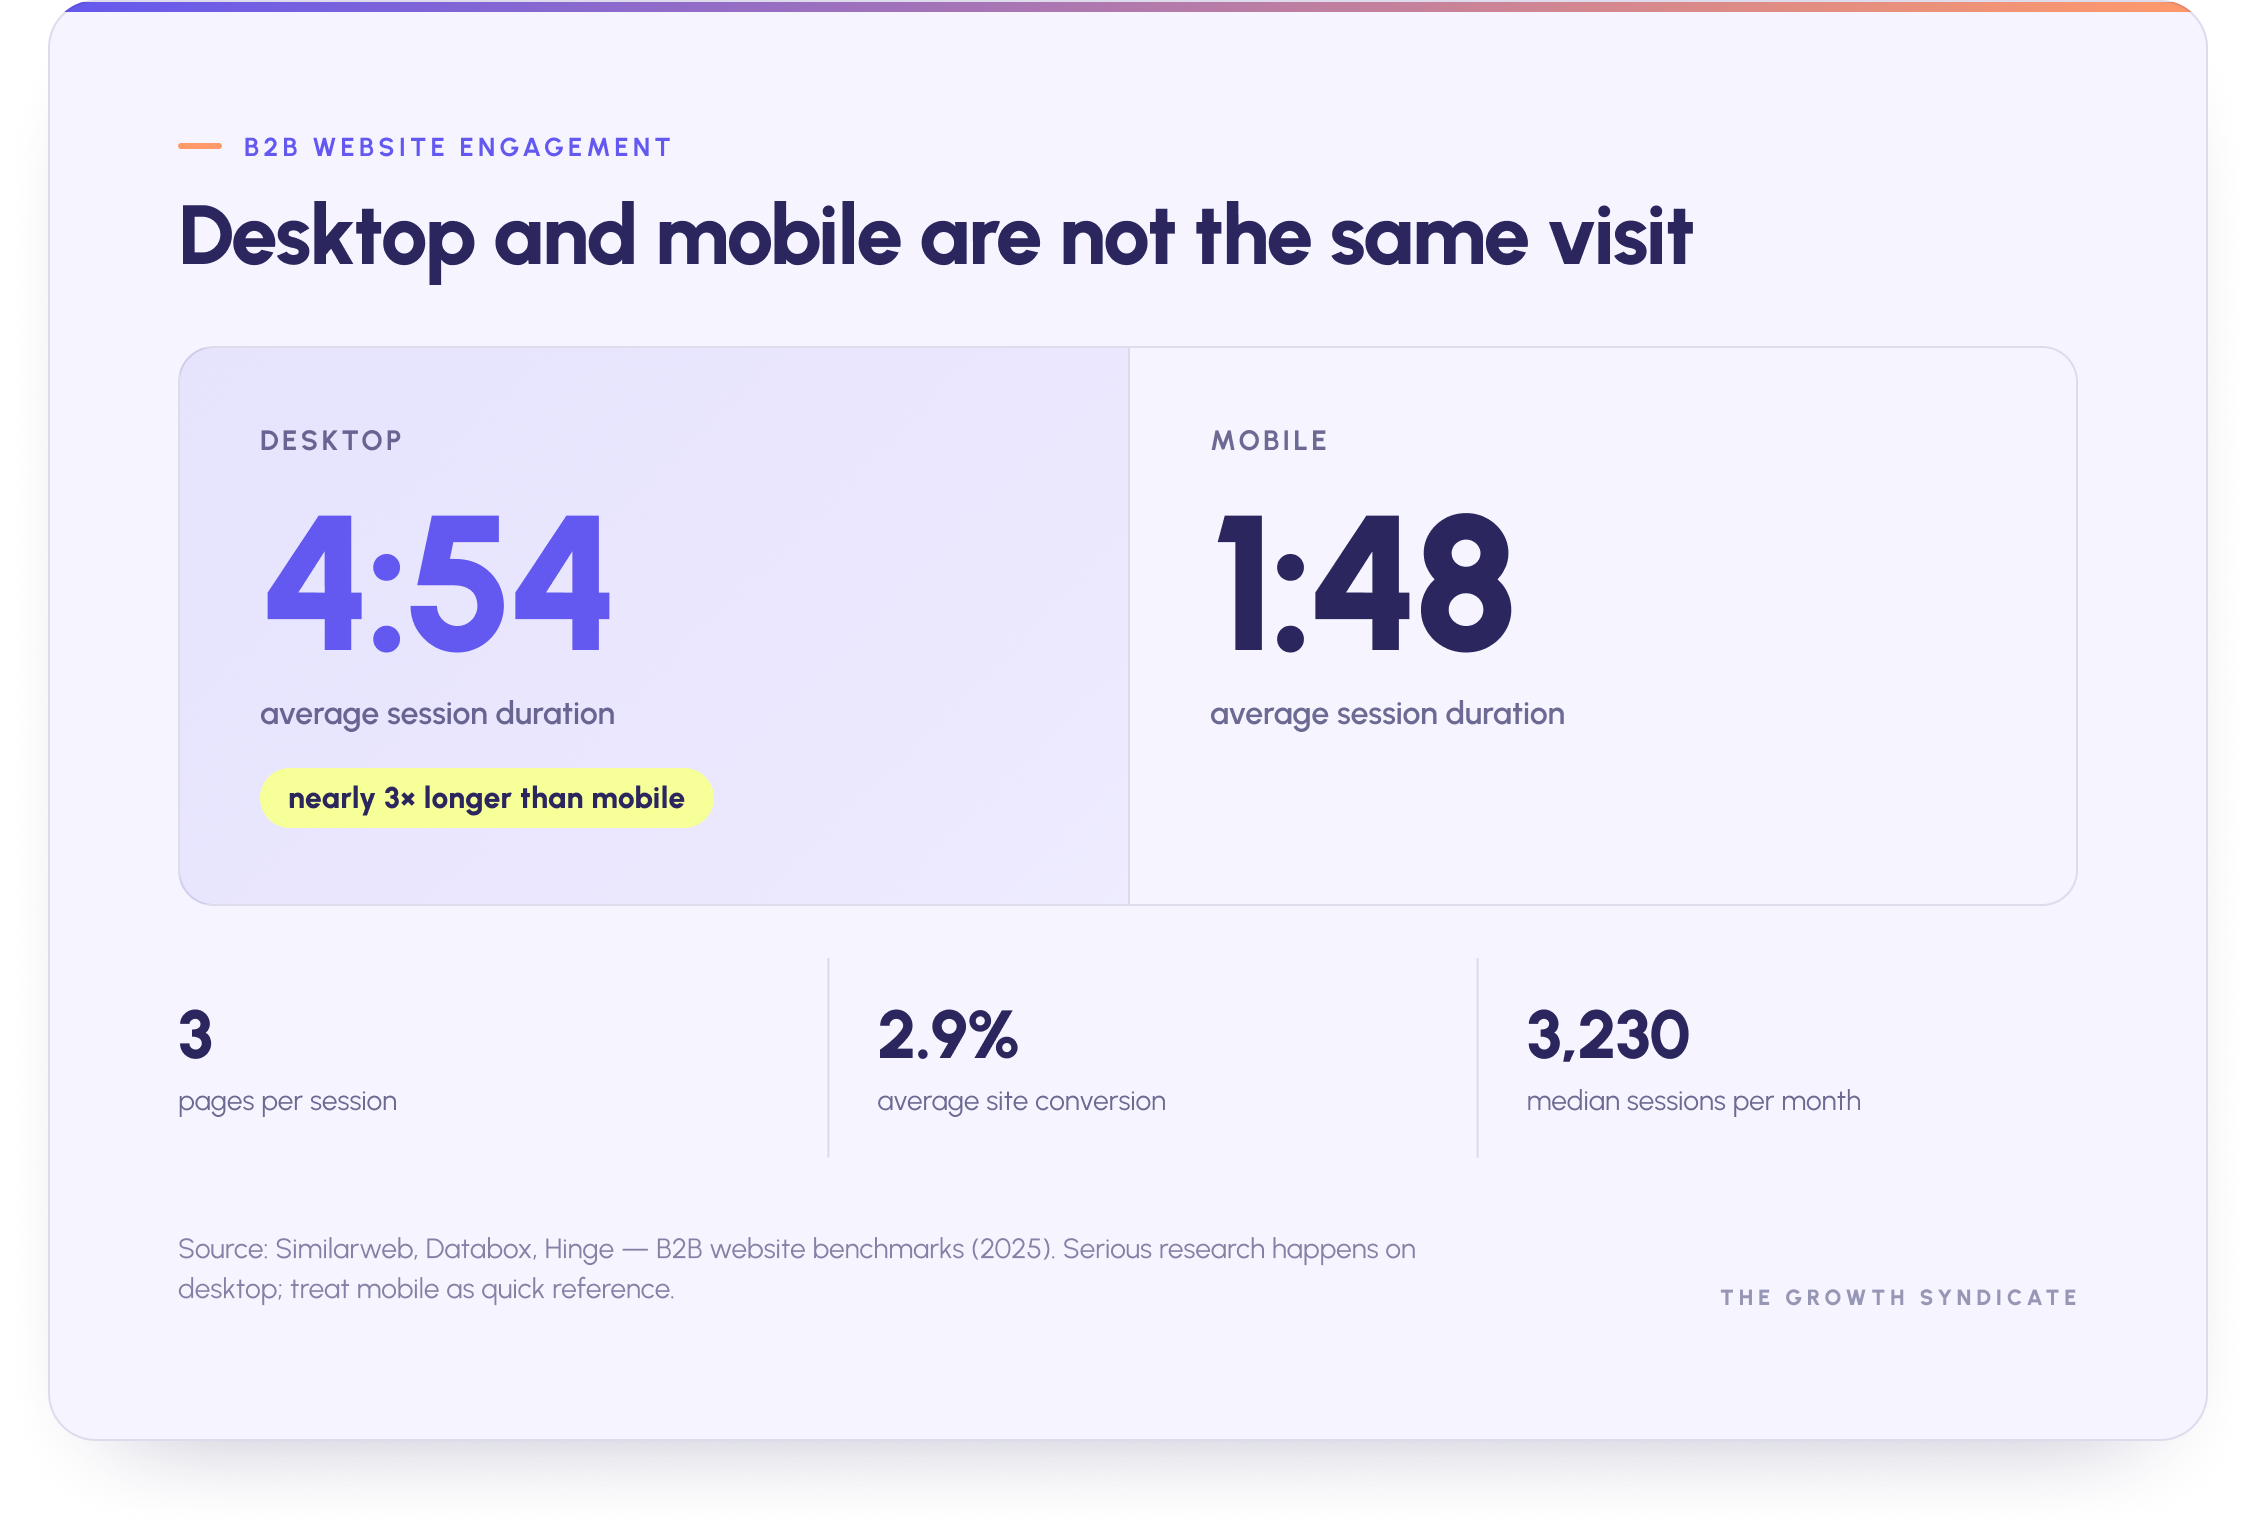
Most small to mid-sized B2B companies see between 1,000 and 10,000 monthly visitors, and the median B2B website records around 3,230 sessions per month. These figures set expectations for what a given conversion rate can produce. At 3,230 sessions and a 2.9% conversion rate, a site generates roughly 94 conversions a month, which frames how much pipeline a website realistically contributes before you scale traffic.
Bounce rate, session duration, and pages per session
Engagement depth varies sharply by device. Desktop sessions average about 4 minutes 54 seconds, while mobile sessions average about 1 minute 48 seconds. That gap is normal for B2B, where serious research happens on larger screens and mobile often serves quick reference visits. Users typically view an average of 3 pages per session. Bounce rates for B2B sites generally run between 45% and 60%, so anything under 40% is strong and anything above 70% is a warning sign worth investigating.
Website conversion
The average B2B website conversion rate is 2.9%. Broader B2B marketing benchmarks describe an overall website conversion rate of 2% to 5%, depending on how a conversion is defined and which pages are included. High-friction actions such as demo requests convert lower than low-friction actions such as content downloads, so a blended site-wide figure hides a lot of variation between page types.
Paid advertising benchmarks
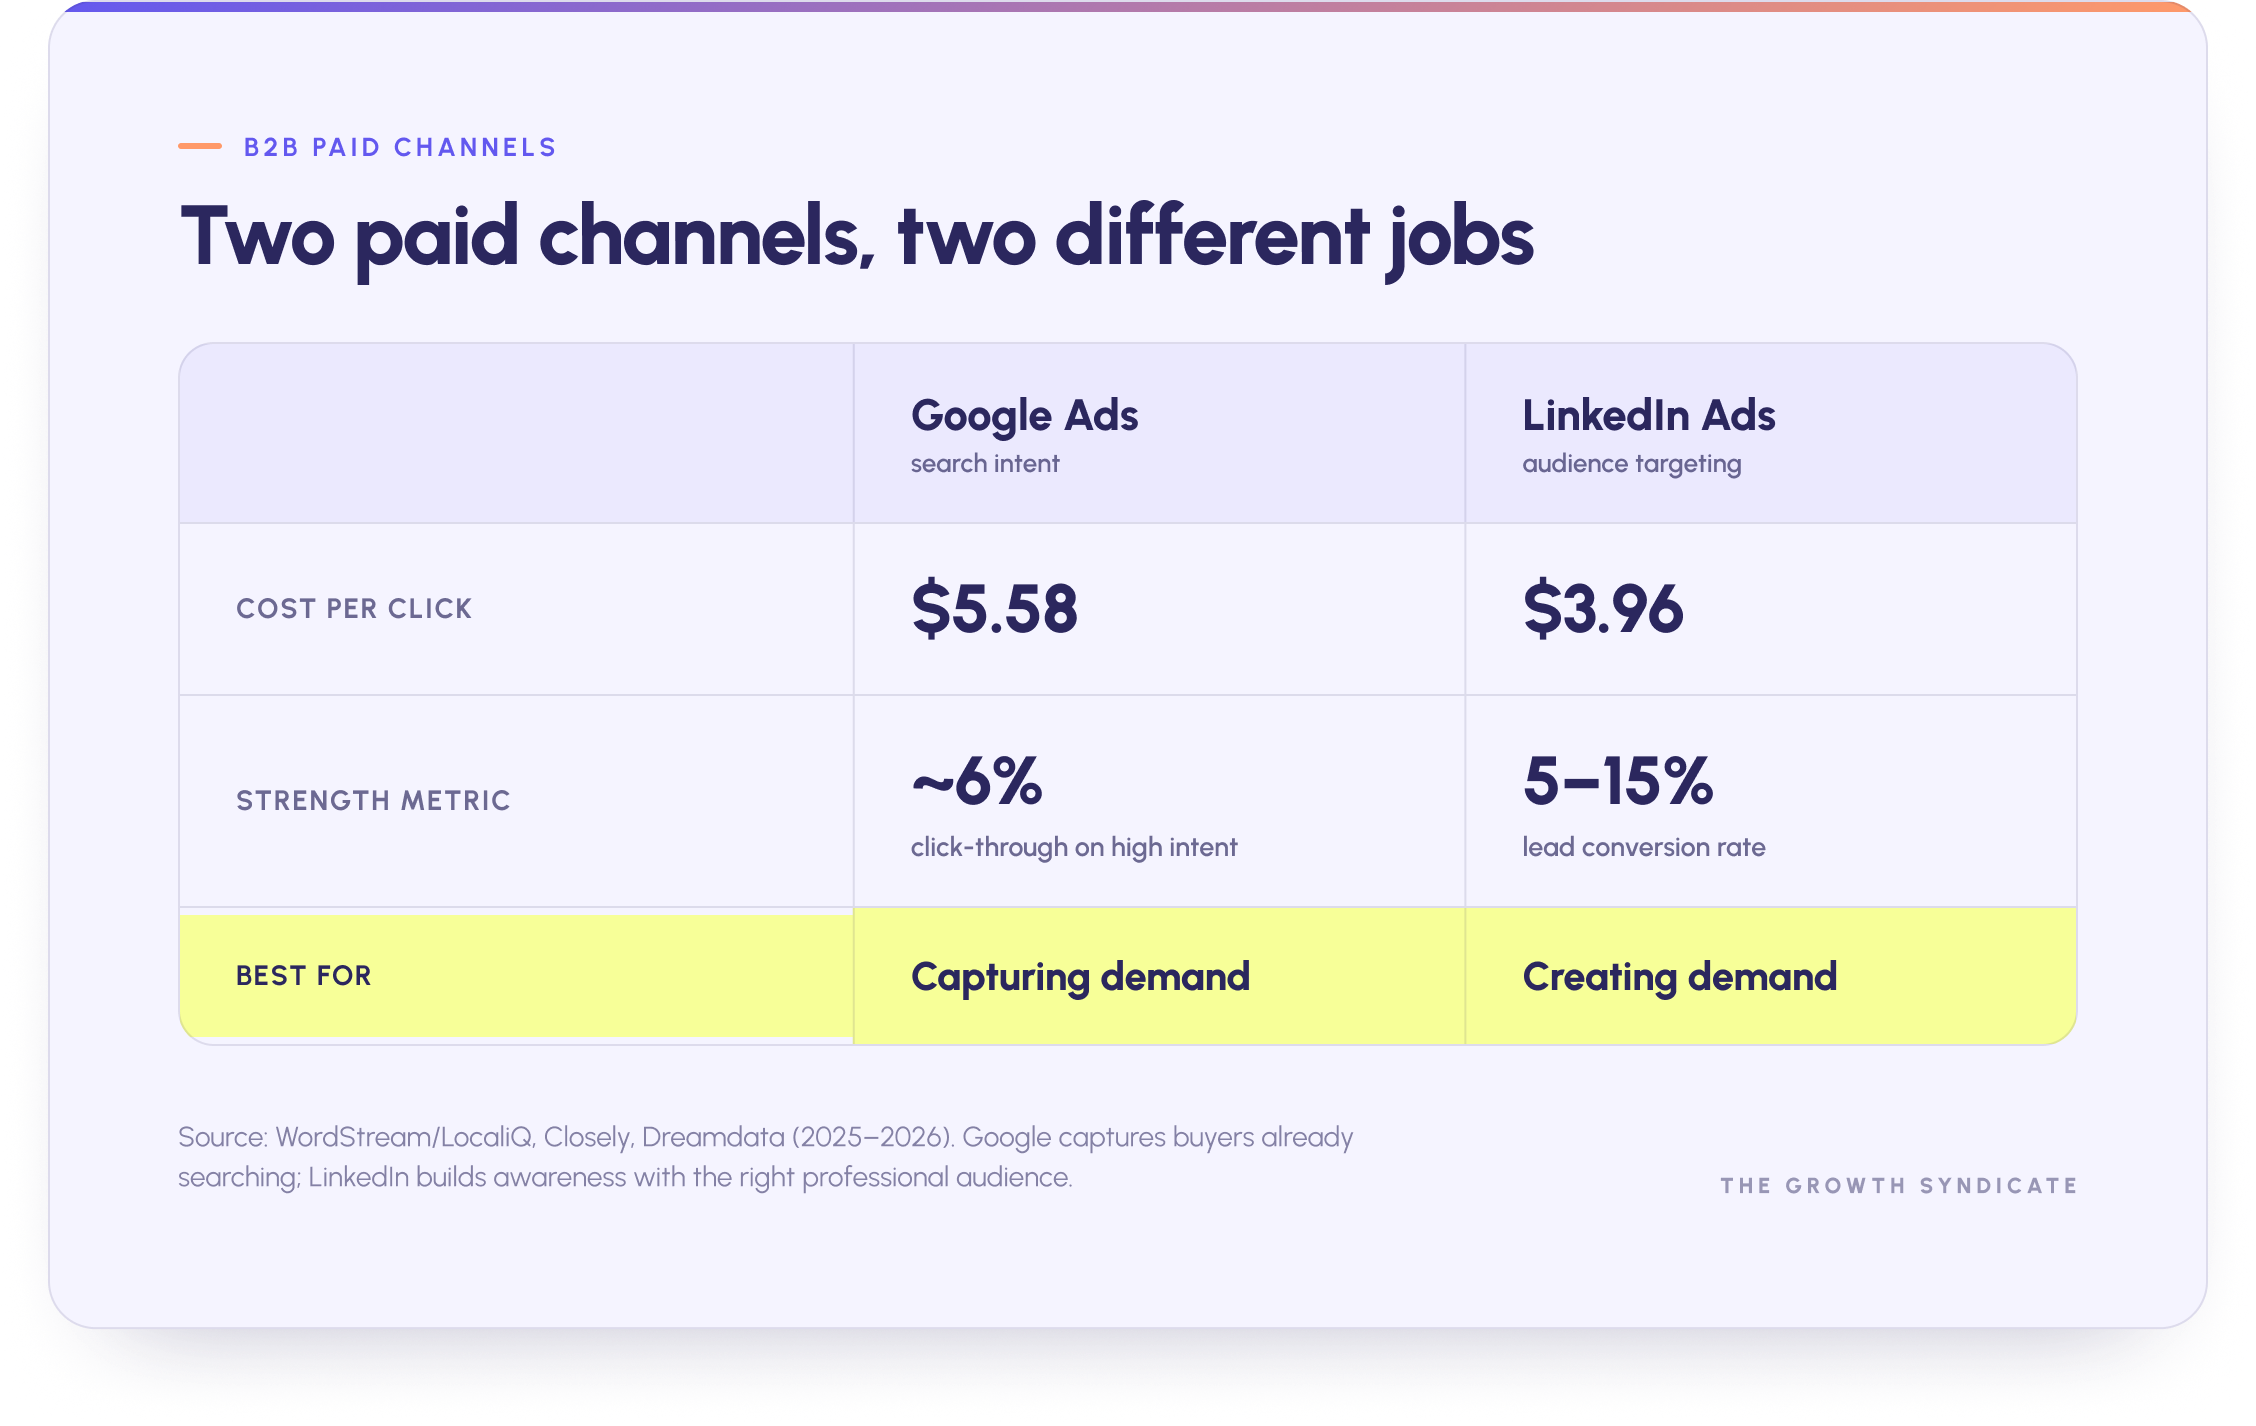
Paid channels are getting more expensive and, in many cases, more efficient at the same time. The two platforms that dominate B2B paid spend are Google and LinkedIn, and they play different roles.
Google Ads benchmarks
The average cost per click for B2B campaigns is $5.58, and B2B companies should expect a 15% to 20% year-over-year increase in CPC as competition for high-intent keywords intensifies. Google Ads campaigns work best for capturing buyers who are already searching, which is why their click-through rates and conversion rates tend to outperform broad social targeting. Across B2B paid campaigns, click-through rates often sit around 1%, though they vary widely by platform. High-intent Google search ads can clear 6%, while LinkedIn typically runs below 1%.
To reduce CPC inside Google Ads, the most reliable levers are tighter keyword intent, stronger ad copy that improves quality scores, and ruthless negative keyword lists. Better ad copy lowers cost and lifts conversion at once, which is why copy testing usually returns more than bid tinkering.
LinkedIn Ads benchmarks
LinkedIn ads carry a median CPC of $3.96, though sponsored content for senior audiences frequently costs more. The trade-off is quality. The average LinkedIn ad conversion rate ranges from 5% to 15%, well above what broad social platforms produce for B2B, because LinkedIn reaches a professional audience with accurate job and company data. Dreamdata's 2026 analysis found LinkedIn delivering stronger return on ad spend than other paid channels for B2B, which helps explain why it now captures around 41% of B2B ad budgets.
The practical read is straightforward. Use Google to capture existing demand and LinkedIn to build it among the right professional audience, then measure campaign effectiveness on pipeline contribution rather than clicks.
Email marketing benchmarks
Email remains one of the highest-return channels in B2B, and it is also one of the most mismeasured. Getting the benchmarks right means knowing which marketing metrics still tell the truth.
Open rates and the privacy problem
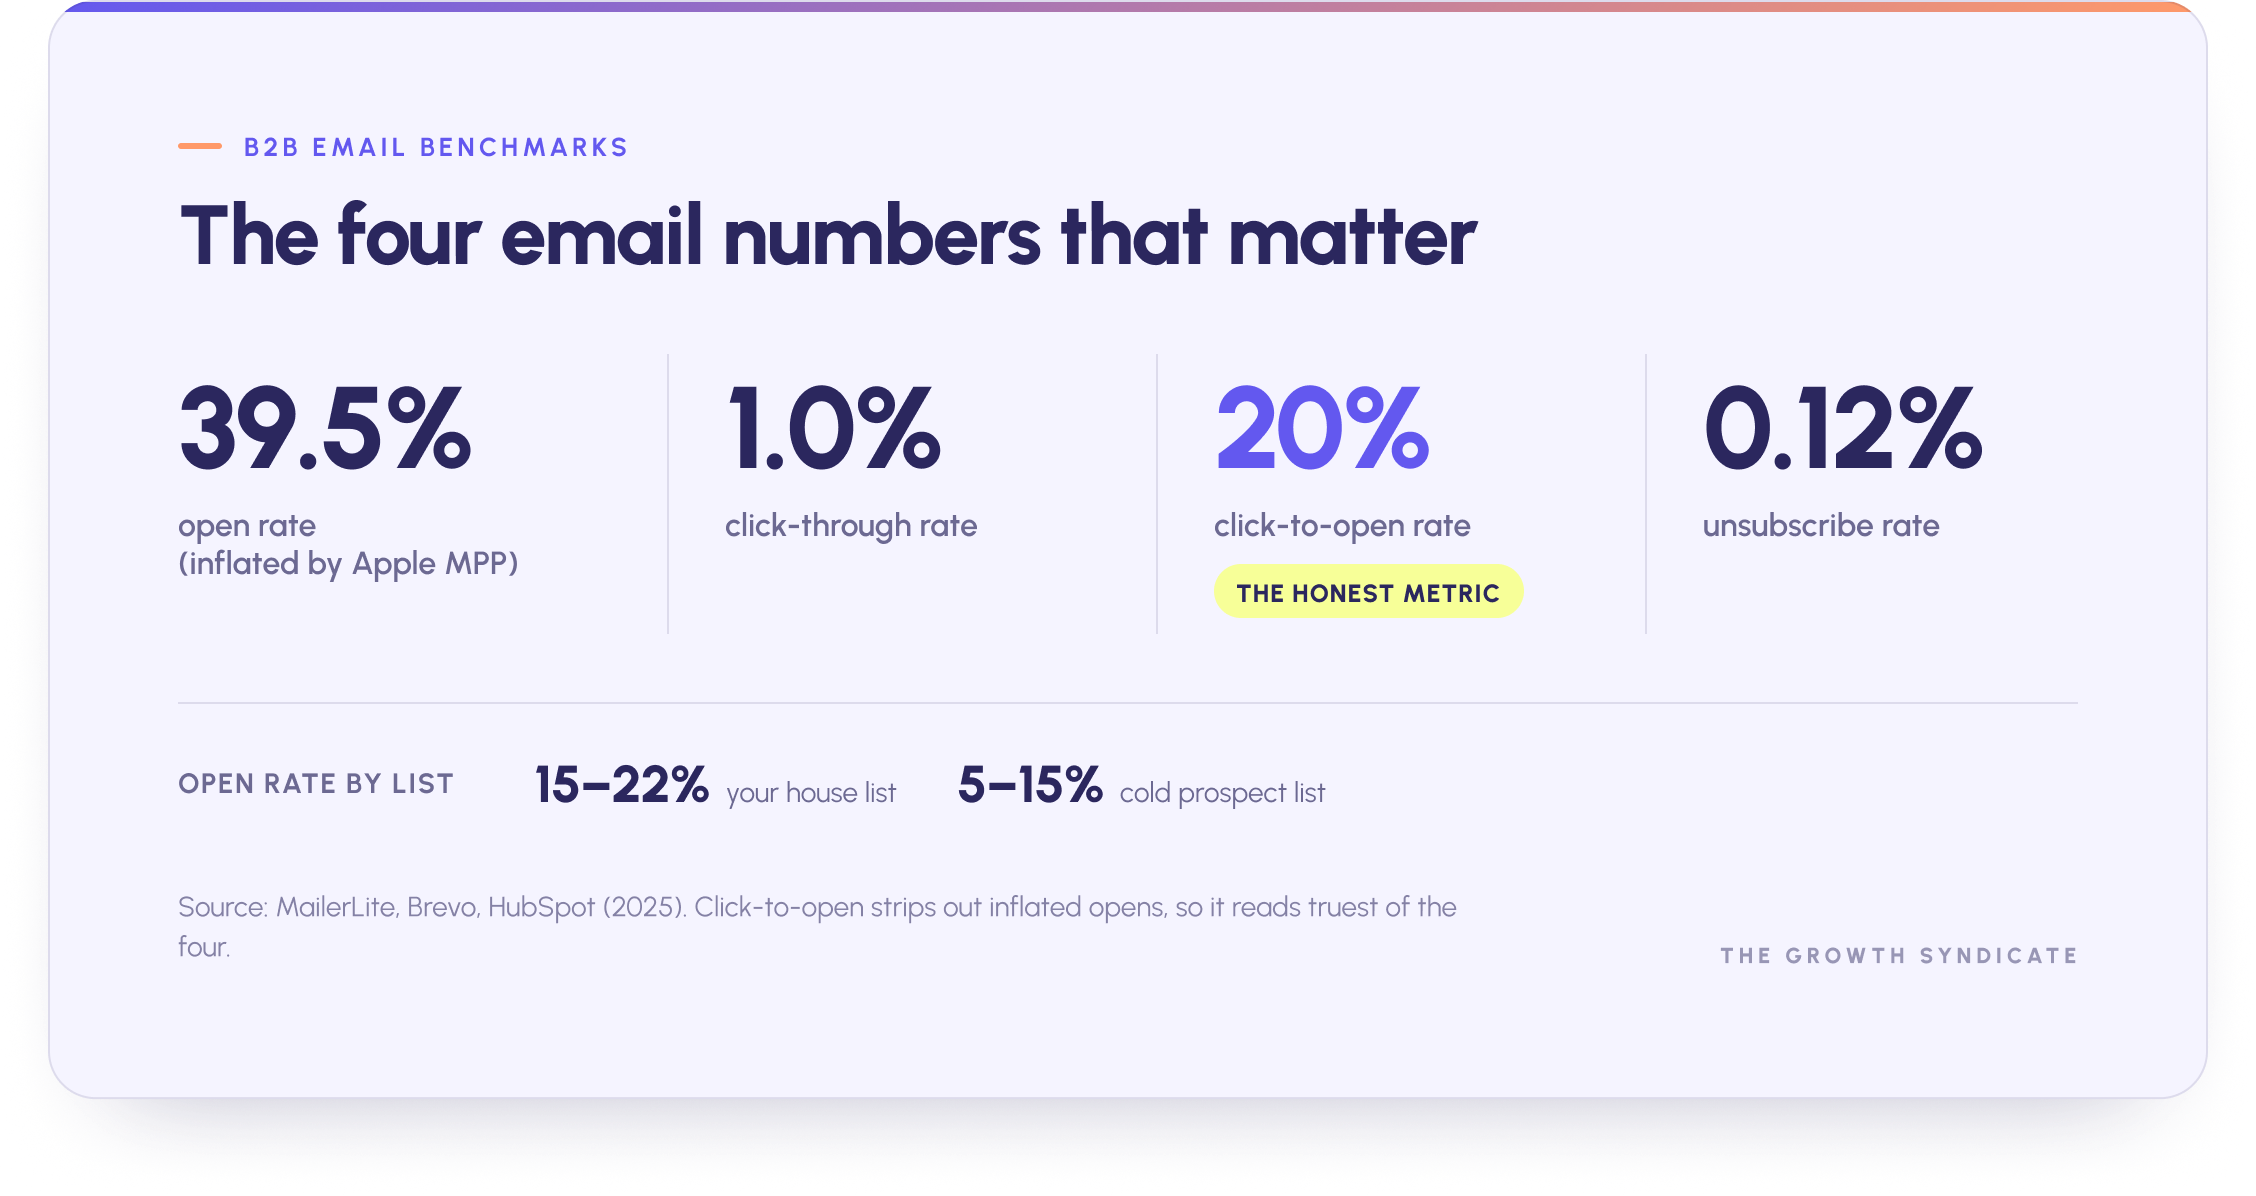
The average email open rate for B2B service emails is 39.5%. Aggregate all-industry figures often run higher, around 43%, largely because Apple Mail Privacy Protection pre-loads images and registers opens that never happened. That inflation is why sophisticated B2B marketers treat open rate as a soft signal and lean on click-to-open and conversion instead.
List type changes the picture sharply. House-list email campaigns sent to your own audience average a 15% to 22% open rate when measured cleanly, while prospect lists of colder contacts open at 5% to 15%. Compelling subject lines move this number more than any other single factor, so subject lines deserve the same testing rigour you give ad copy.
Click-through and click-to-open
The average click-through rate for B2B email campaigns is 1.0%. The click-to-open rate, which measures clicks among people who actually opened, averages around 20% in B2B. Because click-to-open strips out the inflated open figures, it gives a cleaner read on whether your content and offer matched the audience. Strong content relevance shows up here first.

Unsubscribe rates
The average B2B email unsubscribe rate is 0.12%. Healthy unsubscribe rates stay below 0.5%, so a figure near 0.12% indicates a well-targeted list. A sudden rise in unsubscribe rates usually means a list segment is receiving content that does not fit, which is a content and targeting issue rather than a deliverability one. Watching unsubscribe rates alongside engagement gives an early read on list health before it affects sender reputation.
Organic search and content marketing benchmarks
Organic search produces the lowest acquisition cost and the highest-converting leads in most B2B benchmark studies, which is why it stays central to durable marketing strategies even as the channel changes.
Organic traffic and qualified leads
Organic search converts at roughly 2.6% in B2B according to Ruler Analytics, ahead of most paid channels at the same stage. Leads from organic traffic also tend to be better qualified leads, because they arrive through problem-aware searches rather than interruption. The work of building organic traffic is slow, with competitive keywords typically taking three to six months to rank and six to twelve months to contribute meaningful pipeline, so it rewards patience and consistency.
Content marketing performance
According to the Content Marketing Institute and MarketingProfs annual B2B research, the most effective content formats are video, case studies, and research-led reports, with content marketing widely credited for building awareness and generating demand. Yet only around 22% of B2B marketers rate their content marketing as very or extremely successful, and the most common reason cited for underperformance is a lack of clear goals. Content that ties to a defined performance goal outperforms content published on instinct, which is the difference between producing compelling content and producing content that drives measurable results.
What AI search changes
The newest shift is AI-driven discovery. AI Overviews now appear on a large and growing share of search results, and they compress organic click-through rates for traditional listings. Ahrefs research from early 2026 found meaningful click reductions for top-ranking pages where an AI Overview appears. The upside is that content cited inside these answers earns more clicks per impression, and statistic-rich, well-structured content gets cited more often. For B2B teams, this raises the value of original data and clear sourcing, both of which improve the odds of being the page an AI engine quotes.
Social media and engagement benchmarks
Social engagement is where brand building and demand creation become visible, and LinkedIn is where the professional audience lives.
LinkedIn engagement
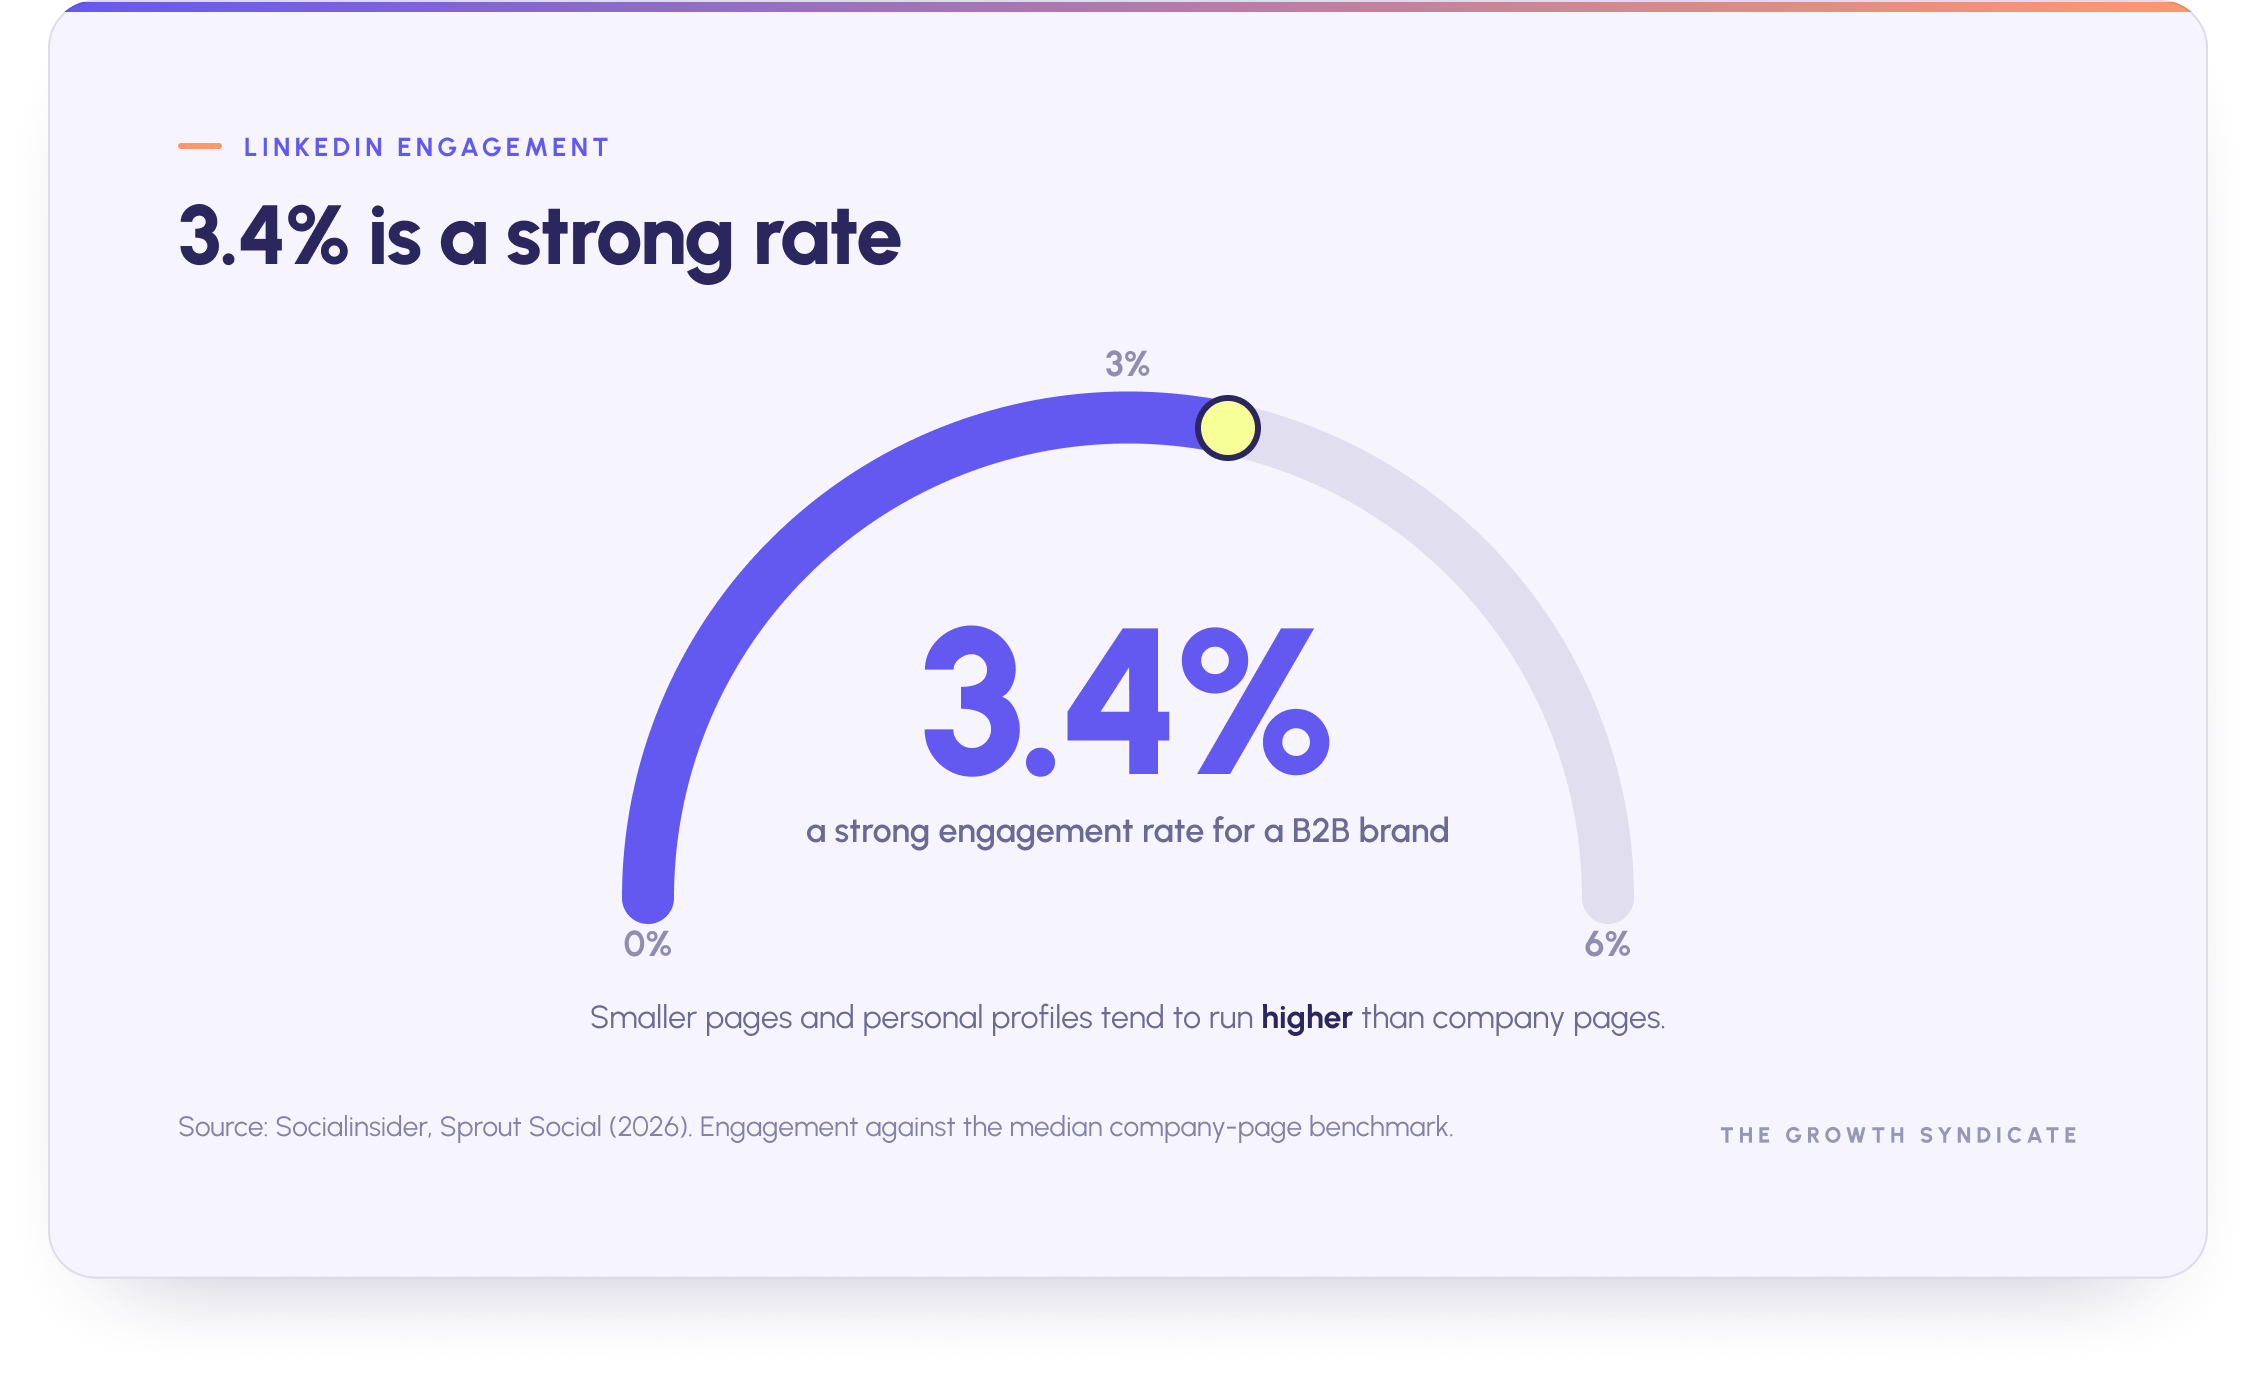
A 3.4% engagement rate on LinkedIn is considered strong for a B2B brand. Engagement metrics indicate relevance and visibility, telling you whether your content is reaching and resonating with the right people. High engagement rates correlate with effective content strategies, so a falling rate is an early signal that messaging has drifted from what the audience cares about. Smaller pages often see higher engagement than large ones, and personal profiles tend to outperform company pages, which is why employee-led posting has become a core tactic.
Engagement is not a vanity metric when read correctly. Tracking engagement metrics helps build long-term demand and trust, and these signals matter for brand building and sales enablement well before a buyer is ready to talk. The 95-5 rule later in this guide explains why that early visibility pays off.
Thought leadership and brand building
Thought leadership content is where engagement and pipeline meet. LinkedIn's own data shows that thought leadership influences buying decisions and that branded discovery carries far more commercial value than generic reach. Consistent thought leadership compounds, building the familiarity that makes a brand the first one a buyer thinks of when a need finally surfaces. This is brand investment with a measurable downstream effect rather than an act of faith.
Sales, pipeline, and deal benchmarks
Marketing metrics only matter if they translate into closed revenue, so the sales benchmarks below complete the picture.
Sales cycle length
B2B sales cycles have lengthened. Ebsta data put the average cycle at roughly 6.5 months in recent years, up from under 5 months in 2019, with larger deals running well past that. Longer cycles are a structural condition of the current market rather than a temporary blip, and they change how you read every earlier-stage benchmark. A lead that goes quiet for two months has not necessarily gone cold.
Win rates and deal size
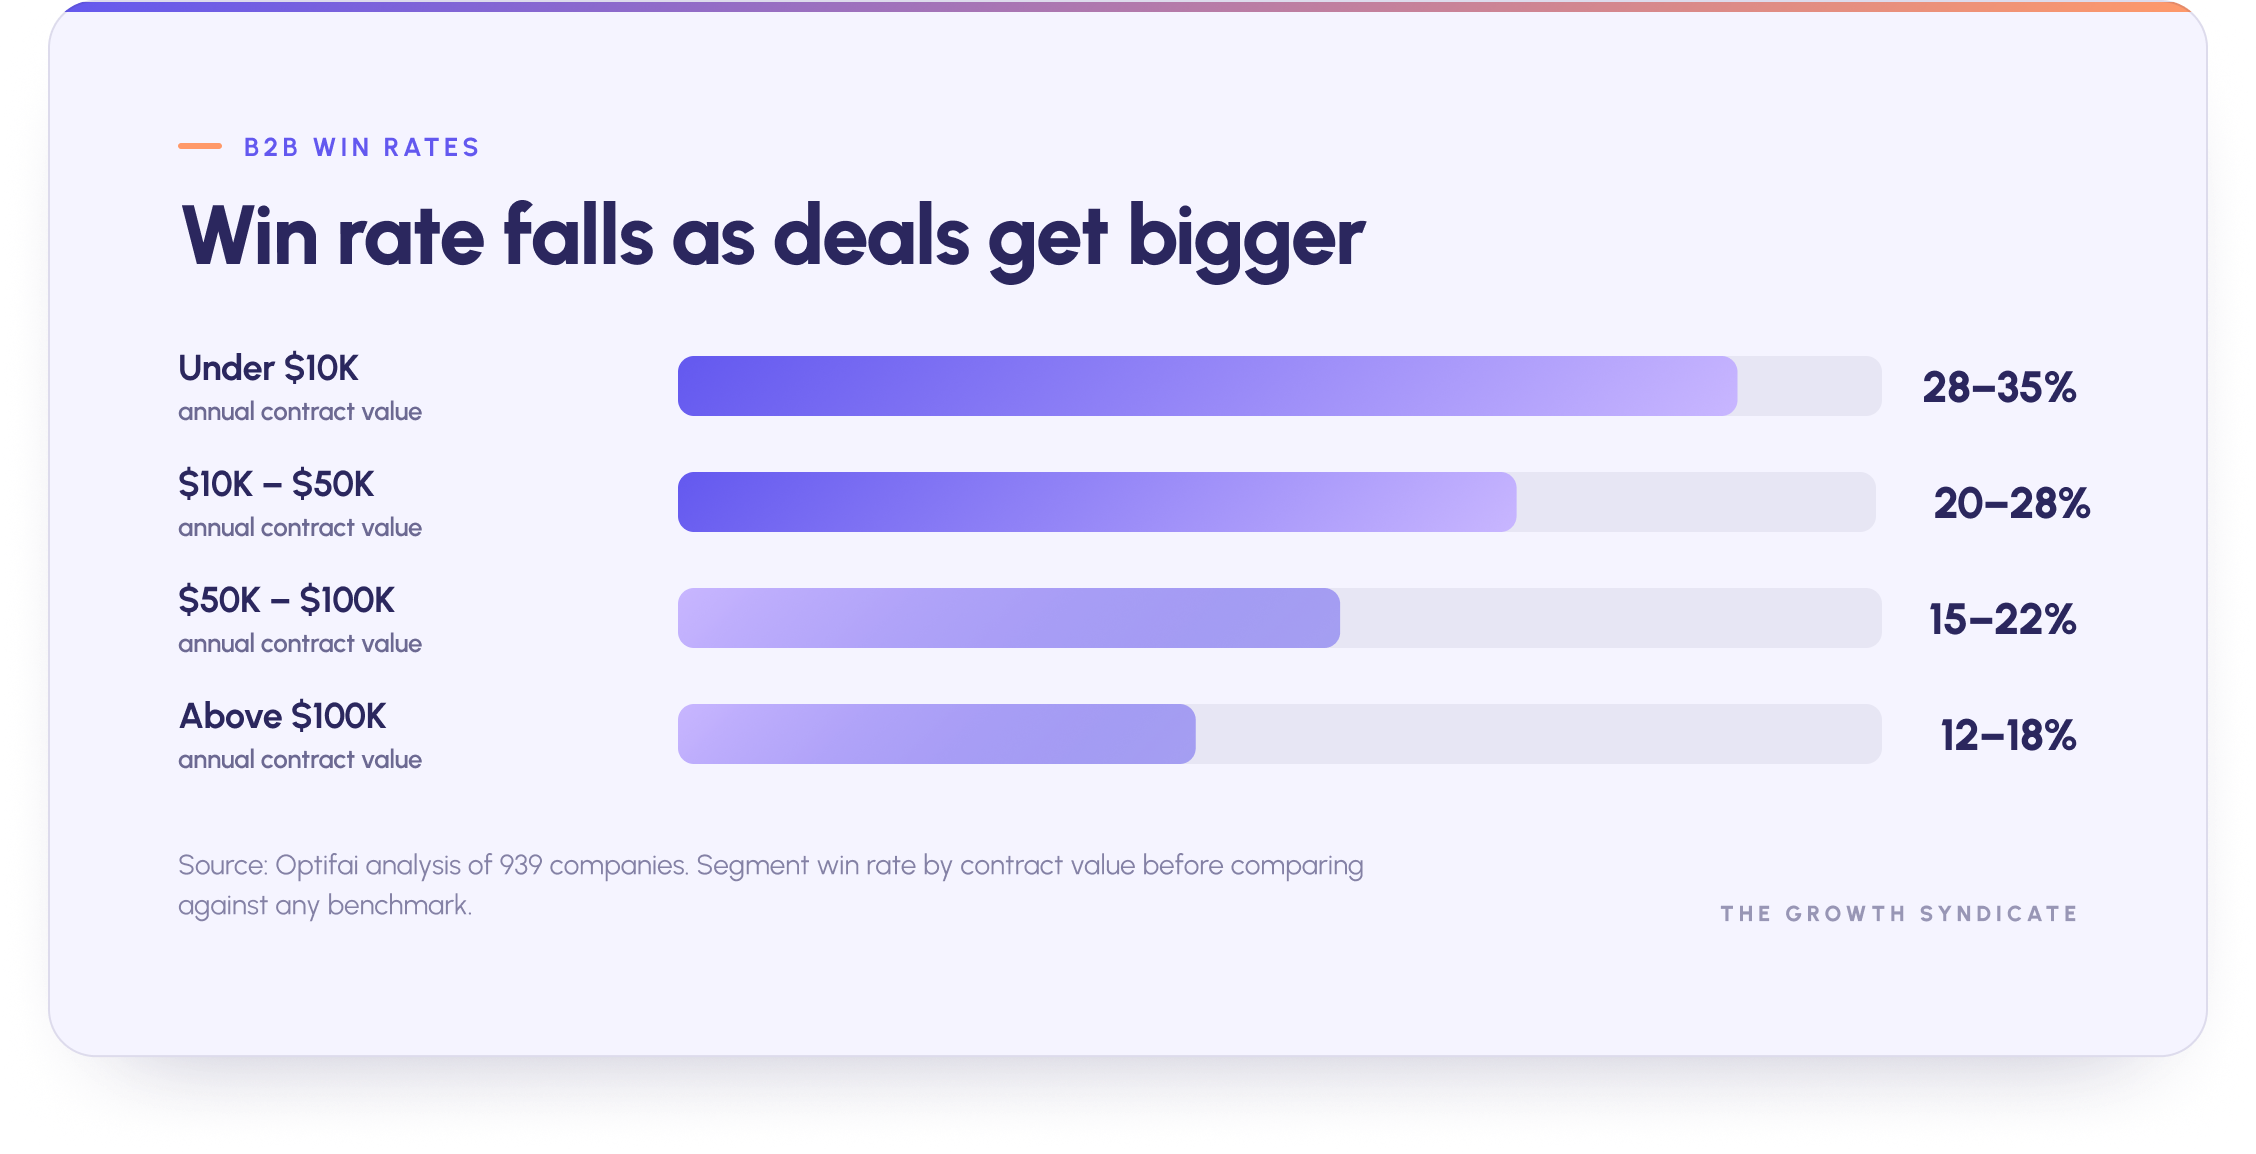
Win rates fall as deal size rises. Analysis from Optifai across hundreds of companies shows smaller deals under $10,000 in annual value closing at 28% to 35%, while deals above $100,000 close at 12% to 18%. That gradient is normal, because larger purchases involve more scrutiny and more people. Reading win rate without accounting for deal size produces misleading conclusions, which is why segmenting by contract value is essential before comparing against any benchmark.

Decision makers and closing deals
The B2B buying committee has grown. Gartner research consistently finds 6 to 10 decision makers involved in a typical purchase, rising higher in enterprise deals, and most buying groups now include four or more people with a say. Buyers also spend only a small fraction of their total time with any single vendor, which means closing deals depends on equipping an internal champion to sell on your behalf when you are not in the room. Multi-threading, or engaging several contacts inside an account, correlates with materially higher close rates.
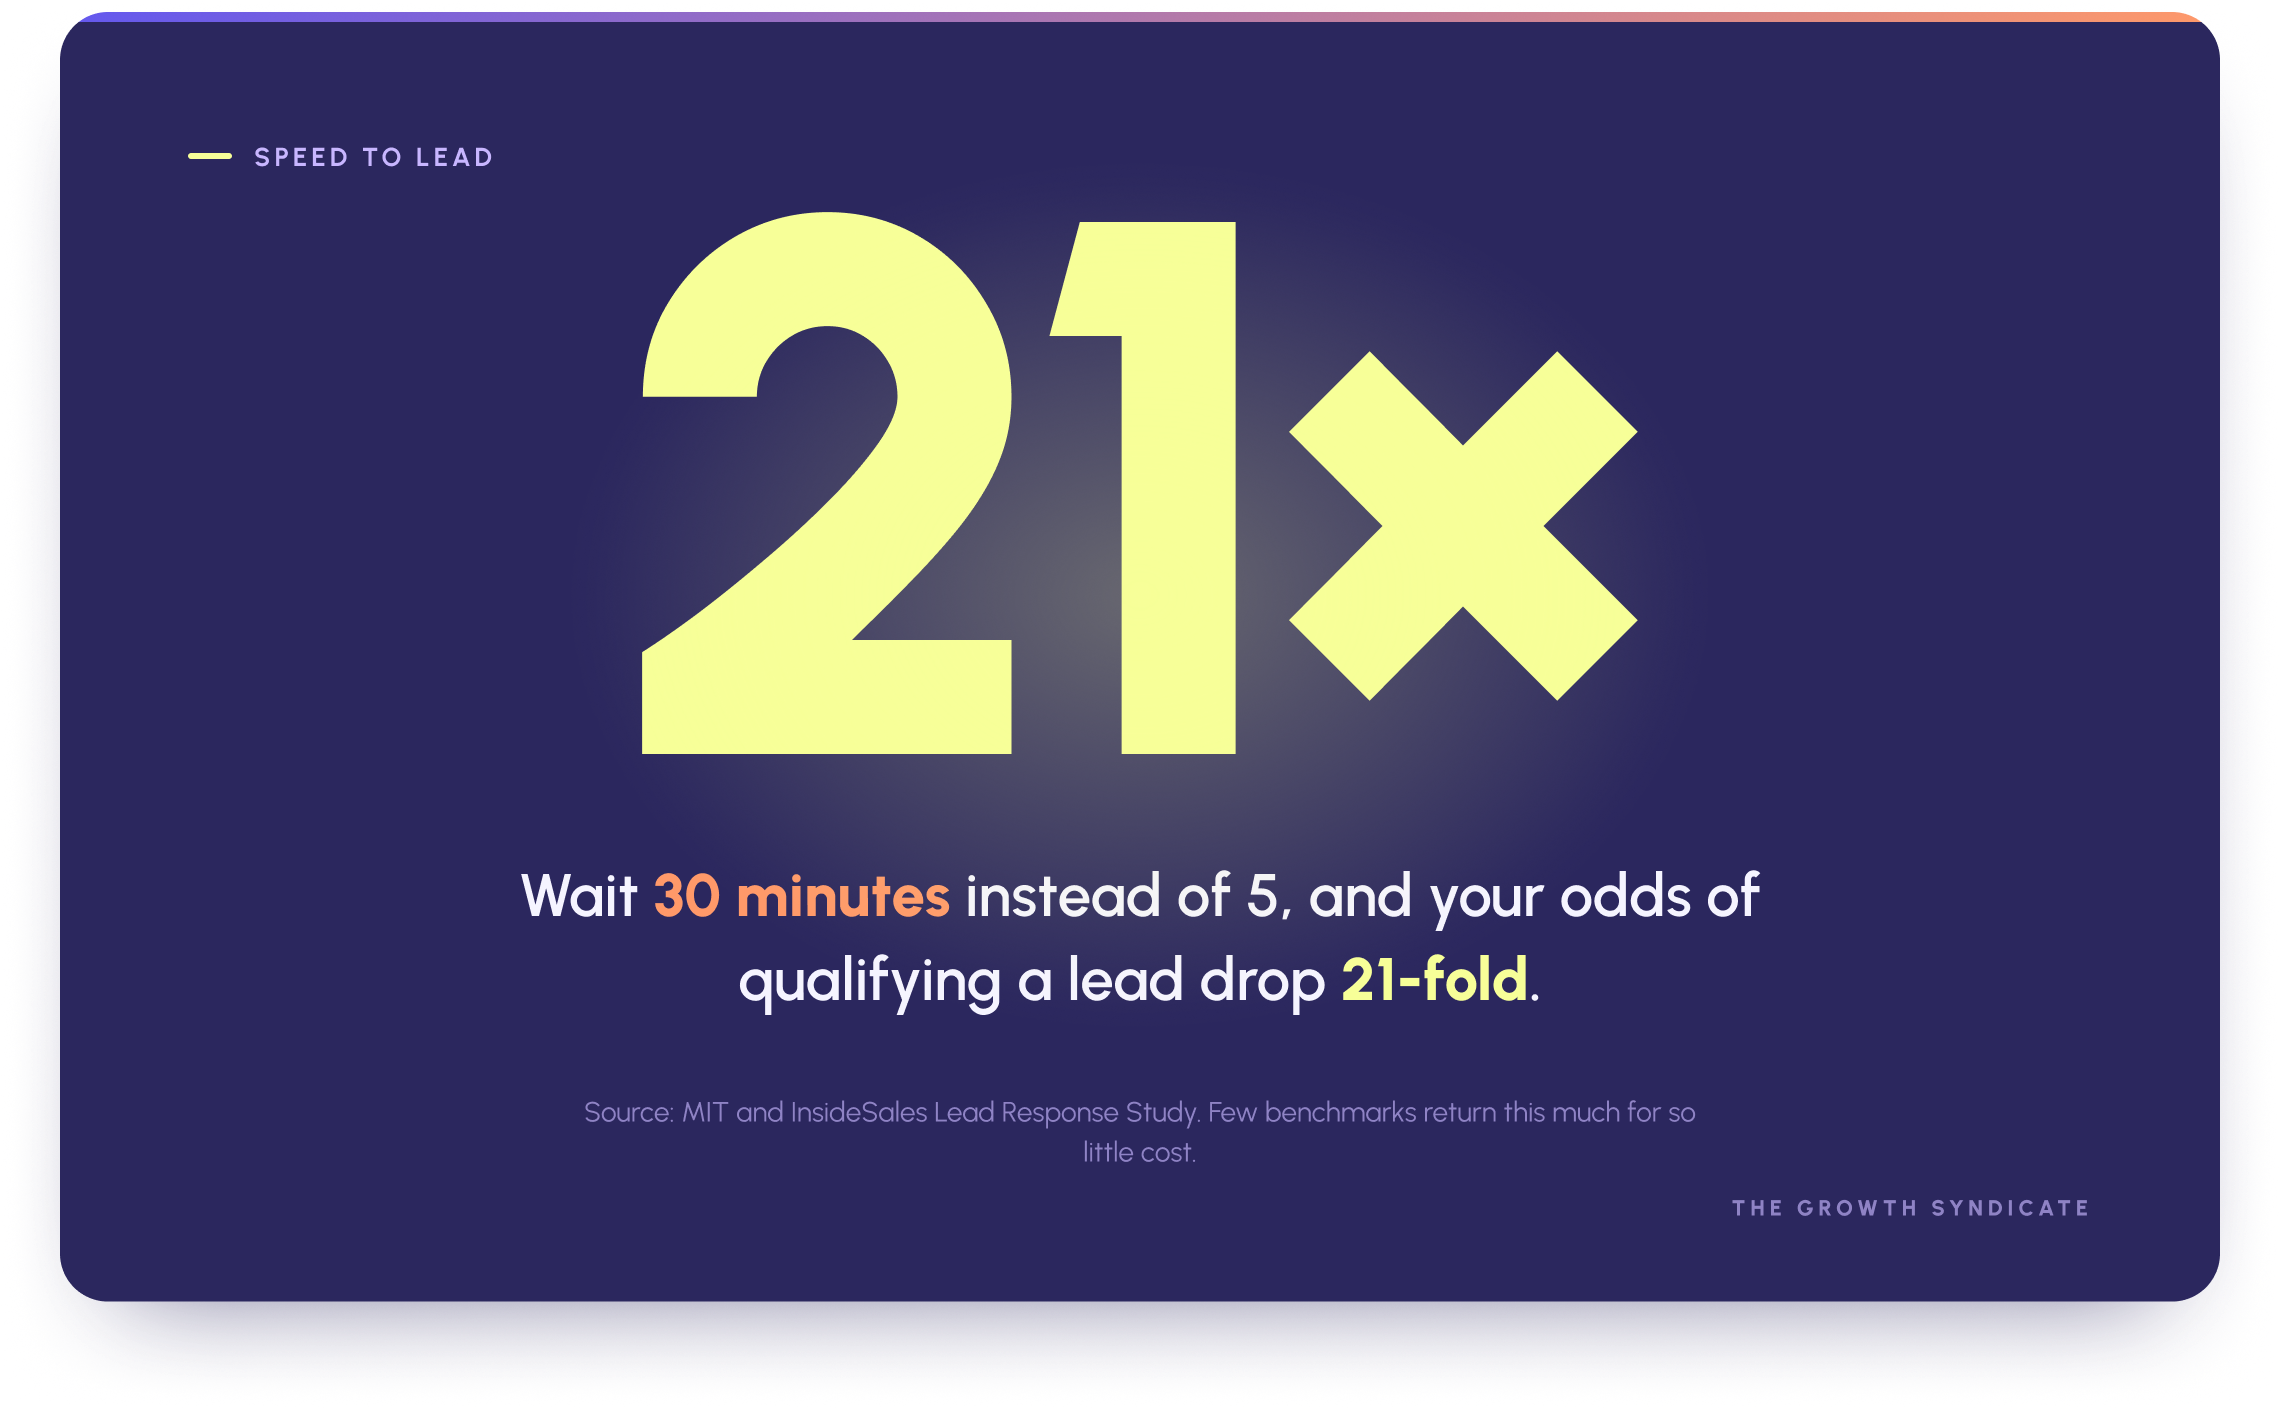
Lead response time
Speed still wins. The landmark MIT and InsideSales lead response study found that the odds of qualifying a lead drop by 21 times when a company waits 30 minutes to respond rather than 5. Few benchmarks offer that kind of return for so little cost, which makes response time one of the most reliable performance metrics a revenue team can fix quickly.
Unit economics: CAC, CLV, and the ratios that matter
Unit economics decide whether growth is healthy or hollow, and a handful of industry benchmarks tell you which one you have.
Customer acquisition cost
The average cost per lead for B2B SaaS is $237, and First Page Sage data places B2B SaaS customer acquisition cost at a similar level around $239, with organic channels costing materially less than paid ones. Acquisition cost varies enormously by vertical. Education and financial services run far higher, while ecommerce runs far lower, so a SaaS figure tells a manufacturing business very little. The pattern that holds across industries is that organic acquisition undercuts paid acquisition, which is why the channel mix has such a strong effect on blended cost.
CLV to CAC
Typical B2B customer acquisition cost is judged against customer lifetime value, and the relationship between the two is the number investors and boards watch most. The widely cited healthy CLV to CAC ratio is 3:1, with 4:1 often treated as the ideal target. A ratio below 3:1 usually means a company is spending too much to acquire customers relative to their value, while a very high ratio can signal underinvestment in growth. The common error is calculating lifetime value on revenue rather than gross margin, which inflates the ratio and hides a weaker reality.
Payback period
CAC payback, the time it takes to earn back acquisition cost, is the third number in this group. A payback period under 12 months is considered healthy for B2B SaaS, and faster paybacks free up cash to reinvest in growth. Median paybacks lengthened through 2024 and 2025 as acquisition got more expensive, which is part of why retention moved up the priority list for so many teams.
Marketing budget benchmarks
Budget benchmarks tell you whether your investment is in line with peers and how the best teams allocate it.
Spend as a share of revenue
B2B firms typically invest 5% to 10% of total company revenue into marketing. Gartner's most recent CMO spend research puts the average closer to 7.7%, having flattened after several years of decline, with many CMOs reporting that their budget is insufficient to execute their strategy. Company size and growth stage move this figure, with earlier-stage companies often spending a higher share to buy growth and established companies spending less as a proportion of larger revenue.
How to allocate budget
Within the budget, the durable pattern is a split between demand generation that captures buyers ready now and brand building that creates demand for later. Gartner's data shows paid media holding the largest share of marketing budgets and growing, while spend on agencies, technology, and labour has come under pressure.
The teams that allocate budget well treat the brand portion as an investment in future pipeline rather than a discretionary extra, which the next section explains in evidence terms.
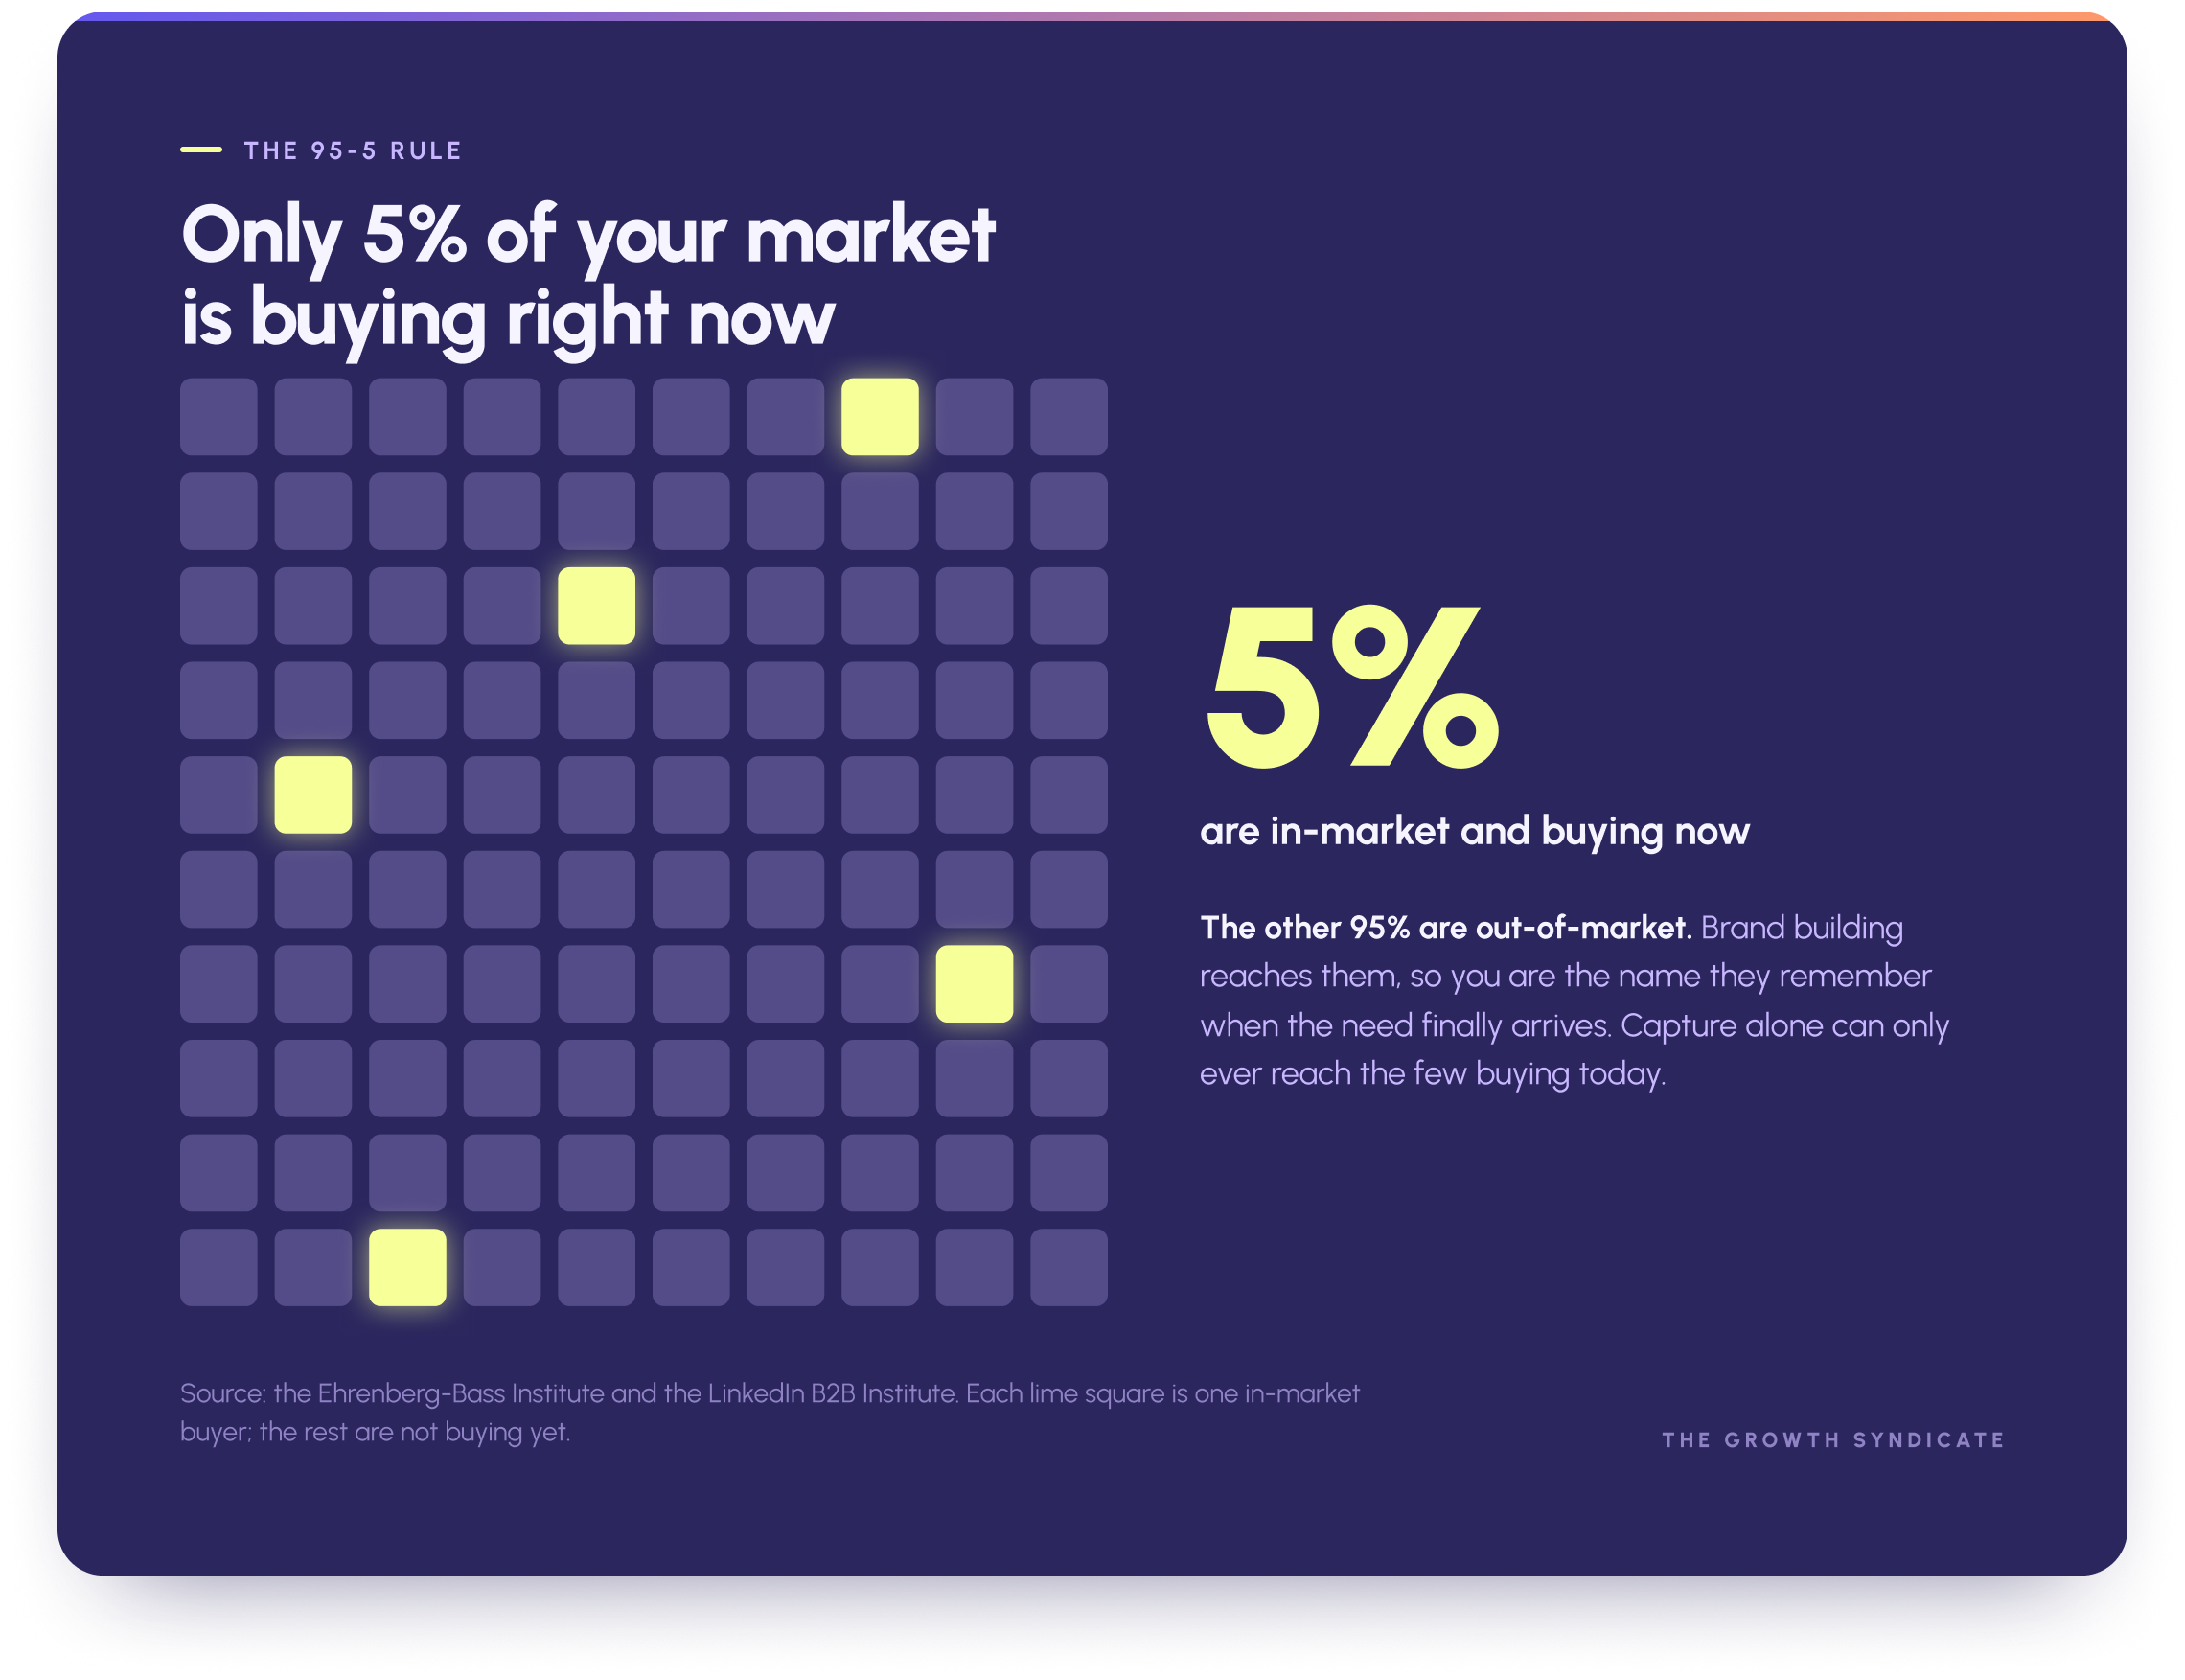
The 95-5 rule: why brand investment shows up everywhere
One finding from the Ehrenberg-Bass Institute and the LinkedIn B2B Institute reframes how to read every benchmark in this guide. B2B strategies should recognize that only about 5% of the target market is actively buying at any given time. The other 95% are out of market, with no live need and no intention to switch.

"The demand is already there, and you reach for it. Your job is to be top of mind for the moment they realise they have a problem, so they already know you're one of the solutions. I think companies like to believe they create more demand than they actually do."
That single fact explains a great deal. It explains why brand building matters as much as lead generation, because the buyers you reach today mostly cannot act today. It explains why engagement and thought leadership pay off slowly, since their job is to plant familiarity that surfaces months later when a need appears. And it explains why pouring budget only into capturing the in-market 5% leaves most of the future pipeline untouched.
The practical implication for marketing strategies is balance. Capturing existing demand drives this quarter's results, while building mental availability among the 95% drives next year's. Brands that invest in both compound their advantage, which is the mechanism behind sustained business growth rather than a single good quarter. The benchmark to internalize here is the 5% itself, because it sets a ceiling on how much your demand capture can ever achieve on its own.
Turning benchmarks into decisions
Benchmarks earn their keep at the moment you act on them. The point of collecting all this marketing data is to change what you do next, and that happens in three ways.
Set realistic goals
Benchmarks let you set realistic goals grounded in evidence rather than ambition alone. If the B2B average website conversion rate is 2.9% and you sit at 1.8%, a target of 2.5% is a credible next step, while a target of 6% is a fantasy that will demoralize the team. Past performance plus industry averages together produce realistic goals that people can actually hit, which is what separates planning from wishful thinking.
Identify gaps and areas to improve
Comparing your funnel against industry standards is the fastest way to identify gaps. When you map your own conversion rates beside the benchmarks above, the weakest stage relative to its benchmark reveals itself, and that is where attention belongs. The same comparison helps you identify areas of overperformance worth protecting and identify areas of underperformance worth fixing, which keeps effort focused on the stages that move revenue.
Prove ROI and inform strategic decisions
Finally, benchmarks help you prove ROI and make better strategic decisions. Showing that your customer acquisition cost beats the industry average, or that your engagement rate clears the strong threshold, gives marketing the credibility to defend and grow its budget. Turning data into a clear comparison is what lets a marketing team move from describing activity to demonstrating commercial value. Done consistently, that practice produces measurable results and the informed decisions that compound into business growth over time.
.avif)
Benchmarks will never tell you exactly what to do, because your market, your deal size, and your buyers are specific in ways no industry average can capture. What they do is give you a fair reference point, a way to judge whether a result is strong or weak, and the evidence to make the case for change. Compare like with like, watch your own trajectory over time, and treat every benchmark as a question worth asking rather than an answer to accept on faith.
Sources referenced: Gartner CMO Spend Survey and B2B buying research, First Page Sage, Ruler Analytics, HubSpot, Content Marketing Institute and MarketingProfs, the Ehrenberg-Bass Institute and LinkedIn B2B Institute, WordStream and LocaliQ, Closely, Dreamdata, Socialinsider, Ebsta and Pavilion, Optifai, ChartMogul, and the MIT and InsideSales lead response study.
.png)
