

LinkedIn ads cost US-targeted B2B campaigns a median of $21.68 per landing-page click, $91.30 per thousand single-image impressions and $292 per lead in the 12 months to September 2026, according to the single-country US campaigns in Kiin Labs' panel of 1,071 advertiser accounts. The $2 to $6 per click quoted elsewhere is usually an estimate, older data or a count of different clicks. This page puts the main published LinkedIn benchmarks on the same footing, then follows the cost past the lead to pipeline.
Last verified: October 2026
Key takeaways
- In one panel of 1,000+ accounts, the median LinkedIn CPC is $4.19 counting every chargeable click and $17.54 counting landing-page clicks only. Most of the disagreement between published CPCs comes from that choice.
- US campaigns cost about 1.8x UK campaigns per impression and per lead, and 1.7x per landing-page click (Kiin Labs, 2025-26).
- LinkedIn Lead Gen Forms cost $193 per lead against $346 for landing pages in Metadata's 2025 data, and sourced 9.3x pipeline per dollar against 5.3x.
- Each dollar of LinkedIn lead-gen spend sourced $10.20 of pipeline across Metadata's 94 advertisers with pipeline data, at a 19.5% close rate and $58,572 of lead-gen spend per customer.
- CTR showed no detectable relationship with pipeline in the only dataset cited here that tested it (ZenABM, about 33 companies), while spend tracked the amount of pipeline.
This page takes the LinkedIn section of our B2B marketing benchmarks much further. It draws on six LinkedIn benchmark datasets, most with disclosed samples, LinkedIn's own documentation (labeled as platform claims), and the results The Growth Syndicate (TGS), a B2B marketing agency, has published from LinkedIn programs it runs for clients. Kiin Labs, the panel this page draws on most, is published by a LinkedIn Ads agency, and TGS sells LinkedIn services too, so read both with that in mind.
How much do LinkedIn ads cost in 2026?
LinkedIn ads cost B2B advertisers a median of $17.54 per landing-page click and $36.23 per thousand impressions outside lead-gen campaigns, and $164 per content lead or $343 per demo request on Lead Gen Forms, in Kiin Labs' 2025-26 panel. US campaigns pay $21.68 per landing-page click and $292 per lead. Each dollar of LinkedIn lead-gen spend sourced $10.20 of pipeline in Metadata's 2025 data.
The LinkedIn advertising costs below come from datasets that disclose their sample and method. Each one states which clicks it counts and how it averages accounts, because those two choices move LinkedIn benchmarks more than anything else.
On Kiin Labs' benchmarks page, which excludes lead-gen campaigns from its whole-panel figures, the median account paid $4.19 per click when every chargeable click counts, and $17.54 when only clicks to the advertiser's website count. Metadata's 2025 data puts the spend-weighted cost per LinkedIn lead at $202, while its median advertiser paid $376. The grades are explained in the method section at the end of this page.
What is the average CPC and CPM on LinkedIn?
LinkedIn's average CPC runs from about $4 to $22, and most of that spread is definition. Kiin Labs' 2025-26 panel of 1,000+ accounts puts the median outside lead-gen campaigns at $4.19 counting every chargeable click and $17.54 counting landing-page clicks only. Median LinkedIn CPM is $36.23 across feed formats and markets outside lead-gen campaigns, and $91.30 for US single-image campaigns.
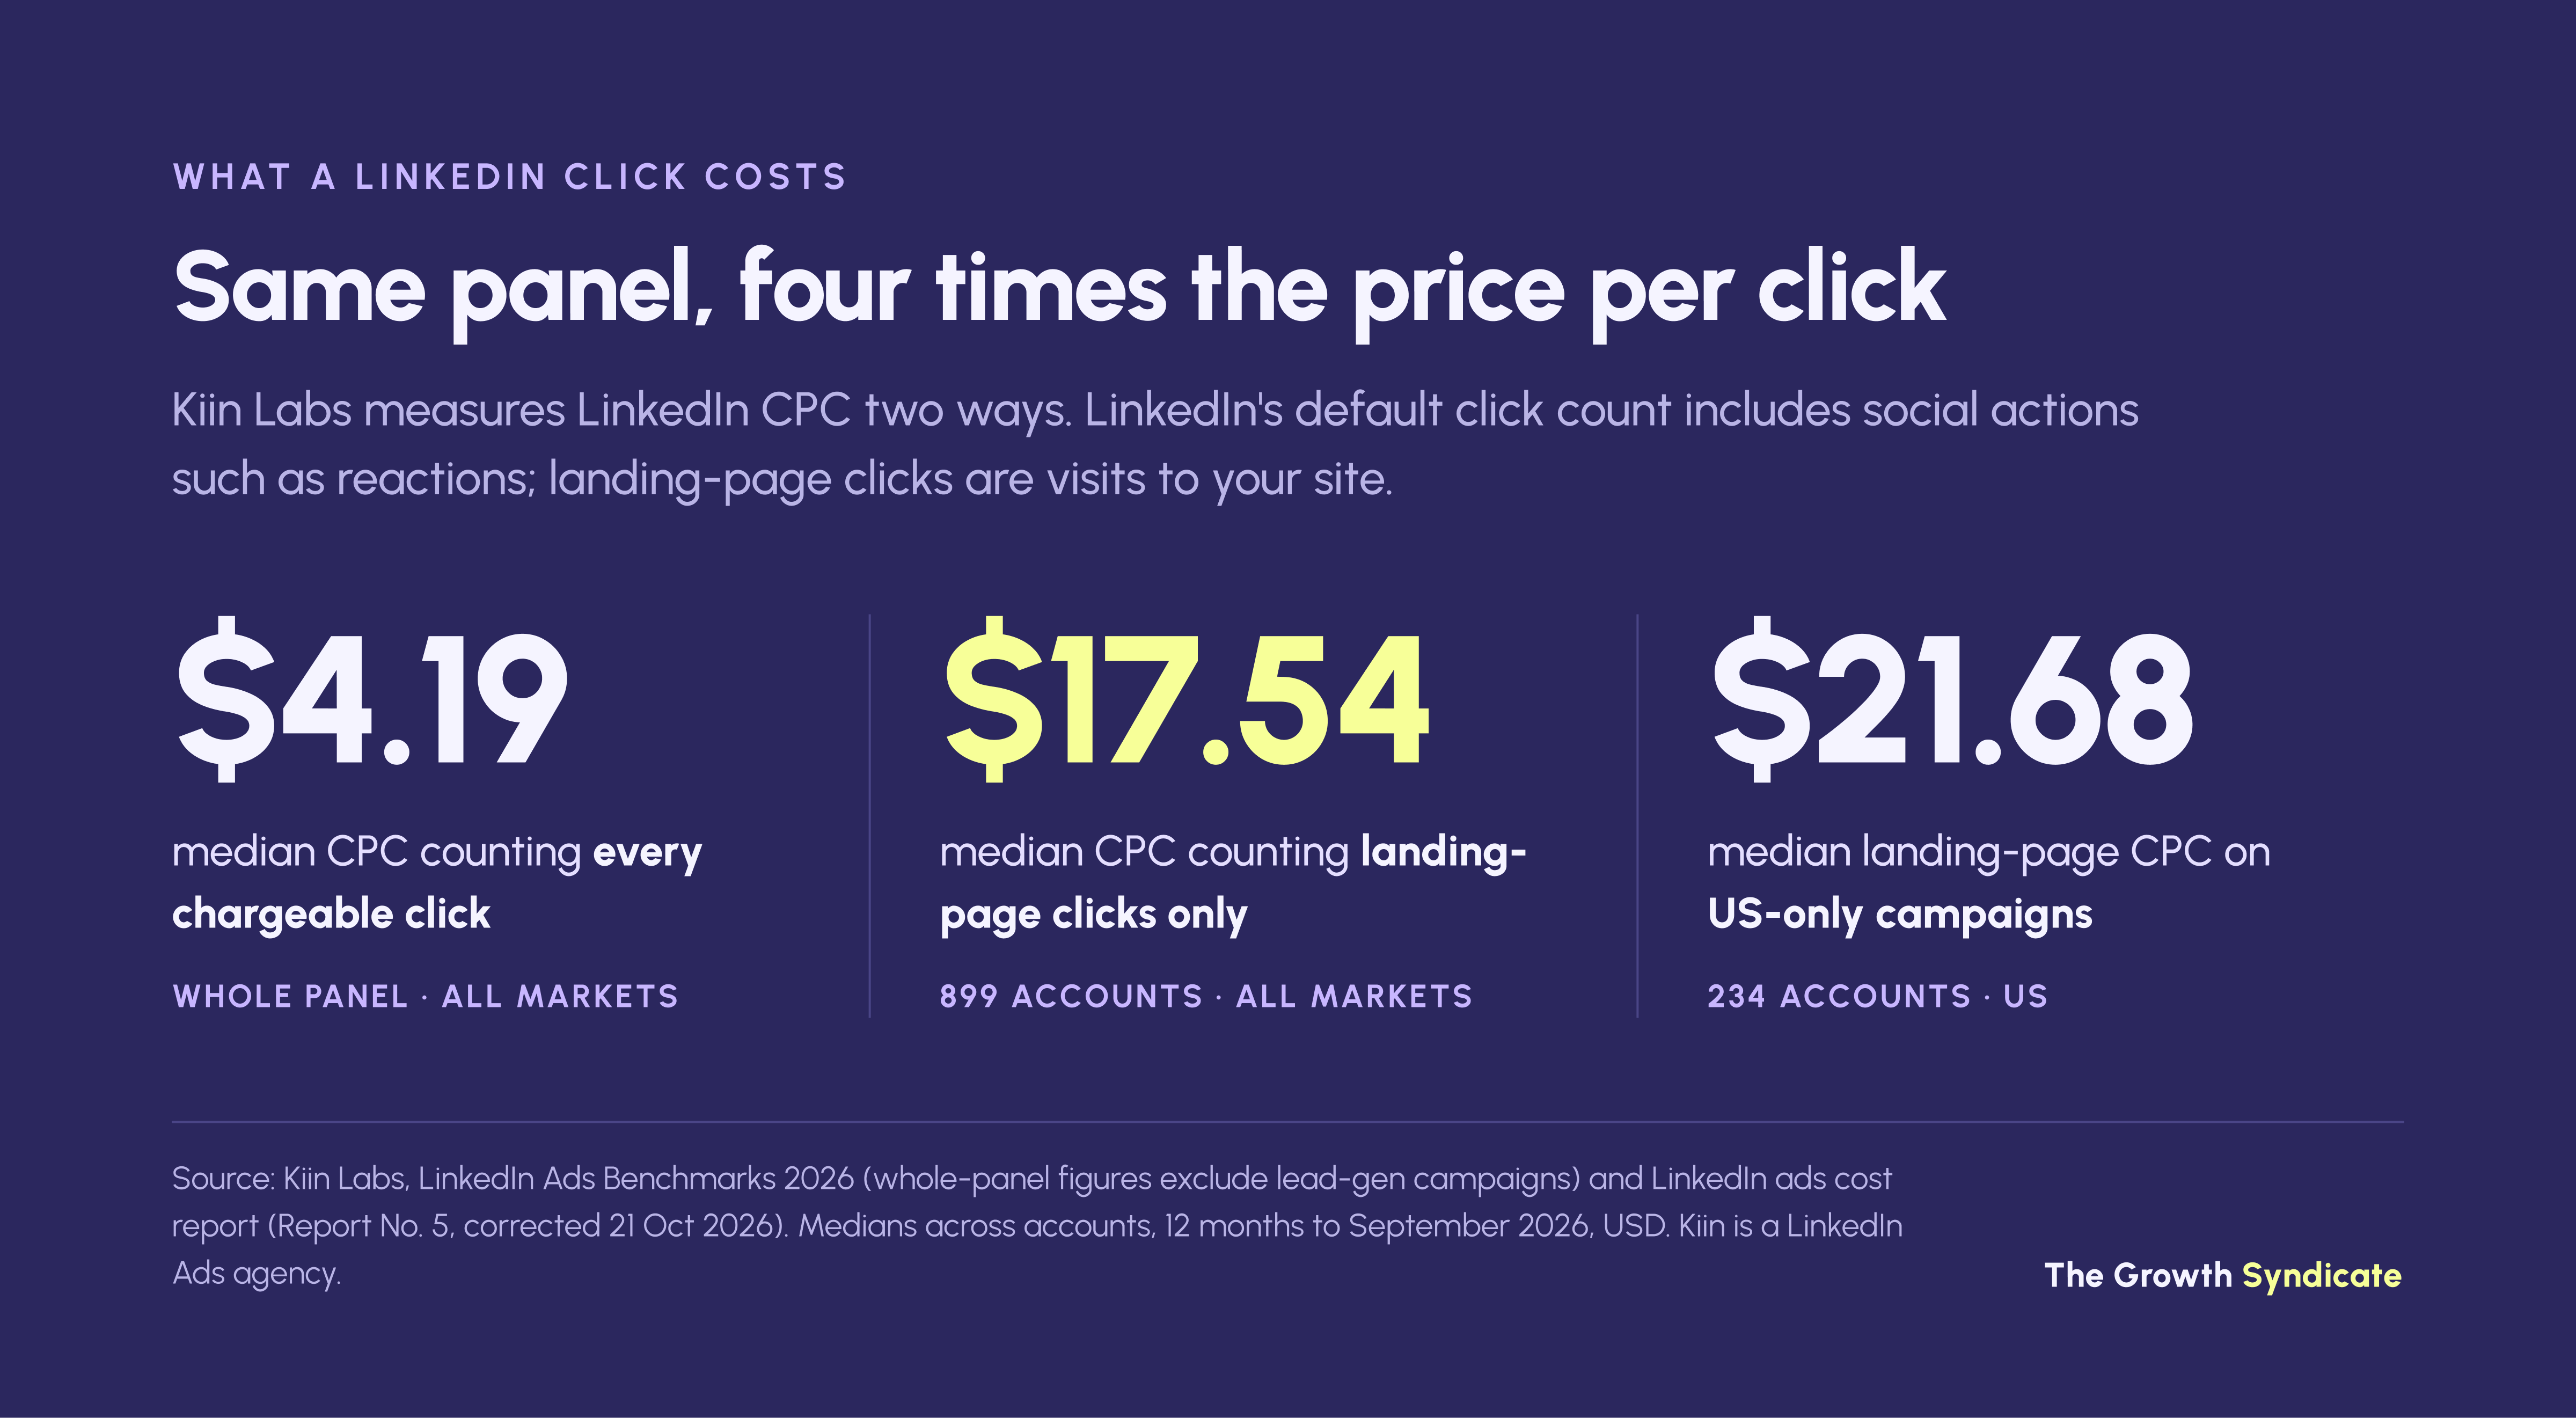
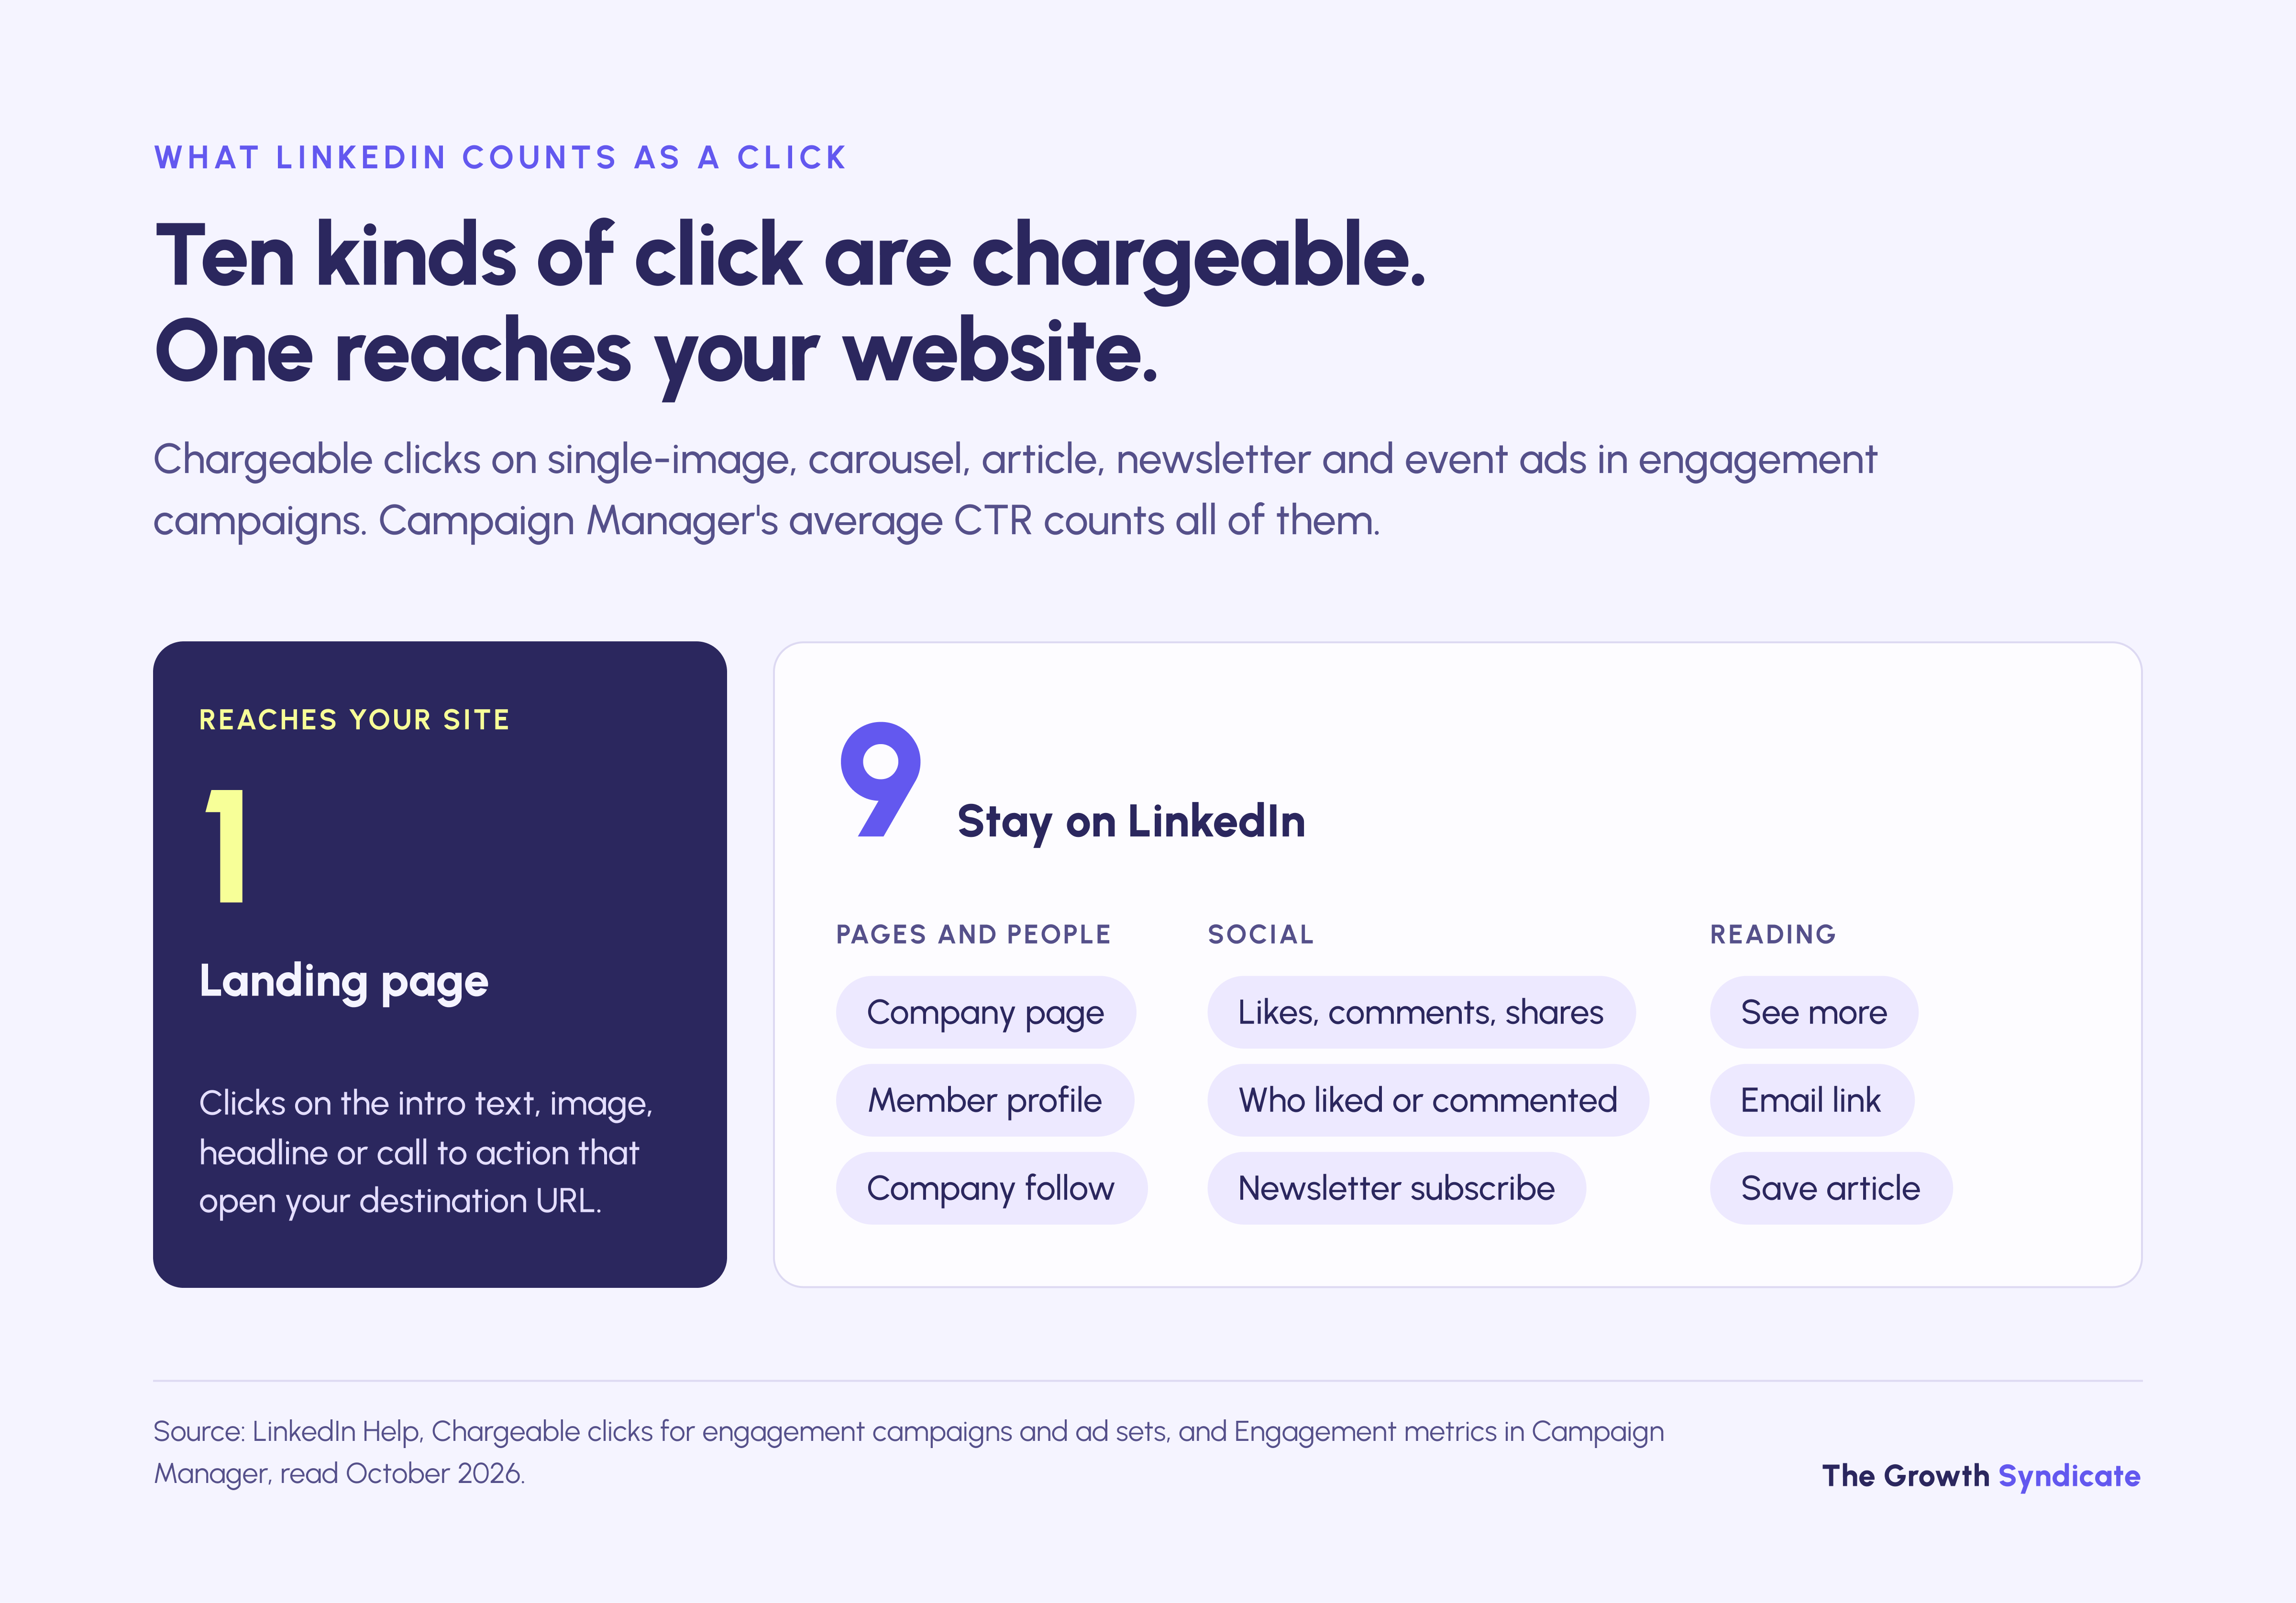
The gap is built into how LinkedIn reports. Campaign Manager's average CTR is chargeable clicks divided by impressions, and on engagement campaigns those chargeable clicks include "see more" expansions, reactions, comments and company-page visits. Clicks to your landing page are a separate column, so a CPC built on all clicks will look cheaper than one built on website visits.
Why published LinkedIn CPCs disagree
Published LinkedIn CPCs disagree because they differ on four things: which clicks they count, how they average accounts, which countries the campaigns target, and how old the data is. Lined up on those four, the familiar figures stop contradicting each other. Few of them are wrong; most measure something narrower than the headline suggests.
Weighting matters as much as clicks. Metadata's LinkedIn cost page calls these figures a spend-weighted aggregate, and its methodology says channel figures are spend-weighted, meaning the largest accounts count most, while its CTR article describes the same LinkedIn row as medians. Treat the $9.39 as Metadata's 2025 LinkedIn benchmark: it covers every campaign goal, and no geography is stated.
Geography is the third variable. The B2B House notes that a CPM near $8.50 is only reachable when a campaign targets the whole world, while Kiin Labs measured a $91.30 median for US single-image campaigns. The $5.26 figure is real, but it is AdStage's Q1 2018 median, and most of the pages repeating it have dropped both the source and the year.
Are LinkedIn ad costs rising?
LinkedIn ad costs rose in the year to July 2025, in the only current dataset cited here that reports a year-over-year change. PPC Land's summary of Dreamdata's 2026 benchmark shows CPC up from €5.35 to €5.98 (about 12%) and CPM up from €26.62 to €34.33 (about 29%), in euros and on Dreamdata's own definitions.
CPCs move for reasons that have little to do with your ads. Competitors entering an auction can shift a CPC overnight, and audiences saturate as the same people see the same creative for months. In the accounts we run, creative refresh and audience rotation are a standing task rather than a fix applied when costs spike.
PPC Land's summary of the Dreamdata report carries both year-over-year comparisons and gives the data window as August 2024 to July 2025, and Dreamdata's own announcement confirms the €5.98 CPC. HockeyStack's 2025 report shows CPC climbing from $10.48 in the first quarter to $15.72 in the third, but it doesn't tie those quarters to a single year, so we don't use it as a trend.
What is the minimum budget for LinkedIn ads?
LinkedIn's minimum budget is $10 a day per campaign, with a $100 lifetime minimum for new campaigns, and LinkedIn suggests a default of $25 for new advertisers and $50-100 for existing ones in US dollars. Audiences need at least 300 members, with 50,000 or more recommended for single-image and text ads. No official minimum bid is published.
The budget figures come from LinkedIn's budget guidance page, and the audience minimums from its audience page. Once a campaign is live, the lifetime minimum becomes $10 multiplied by the number of scheduled days. Other currencies get "the equivalent of $25" as the suggested default rather than their own published minimums.
What you're billed for depends on the objective, the bid strategy and the ad format. On engagement campaigns, maximum delivery and cost-cap bidding charge per impression, while manual bidding charges per engagement click (LinkedIn Help). Conversation ads are billed per send, so on engagement campaigns they have no chargeable clicks.
What is a good CTR for LinkedIn ads?
A good LinkedIn CTR is 0.38% or better to your landing page, the level of the top-quartile account in Kiin Labs' 2025-26 panel outside lead-gen campaigns, where the median account reaches 0.23%. Counting every chargeable click, the median is 0.96%, and Metadata's 2025 LinkedIn benchmark across all campaign goals is 0.67%. Compare two CTRs only when both count the same clicks.
LinkedIn's help documentation lists ten chargeable click types for single-image, carousel, article, newsletter and event ads on the engagement objective. They include clicks to the landing page, clicks that open the company page, the "see more" expansion of intro text, reactions, comments and follows. A long text post that makes people expand it earns clicks a short ad can't, without sending anyone to your site.
That is why a CTR reported on its own says little about whether a campaign works. In ZenABM's 2026 analysis, CTR showed a slightly negative and statistically insignificant relationship with pipeline (ρ = −0.17, p = 0.34), measured on about 33 companies with complete data. Spend tracked the amount of pipeline more closely, though not pipeline per dollar.

Which LinkedIn ad format performs best?
No LinkedIn format wins on every cost. Outside lead-gen campaigns, video has the lowest median CPM of the feed formats in Kiin Labs' benchmarks ($40.93), but the same advertisers paid 18% to 53% more per landing-page click for video than for single image on website-visit, conversion and engagement campaigns. Document ads turned the most cold-audience clicks into leads in Metadata's 2025 data, at 10.6%.
Kiin Labs' video report drew on 676 video advertisers and, where the same advertiser ran company video and single-image ads on the same objective, compared the two (43 to 133 advertisers per objective). Video cost 18% more per landing-page click on website-visit campaigns, 35% more on conversion campaigns, 53% more on engagement and 364% more on brand awareness, and 62% more per lead on lead-gen campaigns, where only 28 advertisers could be paired. Cross-account medians can say the opposite, because they compare different advertisers; the paired figures hold the advertiser constant.
Metadata's 2025 cold-audience data, from its LinkedIn CTR analysis, shows document ads converting 10.6% of clicks to leads at $148 per lead, against 4.7% and $177 for single image, 2.5% and $358 for video, and 1.5% and $617 for carousel. Across all its 2025 lead-gen campaigns, spend-weighted, Metadata's cost page puts the document figure at 11.9%. In our Frends program, single-image ads didn't work as cold entry points and performed only in retargeting and around events, while thought leadership posts that felt native to the platform did better.
Are Thought Leader Ads cheaper than sponsored content?
Thought Leader Ads are cheaper per engagement but not reliably cheaper per website visit. In a separate comparison from the format table above, Kiin Labs' CPM page shows a $74.71 CPM against $48.80 for company-page sponsored content, with almost the same landing-page click rate. Across different advertisers on the engagement objective, they cost $13.51 per landing-page click against $16.61, but single-image ads on the website-visits objective were cheaper still, at $11.75.
ZenABM's 2026 figures for Thought Leader Ads, a 2.68% CTR and $2.29 CPC, count engagement clicks rather than website visits. Its landing-page figures for the format don't hold together: its text gives 0.29% as the median CTR and 0.43% as the average, which its summary table labels the median, and its $3.06 CPC doesn't reconcile with its $49.37 CPM (about $11 to $17 a click at those CTRs), so we leave them out. LinkedIn's own two-pager claims 1.7x higher CTR than other single-image campaigns, from a 2023 pilot with early testers, a figure LinkedIn itself calls directional.
The posts worth promoting are the ones already earning attention organically, which is why Thought Leader Ads work best on top of a founder's personal brand on LinkedIn. That following still sits on LinkedIn, and the platform decides how many of those people see each post.

Field note: In our LangWatch program, plain long-form text posts reached a 5.94% CTR and 10.97 seconds of dwell time, while video reached 3.7%. Before comparing a figure like that with any benchmark, we check the objective, because on engagement campaigns every "see more" expansion counts as a click and long text earns more of them. Dwell time doesn't depend on click definitions (LinkedIn measures it while at least half the ad is on screen), so we read it alongside CTR rather than after it.
Do LinkedIn ad costs differ between the US and Europe?
US LinkedIn campaigns cost about 1.7x to 1.8x what UK campaigns cost, and nearly 3x Dutch campaigns per impression. Kiin Labs' 2025-26 medians for single-country campaigns put US single-image CPM at $91.30, against $51.37 in the UK and $31.36 in the Netherlands, and US cost per lead at $292 against $160 in the UK.
A US landing-page click cost $21.68 against $12.87 in the UK, $12.45 in Germany and $11.00 in the Netherlands. These country figures come from Kiin Labs' cost report, which converts each account's spend to US dollars at 7 September 2026 exchange rates, withholds cells under 10 accounts, and was corrected on 21 October 2026 for a currency-conversion error; the figures here are the corrected ones. Exchange-rate moves since then shift the European figures.
The B2B House, a LinkedIn ads site run by the agency Tamarind, reports a similar gap from about $1M of spend over six months across multiple ad accounts, with $230 per lead in North America against $120 in EMEA, though the figures are undated, and the page's only method note, a 2020 reply, describes forecasting-tool data. ZenABM's 2026 country figures don't hold up for this comparison, because its source report gives two different sets of medians for the same countries, and its blog repeats one of them (see the method section).
Field note: In the Frends program, we found that in the Nordics many professionals set their LinkedIn profile to English even when the local language is their first. Targeting only local-language profiles misses a significant part of the audience. If you run LinkedIn outside English-speaking markets, check language targeting before you conclude a country is too small or too expensive.
How much does a LinkedIn lead cost?
A LinkedIn lead costs a median of $164 for a content offer and $343 for a demo request on Lead Gen Forms, in Kiin Labs' 2025-26 data. Metadata's 2025 figures show why one average misleads: the spend-weighted cost per lead is $202, but the median advertiser pays $376, and the 10th-90th percentile range is $109 to $1,340.
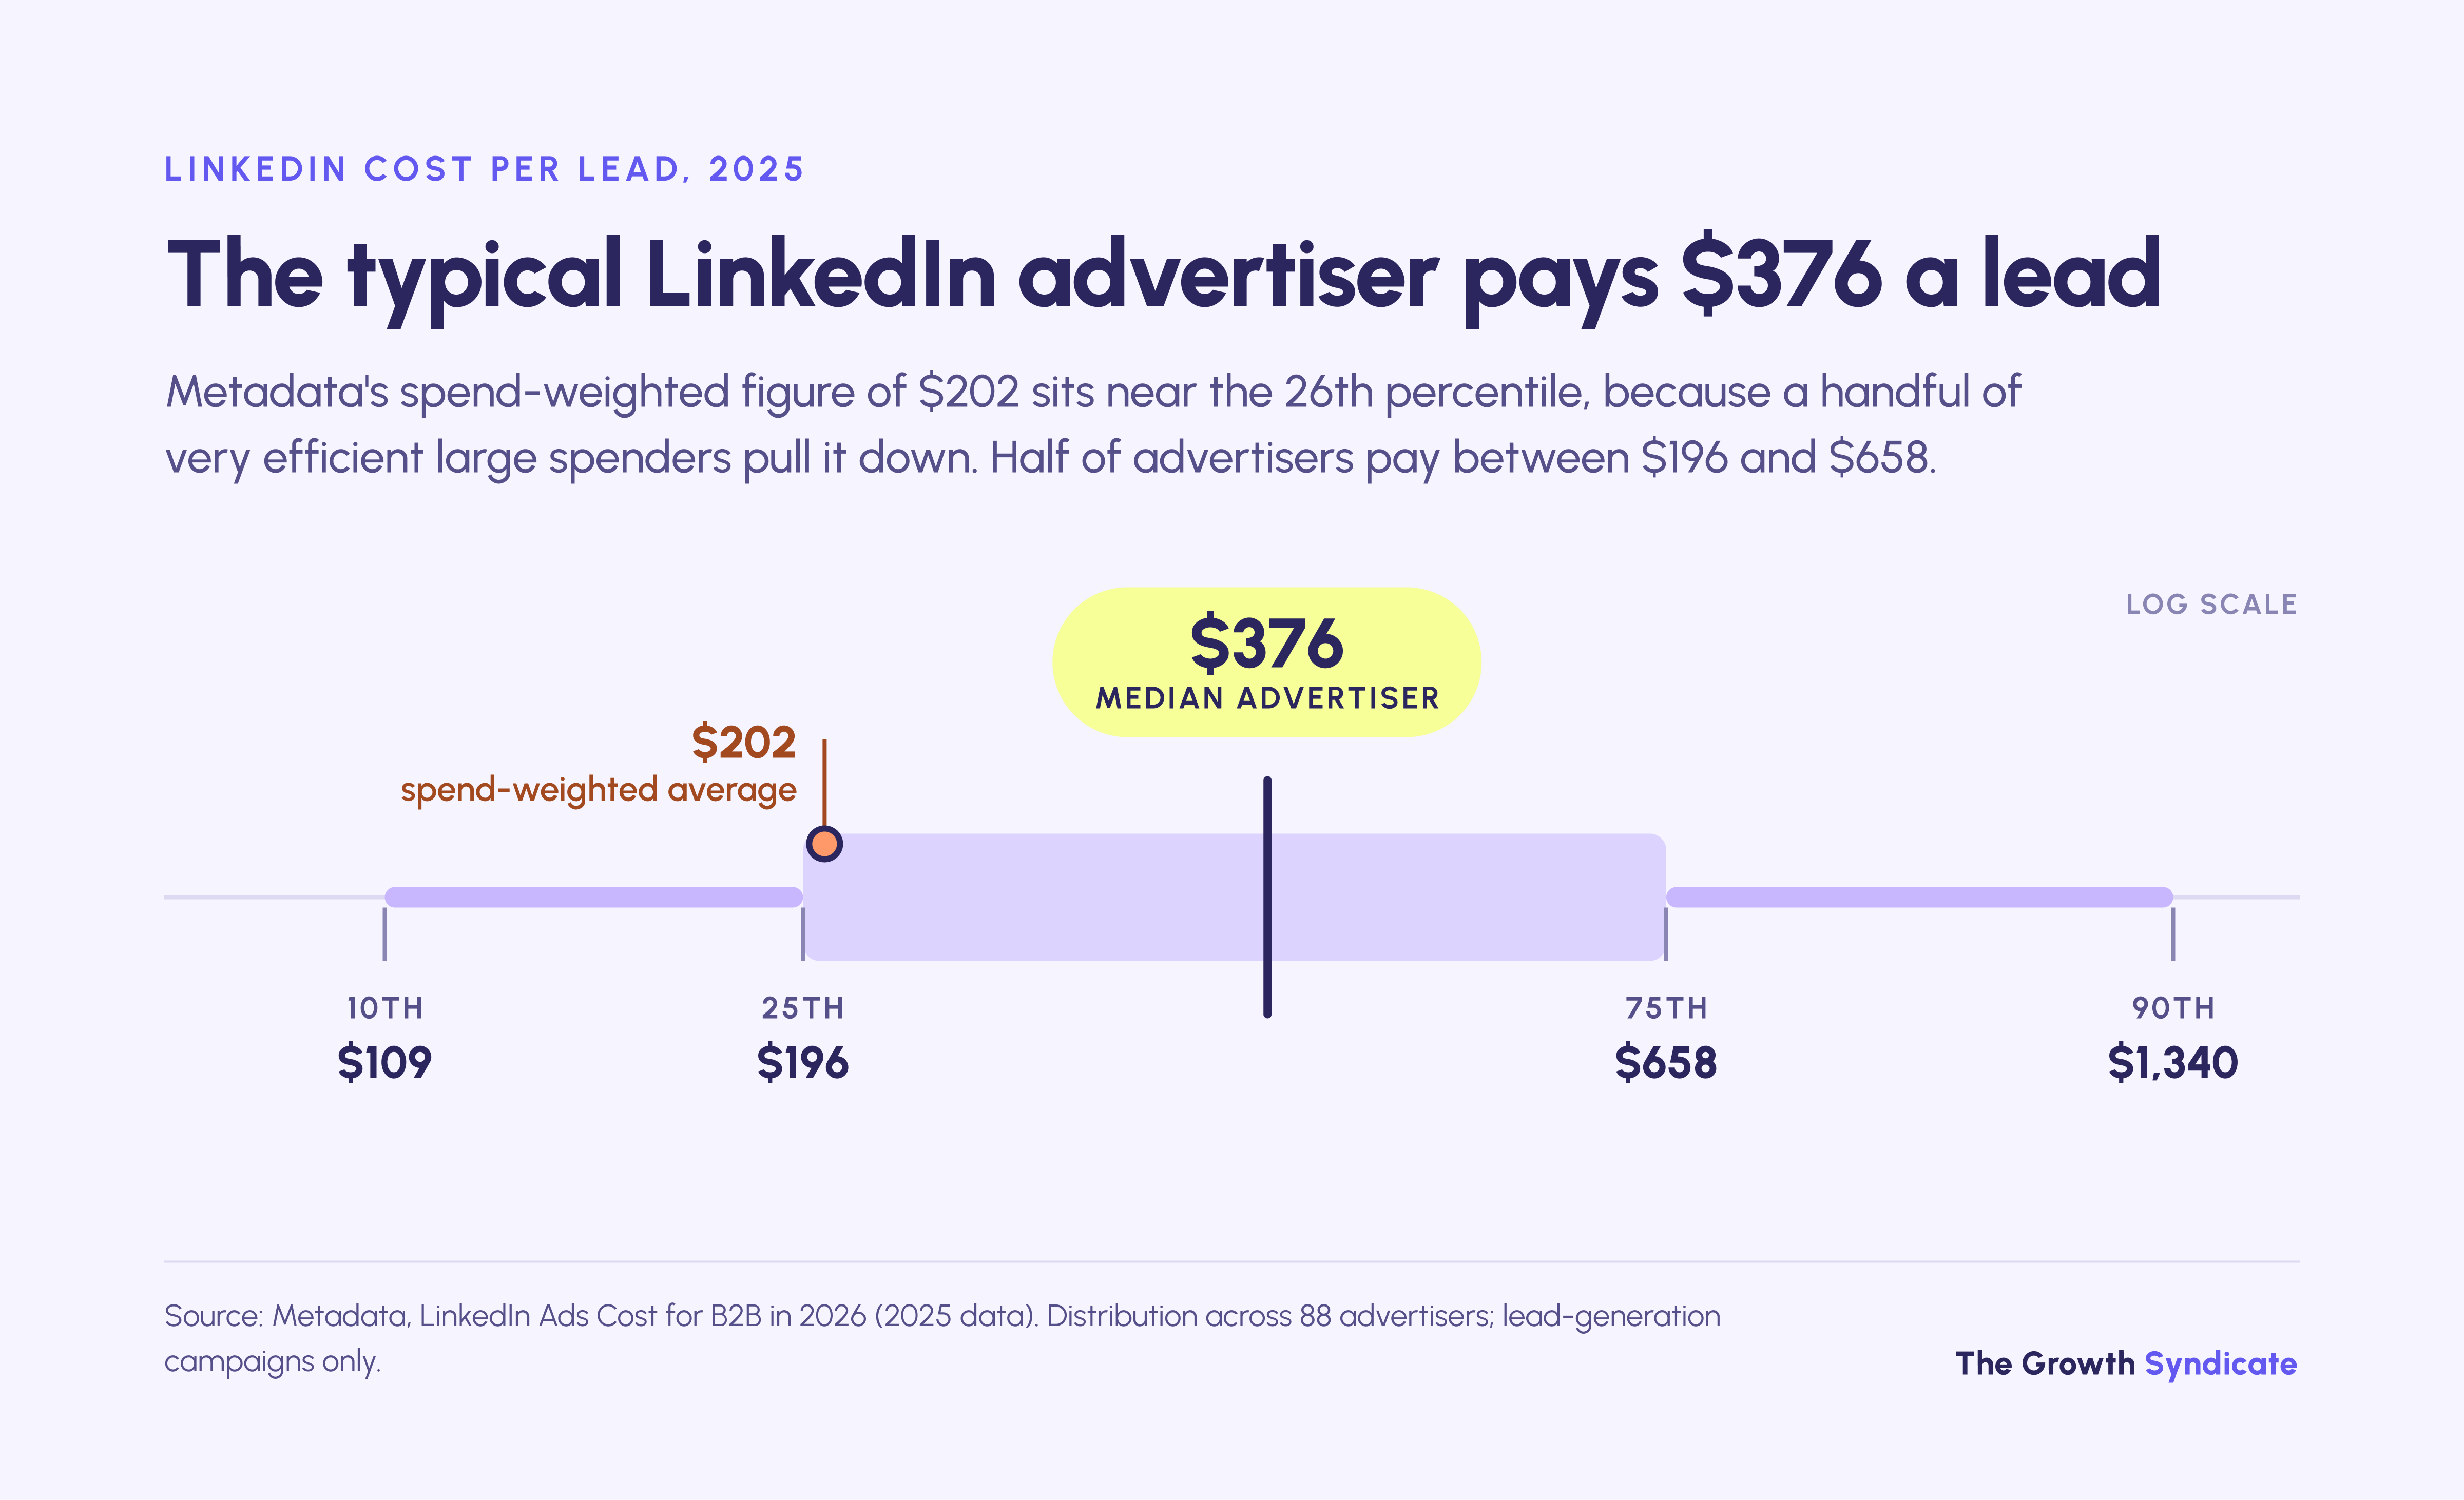
Metadata's LinkedIn cost page gives the full 2025 distribution across 88 advertisers: $109 at the 10th percentile, $196 at the 25th, $376 at the median, $658 at the 75th and $1,340 at the 90th. Metadata places the spend-weighted $202, which covers 138 advertisers, near the 26th percentile, because a handful of very efficient large spenders pull it down. If your cost per lead is $400, you're close to typical.
Lead type changes the cost as much as format does. Kiin Labs' Lead Gen Forms report reports content and demo leads separately, across 217 content and 115 demo accounts. A demo request costs about twice a content download at the median, and more than ten times as much on Thought Leader Ads.
Some of these cells are thin: the Thought Leader Ad figures rest on 8 to 16 accounts each, video's on 9 and 10, and the conversation-ad content figure on 9. Metadata's $142 for document ads covers all lead-gen audiences, so it differs from the $148 cold-audience figure above.
Kiin Labs' cross-account medians make video look cheap for content leads, at $119 against $189 for single image. Its paired comparison, which holds the advertiser constant, found video cost 62% more per lead on lead-gen campaigns. When a cross-account median and a within-account comparison disagree, trust the within-account one.
Cost per lead is the easiest number on this page to push down and the least useful to report. Our position is that LinkedIn programs answer to pipeline, which is why the next section matters more than this one.

Do Lead Gen Forms beat landing pages?
Lead Gen Forms usually beat landing pages on cost, and in Metadata's data on pipeline too. Its 2025 LinkedIn lead-gen campaigns paid $193 per form lead against $346 per landing-page lead, and forms sourced 9.3x pipeline per dollar against 5.3x. Within the same accounts, Kiin Labs found forms cut the cost per content lead by 82%, on 15 accounts.
Metadata's cost comparison covers 97 form advertisers and 65 landing-page advertisers, so it runs across accounts, and its pipeline figures rest on its 90 CRM-connected advertisers in a split it doesn't publish. Kiin Labs' paired version is narrower but cleaner: forms were cheaper per lead in 15 of 20 accounts that ran both, by 55% across all offers, a statistically significant result on a sample Kiin Labs gives its lowest confidence rating. For demo requests the difference was 9%, across seven accounts, and not statistically significant.
Forms don't fix intent. Kiin Labs measured median form completion in feed ads at 10.8% for content offers and 2.2% for demo requests, so a demo form still filters hard. Neither dataset publishes whether form leads become customers at the same rate as landing-page leads.
Is retargeting cheaper per lead than prospecting?
Retargeting was not cheaper per lead in Metadata's 2025 LinkedIn data, where retargeting leads cost $234 against $194 for cold audiences. Metadata's report-level finding, with no channel stated, shows a smaller premium in the same direction ($196 against $187) alongside 9.6x pipeline per dollar for retargeting, against 7.97x for all lead-gen spend (the finding's text gives no figure for cold audiences), so cost per lead alone isn't evidence against retargeting.
Metadata publishes the advertiser count only for the cold-audience LinkedIn figure (94 advertisers).
For demo capture, Kiin Labs' 2026 budget analysis found cold audiences cost about 40% more per demo than retargeting, once gift-card offers are excluded. It also found retargeting costs rise more slowly as spend per audience member grows, about 15% per doubling against 61% for cold. The two datasets measure different things, which is the honest answer to why they disagree.
Are LinkedIn ads worth it?
LinkedIn returned more pipeline per dollar than Google Ads, Facebook or Instagram in Metadata's 2025 data, but whether it pays back depends on deal size and attribution. Each dollar of LinkedIn lead-gen spend sourced $10.20 of pipeline across 94 advertisers, and Dreamdata measured a 121% return on ad spend in closed-won revenue.
The models answer different questions, so the numbers can't be ranked against each other. A sourced model credits LinkedIn only when the CRM records an ad-generated lead, and an influenced model credits any account the ads touched before a deal opened. A sourced figure will usually look smaller than an influenced one for the same program, which is why B2B marketing attribution has to be settled before anyone compares LinkedIn returns.

How much pipeline does $1 of LinkedIn ad spend generate?
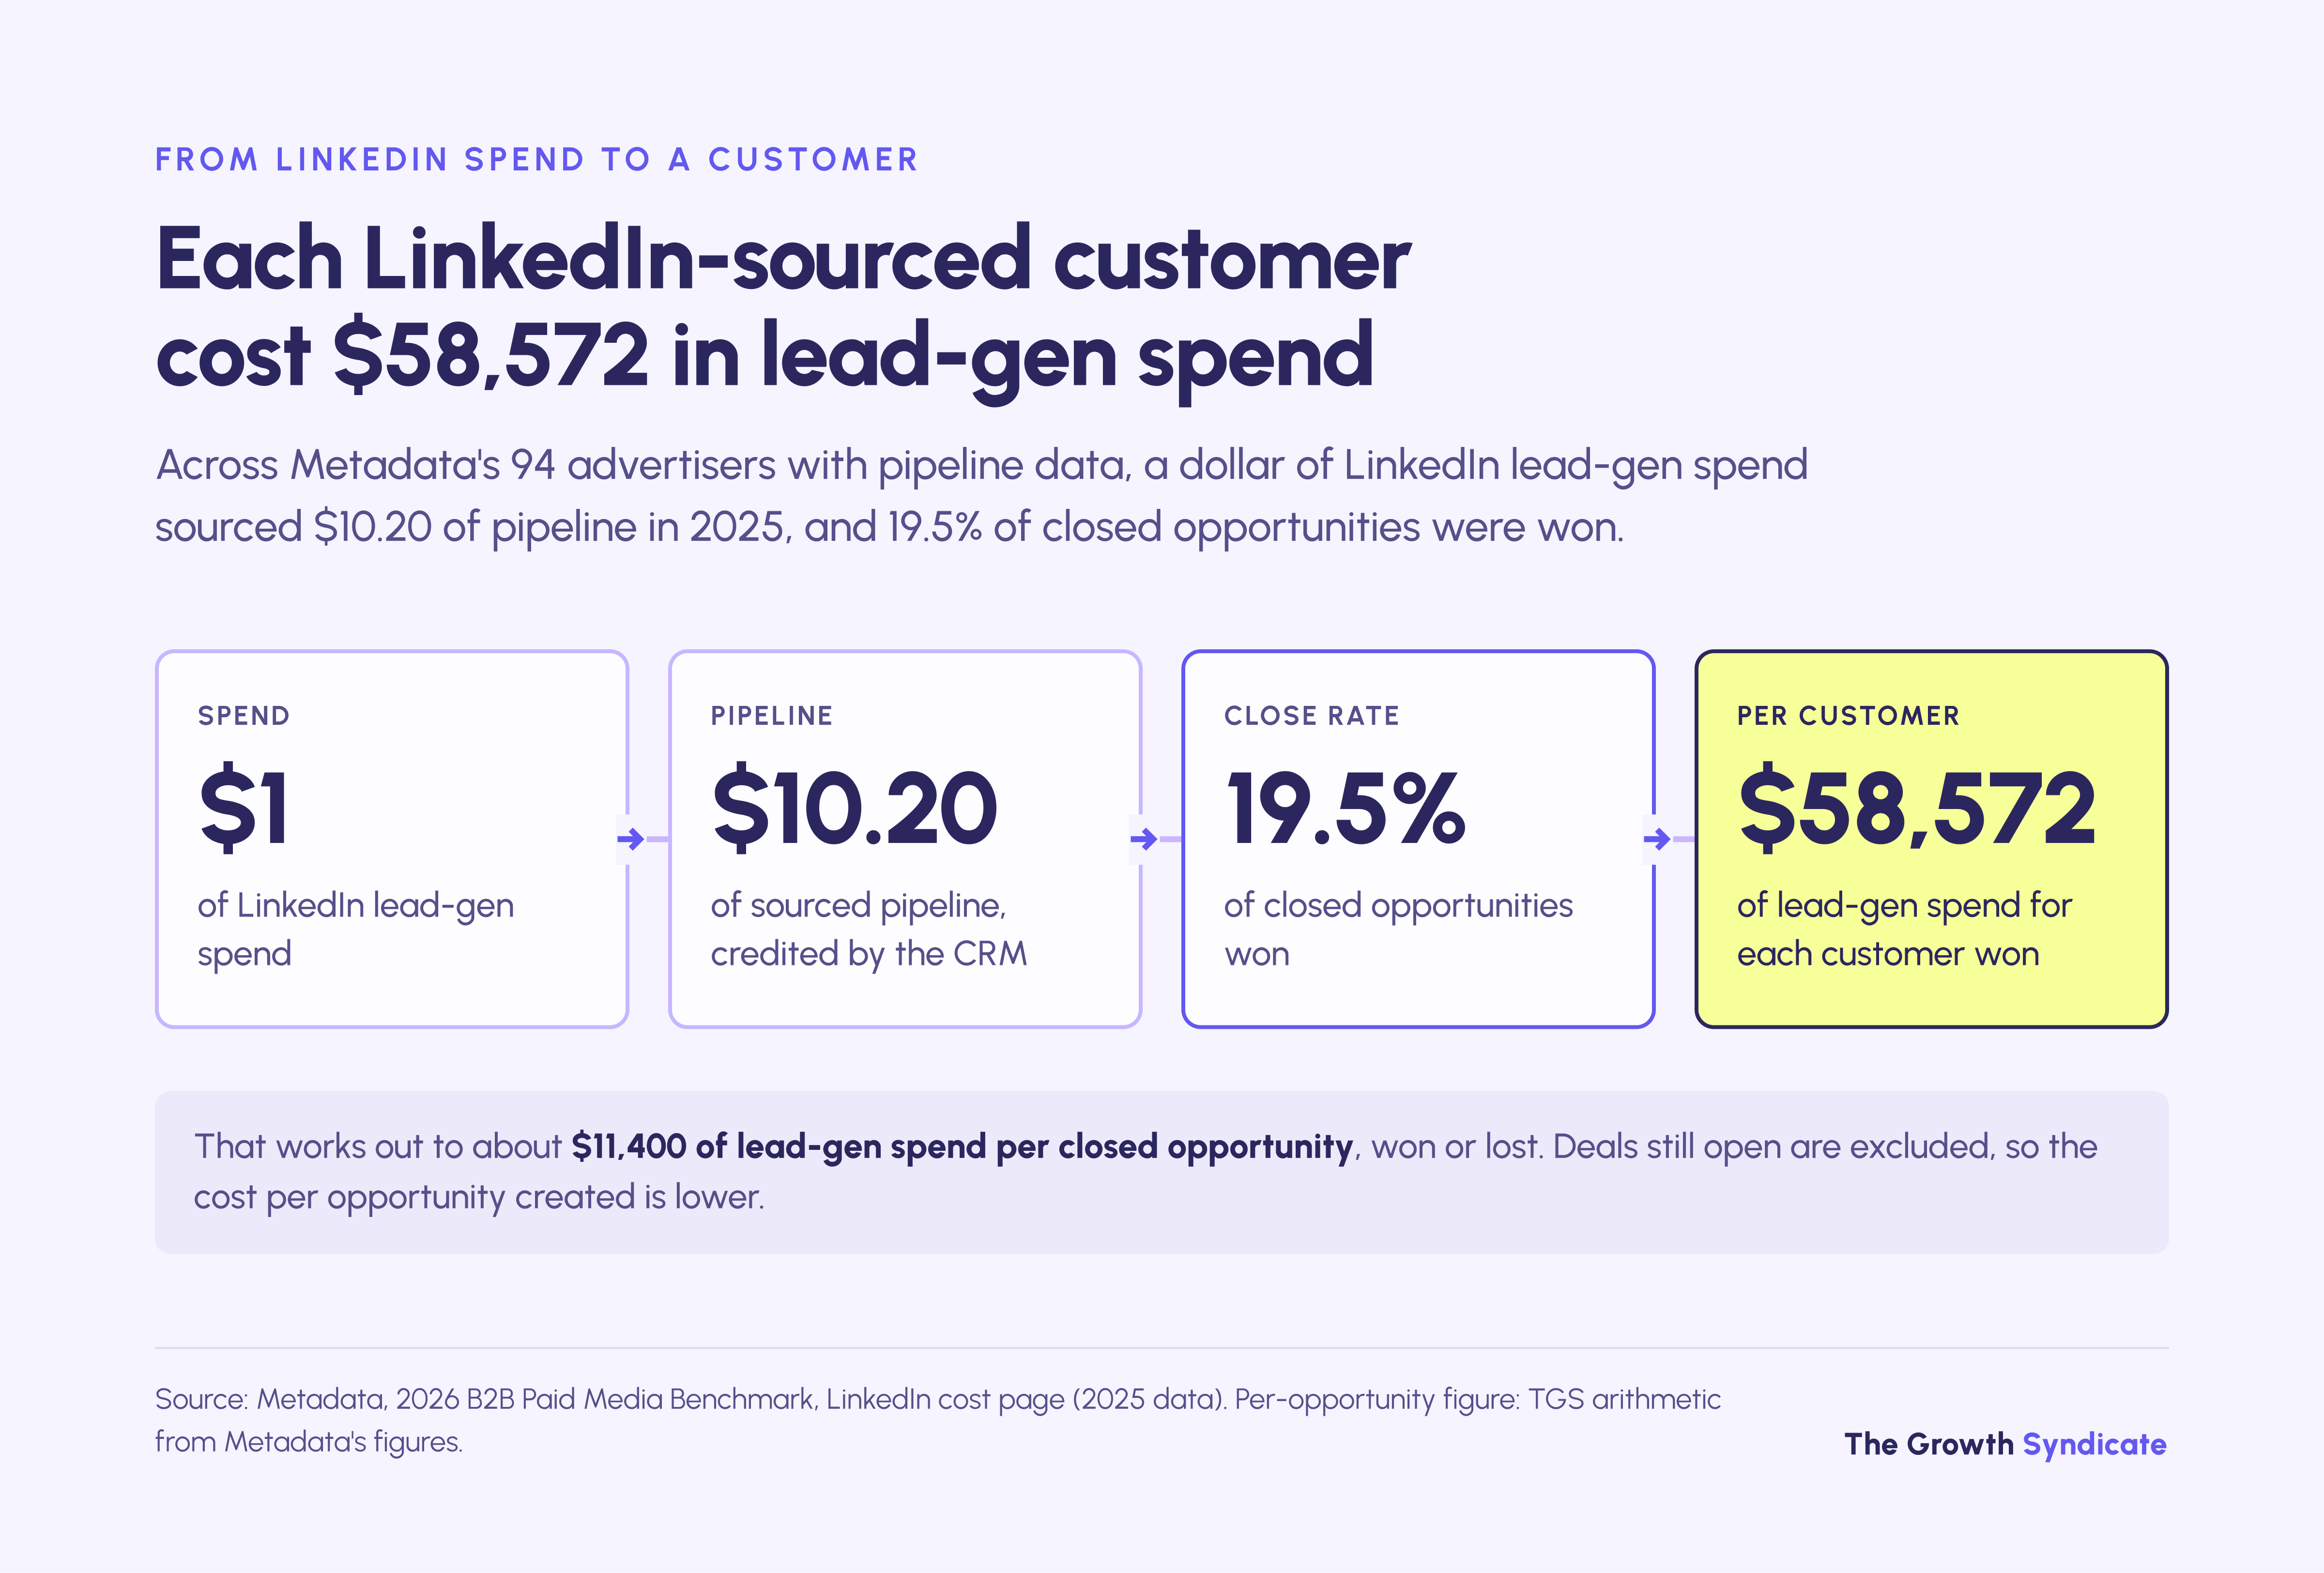
One dollar of LinkedIn lead-gen spend sourced $10.20 of pipeline across Metadata's 94 advertisers with pipeline data in 2025, against $3.95 on Google Ads. Pipeline is open opportunity value, not revenue: Metadata's LinkedIn spend had returned 0.71x in closed-won revenue while 2025 deals were still open.
Metadata's LinkedIn pipeline finding compares channels on the same sourced basis. LinkedIn returned 10.2x pipeline per dollar, Google Ads 3.95x, Facebook 3.11x and Instagram 1.8x, across Metadata's customers.
Those figures let you work out what an opportunity costs. Metadata reports $58,572 of LinkedIn lead-gen spend per customer and a 19.5% close rate on ad-sourced opportunities, which works out to about $11,400 of lead-gen spend per opportunity that closed, won or lost (our arithmetic). Deals still open aren't in that figure, so the cost per opportunity created is lower.
What does a customer from LinkedIn ads cost?
A customer sourced by LinkedIn ads cost $58,572 in lead-gen spend across Metadata's 2025 data, and the figure varies by the size of the company you target. Of the three company-size bands Metadata reports, customers at companies with 51-200 employees cost about $31k, at 501-1,000 employees about $103k, and at 1,001-5,000 employees about $78k, so mid-market buyers were the most expensive to win.
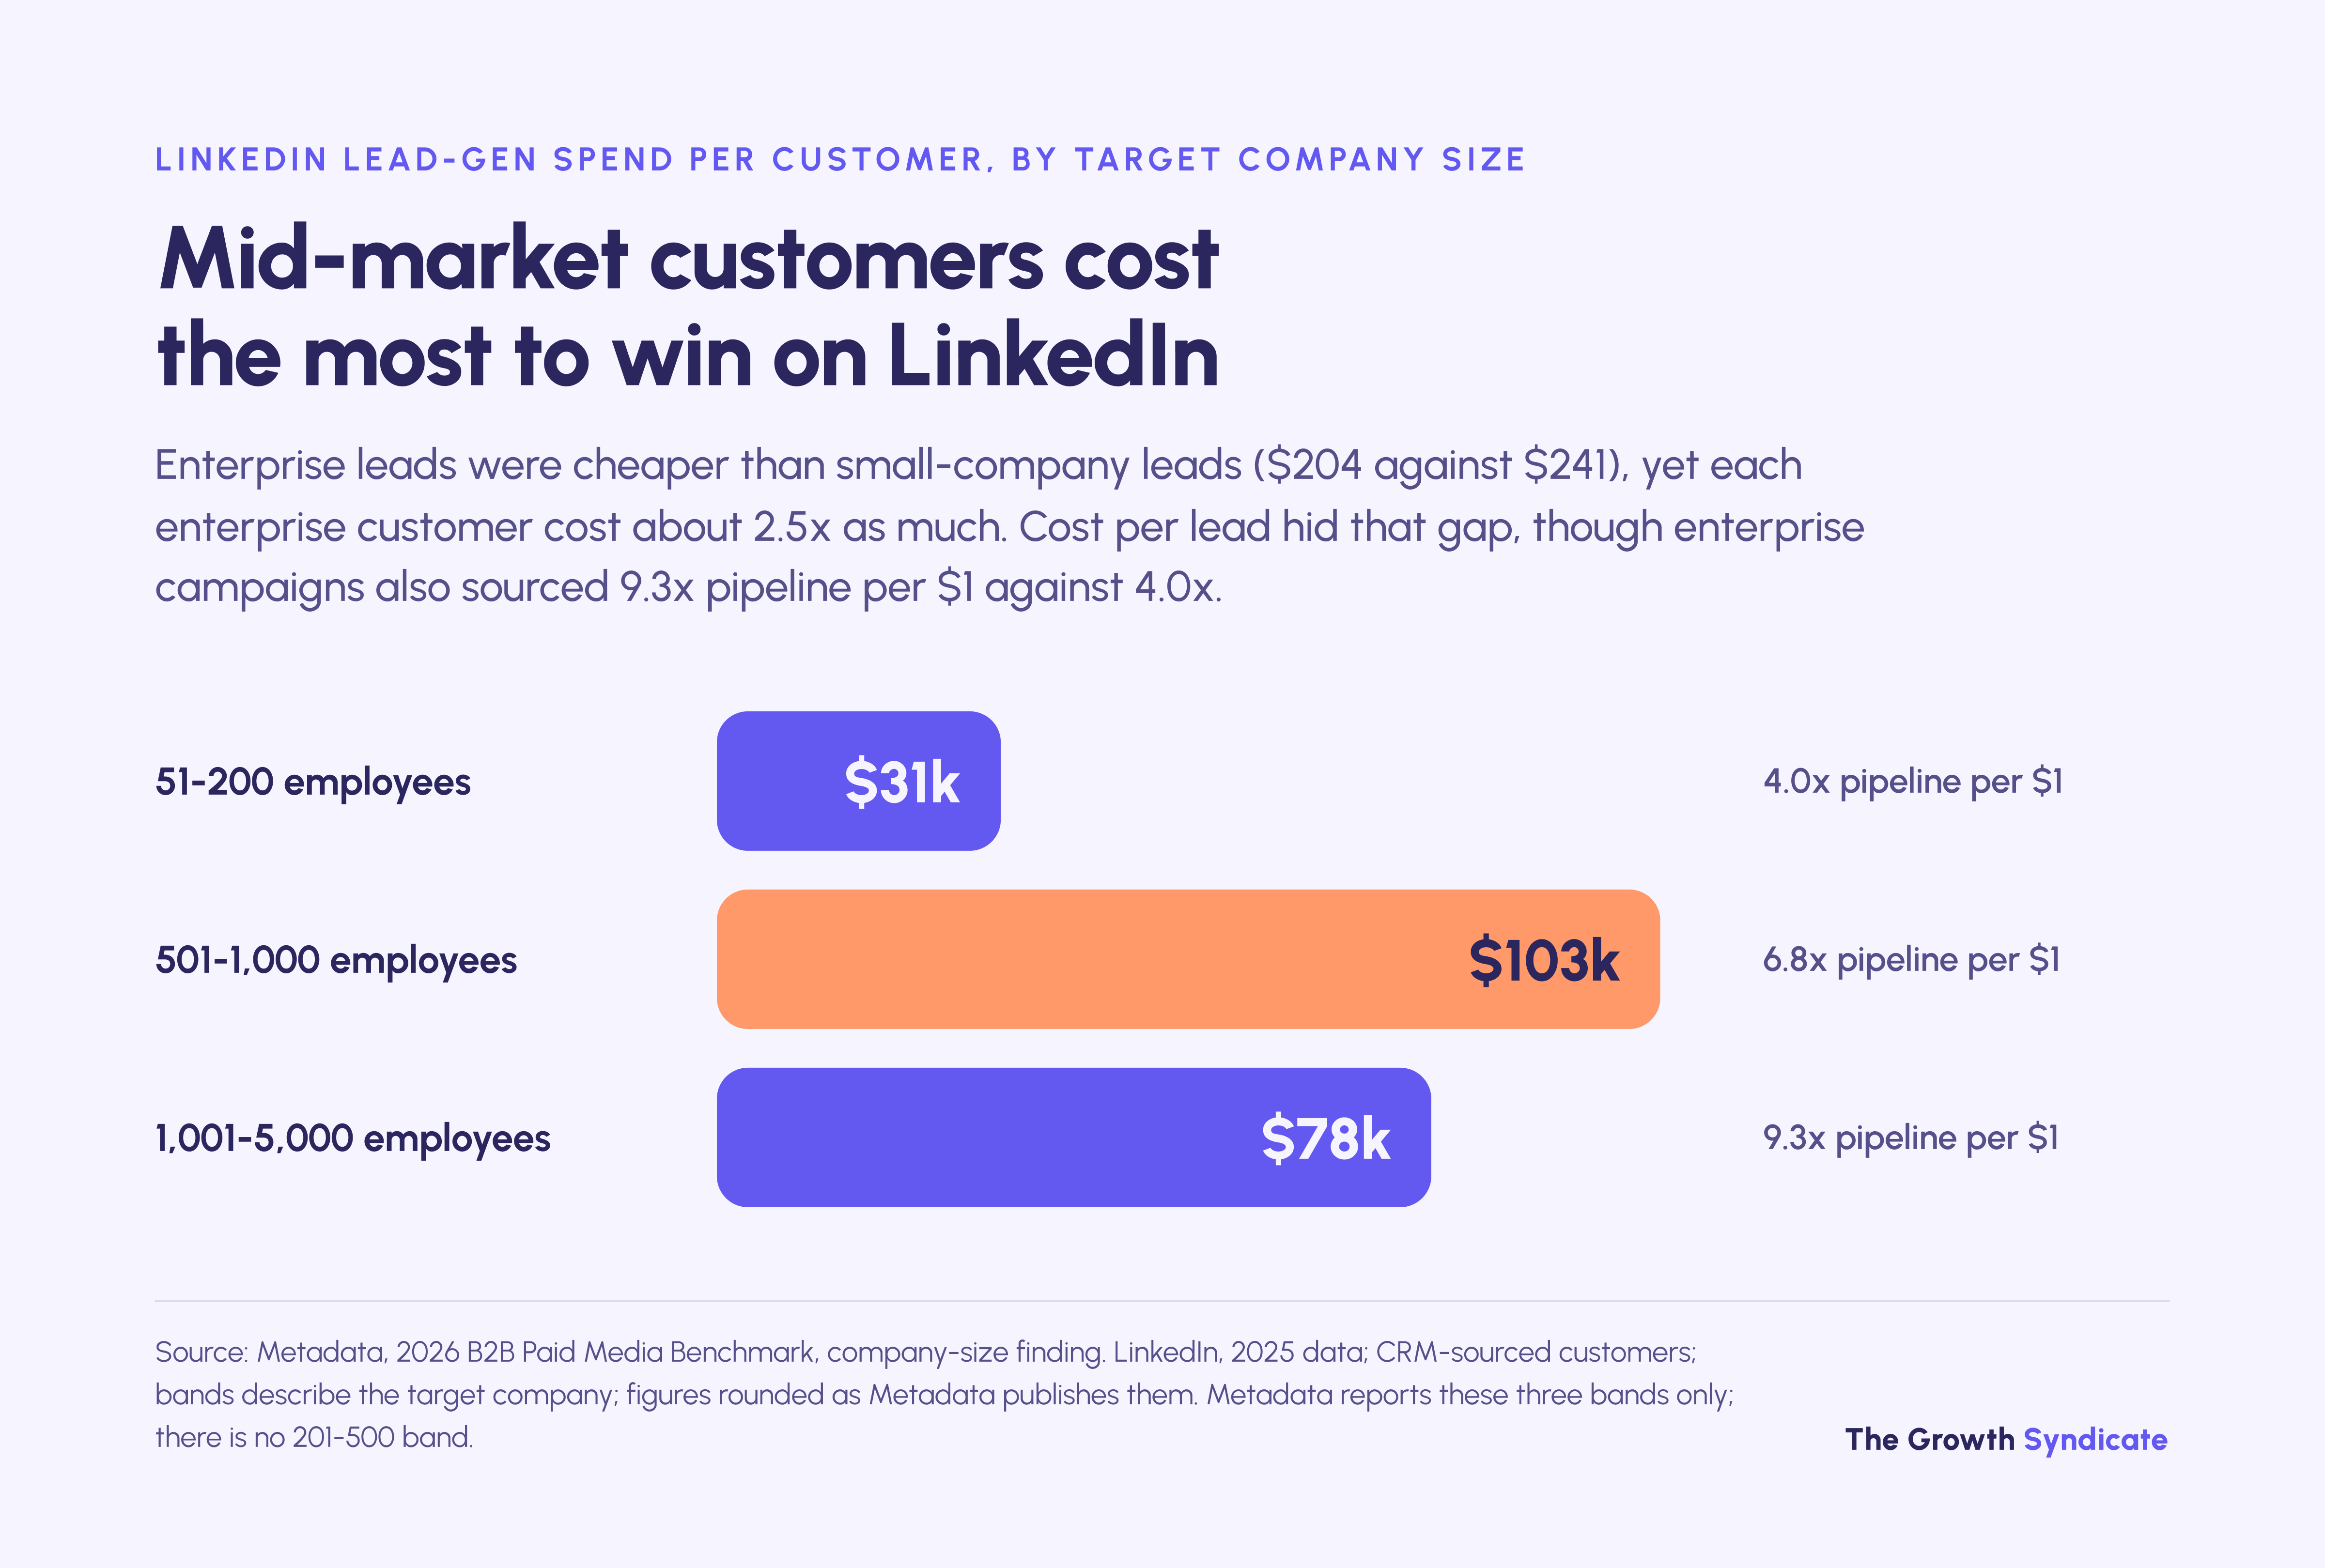
Metadata's company-size finding also shows pipeline per dollar rising with target size: 4.0x at 51-200 employees, 6.8x at 501-1,000 and 9.3x at 1,001-5,000. Leads were cheaper at the enterprise end, $204 against $241, yet each enterprise customer cost about 2.5x as much ($78k against $31k). A cost-per-lead target would have hidden that gap, though the enterprise campaigns also sourced 2.3x as much pipeline per dollar, so deal size decides which band pays back.
How long do LinkedIn ads take to produce revenue?
LinkedIn ads take most of a year to produce revenue. Dreamdata's 2026 benchmark measured 281 days from a buyer's first LinkedIn ad impression to revenue, down from 320 days in its 2025 report. The full journey from first marketing touch ran 272 days, and first touch to new business took 326 days at companies with more than 250 employees.
A nine-month lag means a LinkedIn program judged on revenue after one quarter will look like a failure even when it's working. We judge the first two quarters on which target accounts engage and how many opportunities those accounts open, then hold the program to revenue once the cycle has had time to close.
Field note: We report LinkedIn programs by account rather than by click. In the Frends program, every account that interacts with the ads goes into a shared file, broken down by impressions, engagements and region; the program counts 300+ engaged high-value accounts and 24 opportunities attributed to ABM and paid. LangWatch's account-based program influenced 42 deals and €325,250 of pipeline in nine months, with LinkedIn remarketing running alongside outbound.
How much should you spend on LinkedIn ads?
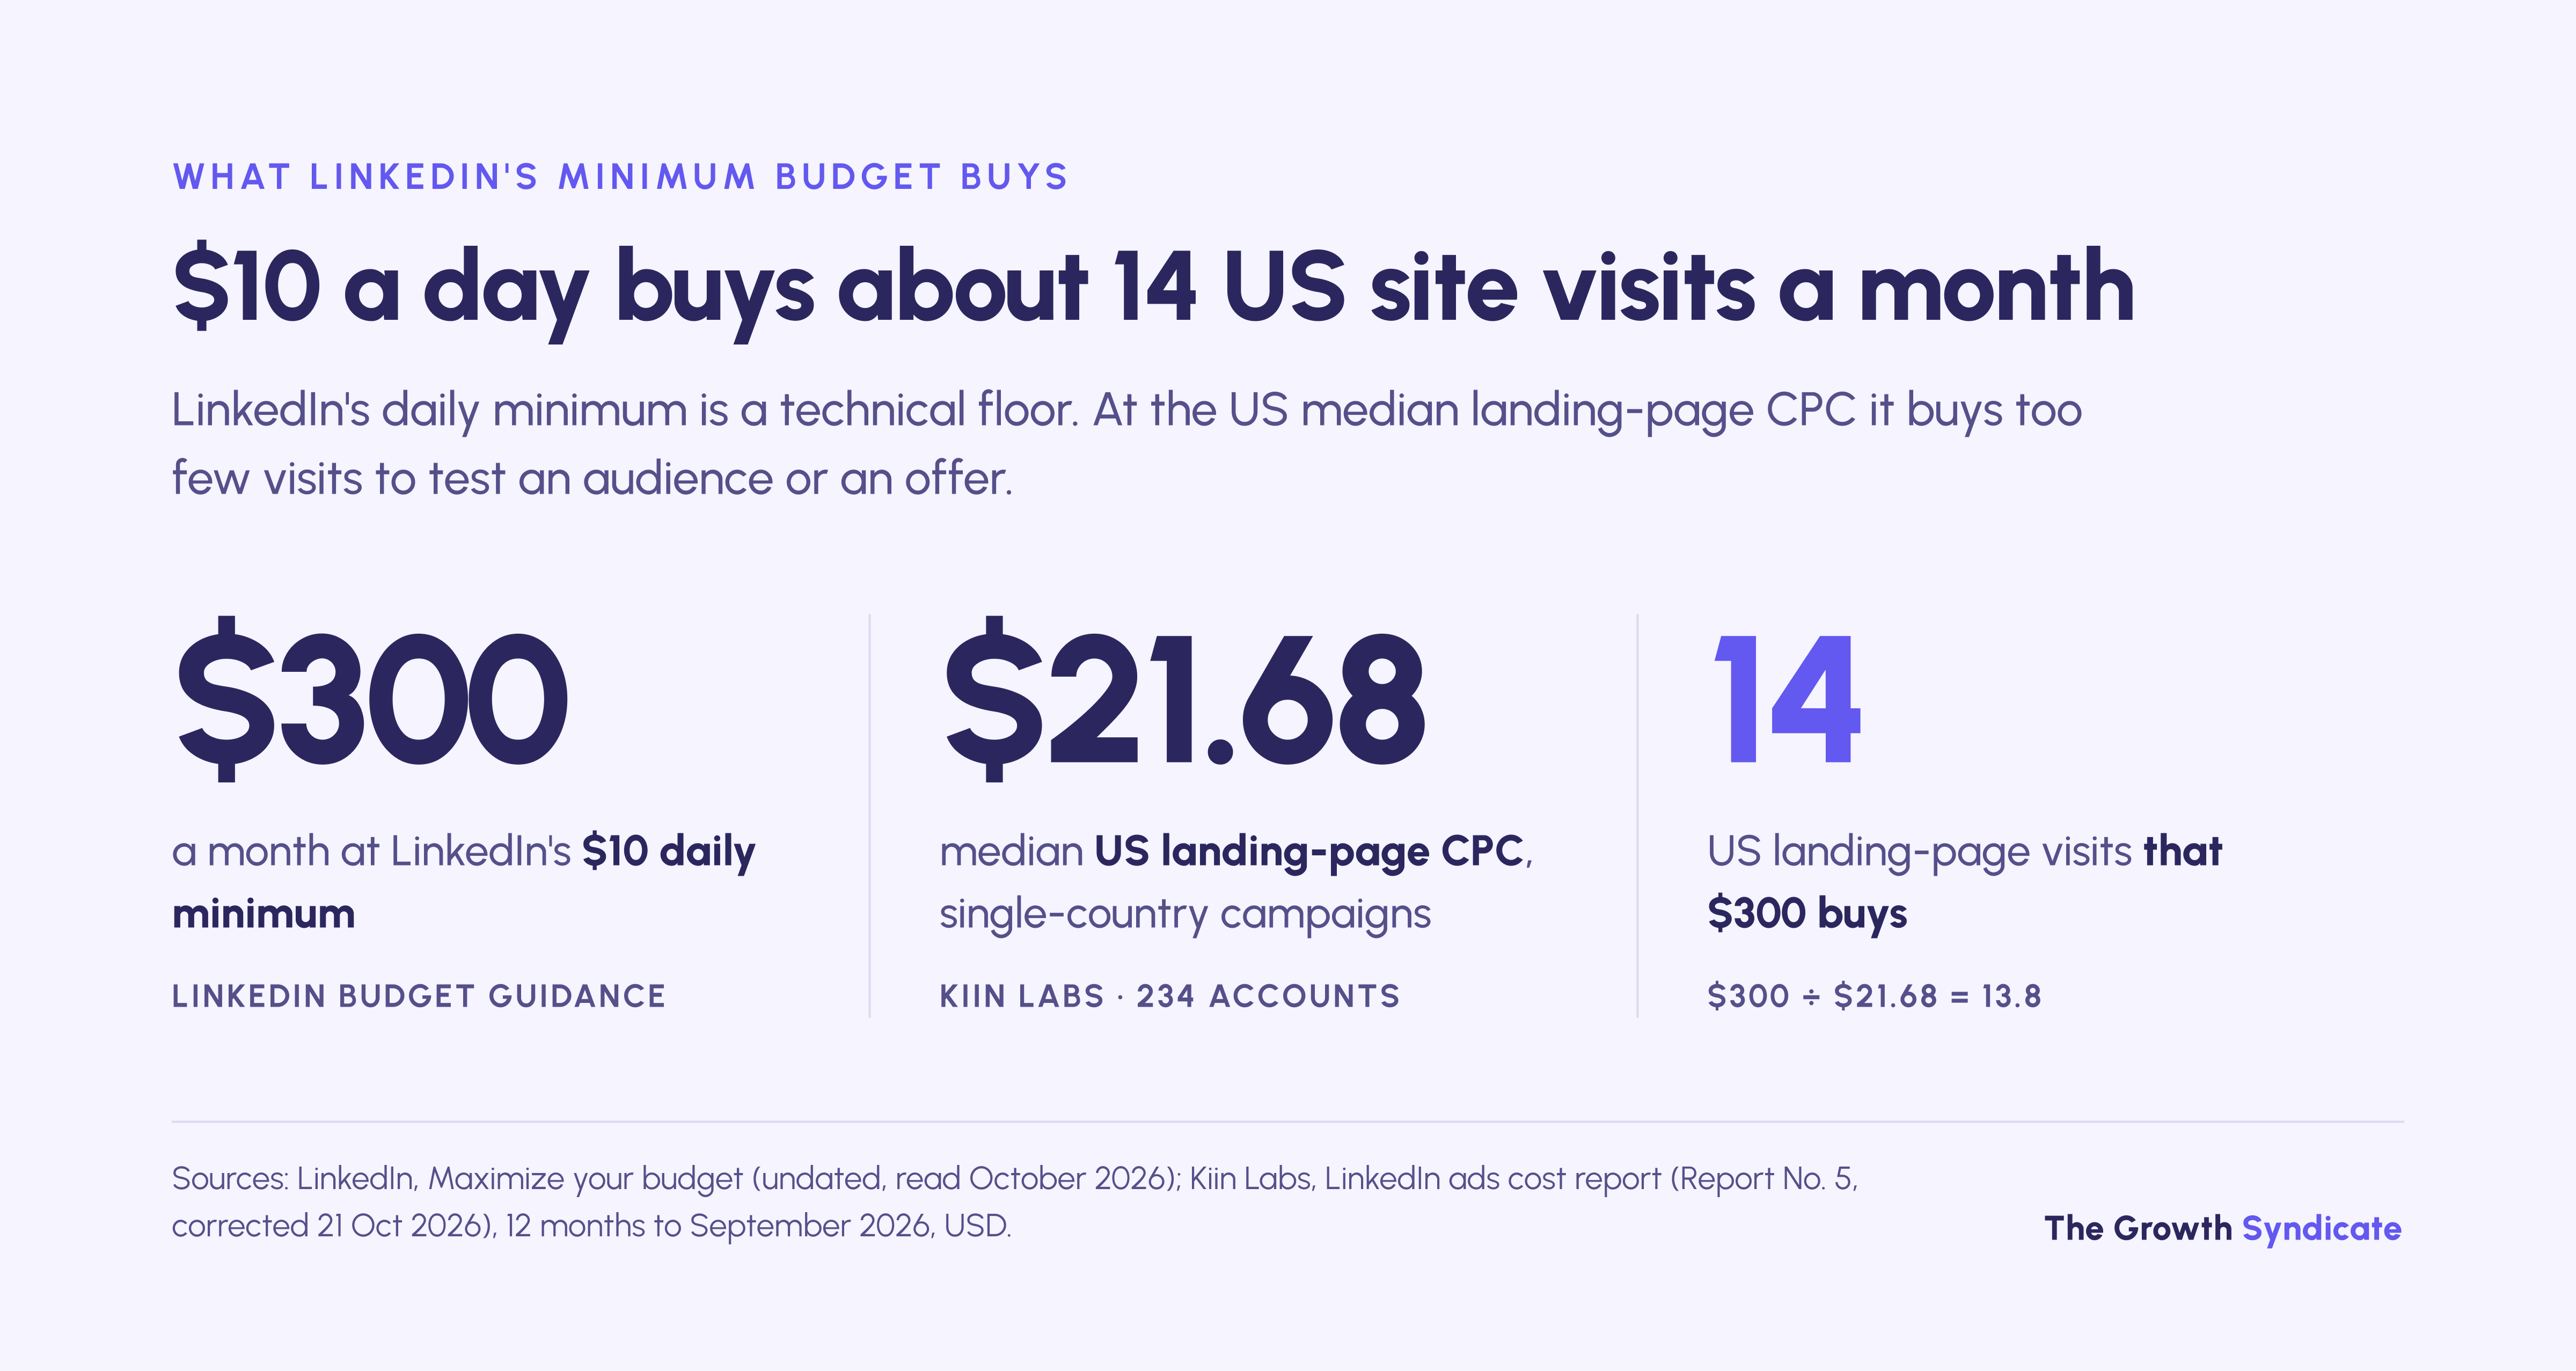
Set a LinkedIn ads budget by working backward from the opportunities you need and your cost per lead. At Kiin Labs' 2025-26 US median of $292 per lead, 20 leads a month costs about $5,840. LinkedIn's $10 daily minimum, about $300 a month, buys roughly 14 US landing-page visits, which makes it a technical floor rather than a test budget.
Start from the deal. Metadata's 2025 data puts a LinkedIn-sourced customer at $31k to $103k in lead-gen spend across the three company-size bands it reports, so a program selling $15,000 contracts has a different budget ceiling from one selling $300,000 contracts. The useful question is how much you can pay per opportunity, given your win rate and contract value.
Budget also has diminishing returns within an audience. Kiin Labs' 2026 analysis of 140 advertisers found each doubling of monthly budget per audience member brought about 52% more demo requests, with each demo costing about 31% more. Its demo budget analysis suggests starting capture at about $20 to $40 per 1,000 audience members a month and adding spend only while the next demo is worth its cost.
How do you lower LinkedIn ad costs?
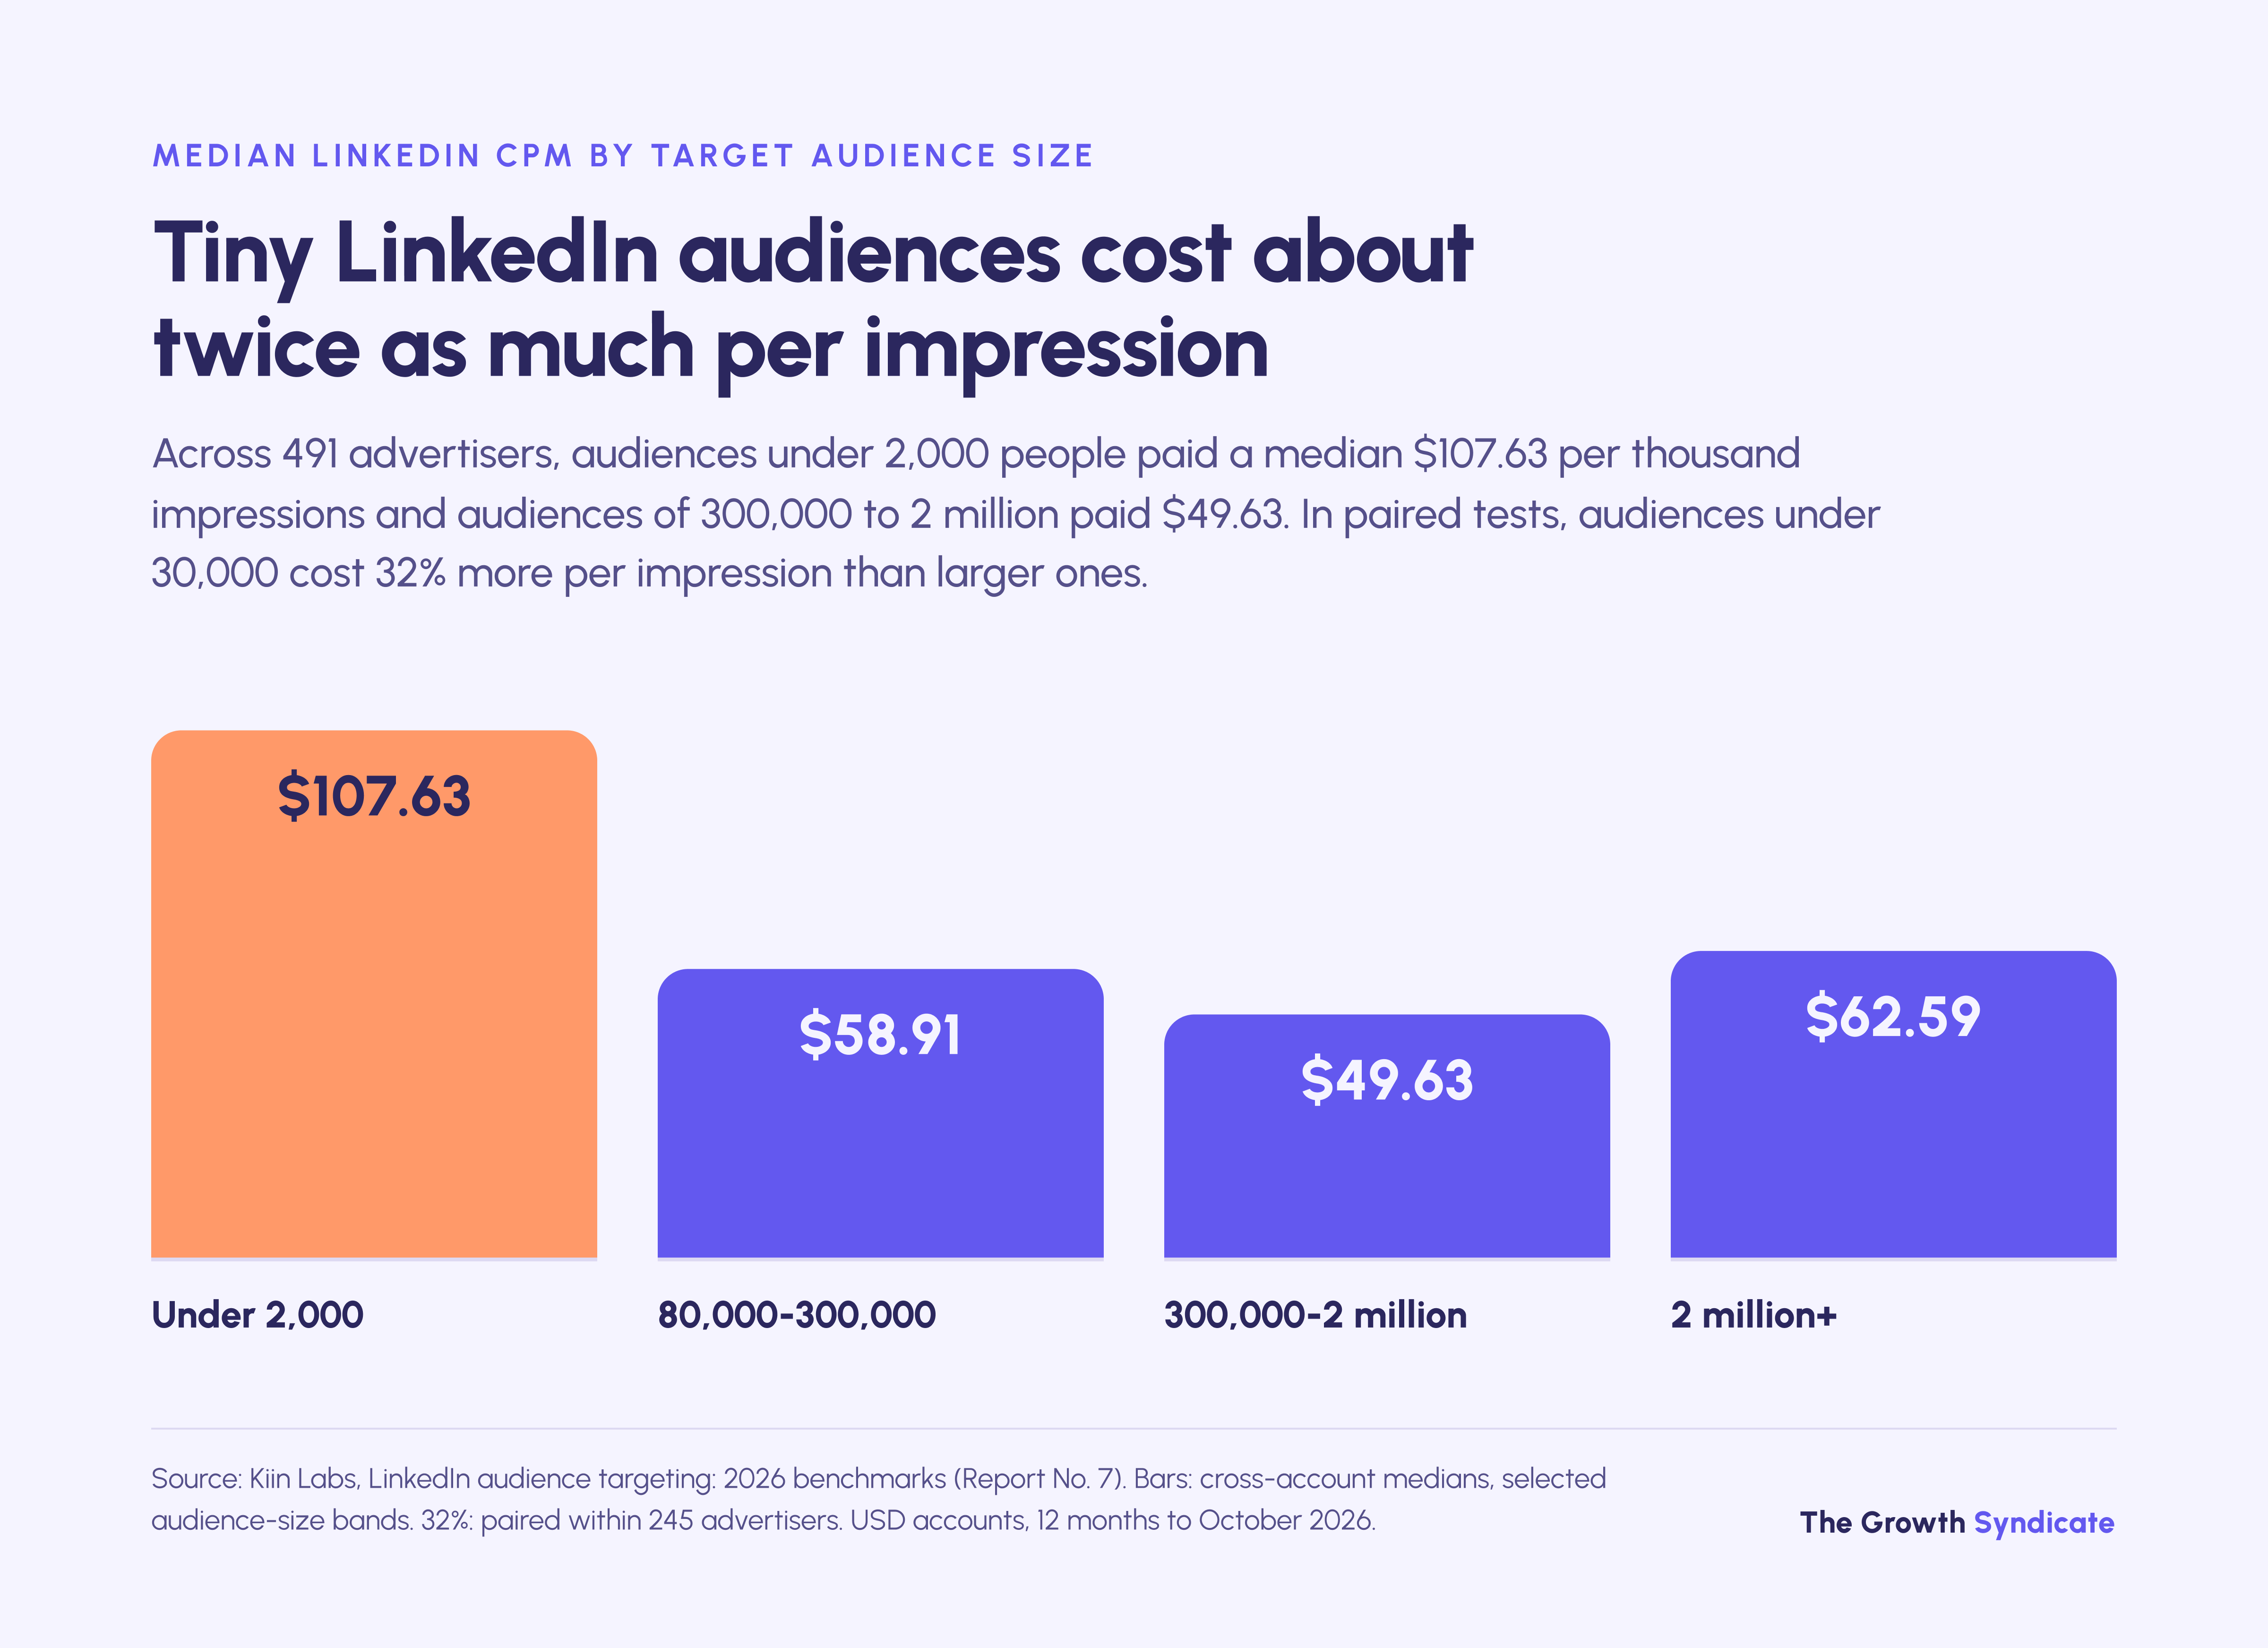
Lower LinkedIn ad costs by fixing targeting and tracking before you touch bids. Kiin Labs' 2026 targeting report found audiences under 30,000 people cost 32% more per thousand impressions than broader ones in the same account. The objective matters as much: in Kiin Labs' benchmarks, lead-gen campaigns paid 40% more per impression than website-visit campaigns in the same accounts.
The fixes we make most often are these six:
- Check tracking first. Confirm conversions are set up and connected to the paid channels, then check where they land in the CRM. An account that can't see its conversions can't be optimized.
- Tighten job-title targeting. Loose title targeting serves ads to HR staff and other non-buyers when the target is IT decision-makers, and it's one of the most common budget leaks we find in new accounts. Kiin Labs found job titles cost 13% more per thousand impressions than job functions within the same accounts, which is a fair price for not paying to reach the wrong people.
- Split campaigns by audience and stage. Separate campaigns by geography, and keep retargeting audiences segmented from cold ones, so you can see which one is spending.
- Pick the objective for the result you want. In Kiin Labs' data, single-image sponsored content on the website-visits objective delivered the cheapest landing-page clicks of the setups it compared, at a median $11.75.
- Refresh creative on a schedule. Saturation and creative fatigue raise costs before anyone notices the account has gone stale.
- Send conversions through the Conversions API. LinkedIn reports that advertisers using it saw 20% lower cost per acquisition and 31% more attributed conversions, a platform claim relayed in Dreamdata's 2025 highlights.
Kiin Labs' within-account comparisons put numbers on several of these choices. Each row compares an account with itself, running both options (the uploaded-list row compares the same list with and without a filter), which removes most of the noise in cross-account medians.
Every engagement with our paid performance team starts with an audit, and tracking is the first thing worth checking, for the same reason the list starts there.
Field note: For Cradle, an AI protein-engineering company whose LinkedIn program focused on the top pharma companies in the EU and US, we refined targeting over iterative campaign rounds, from broad C-level targeting to granular job-title segmentation, which the case study credits with improving targeting efficiency and reducing costs. Job-title targeting costs more per impression, as the Kiin Labs data shows, and it's still usually the right call when the alternative is paying to reach the wrong people at a lower CPM.
What will your LinkedIn budget produce?
A LinkedIn budget produces leads at your market's cost per lead, then opportunities and customers at your own conversion rates. The defaults below use the medians on this page, with cost per lead shown as a range from the 25th to the 75th percentile wherever Kiin Labs publishes one.
To run the numbers, you need your monthly budget, target country, objective and average contract value, plus your own lead-to-opportunity and win rates. Keep the daily budget at or above LinkedIn's $10 minimum and the audience at or above the 50,000 LinkedIn recommends for single-image and text ads.
The calculation is simple enough to run by hand. Budget divided by cost per lead gives leads, leads times your lead-to-opportunity rate gives opportunities, and budget divided by opportunities gives cost per opportunity. A $10,000 monthly US budget at $292 per lead produces about 34 leads; at a 20% lead-to-opportunity rate that's about seven opportunities, at roughly $1,460 each.
Which LinkedIn ad statistics should you stop quoting?
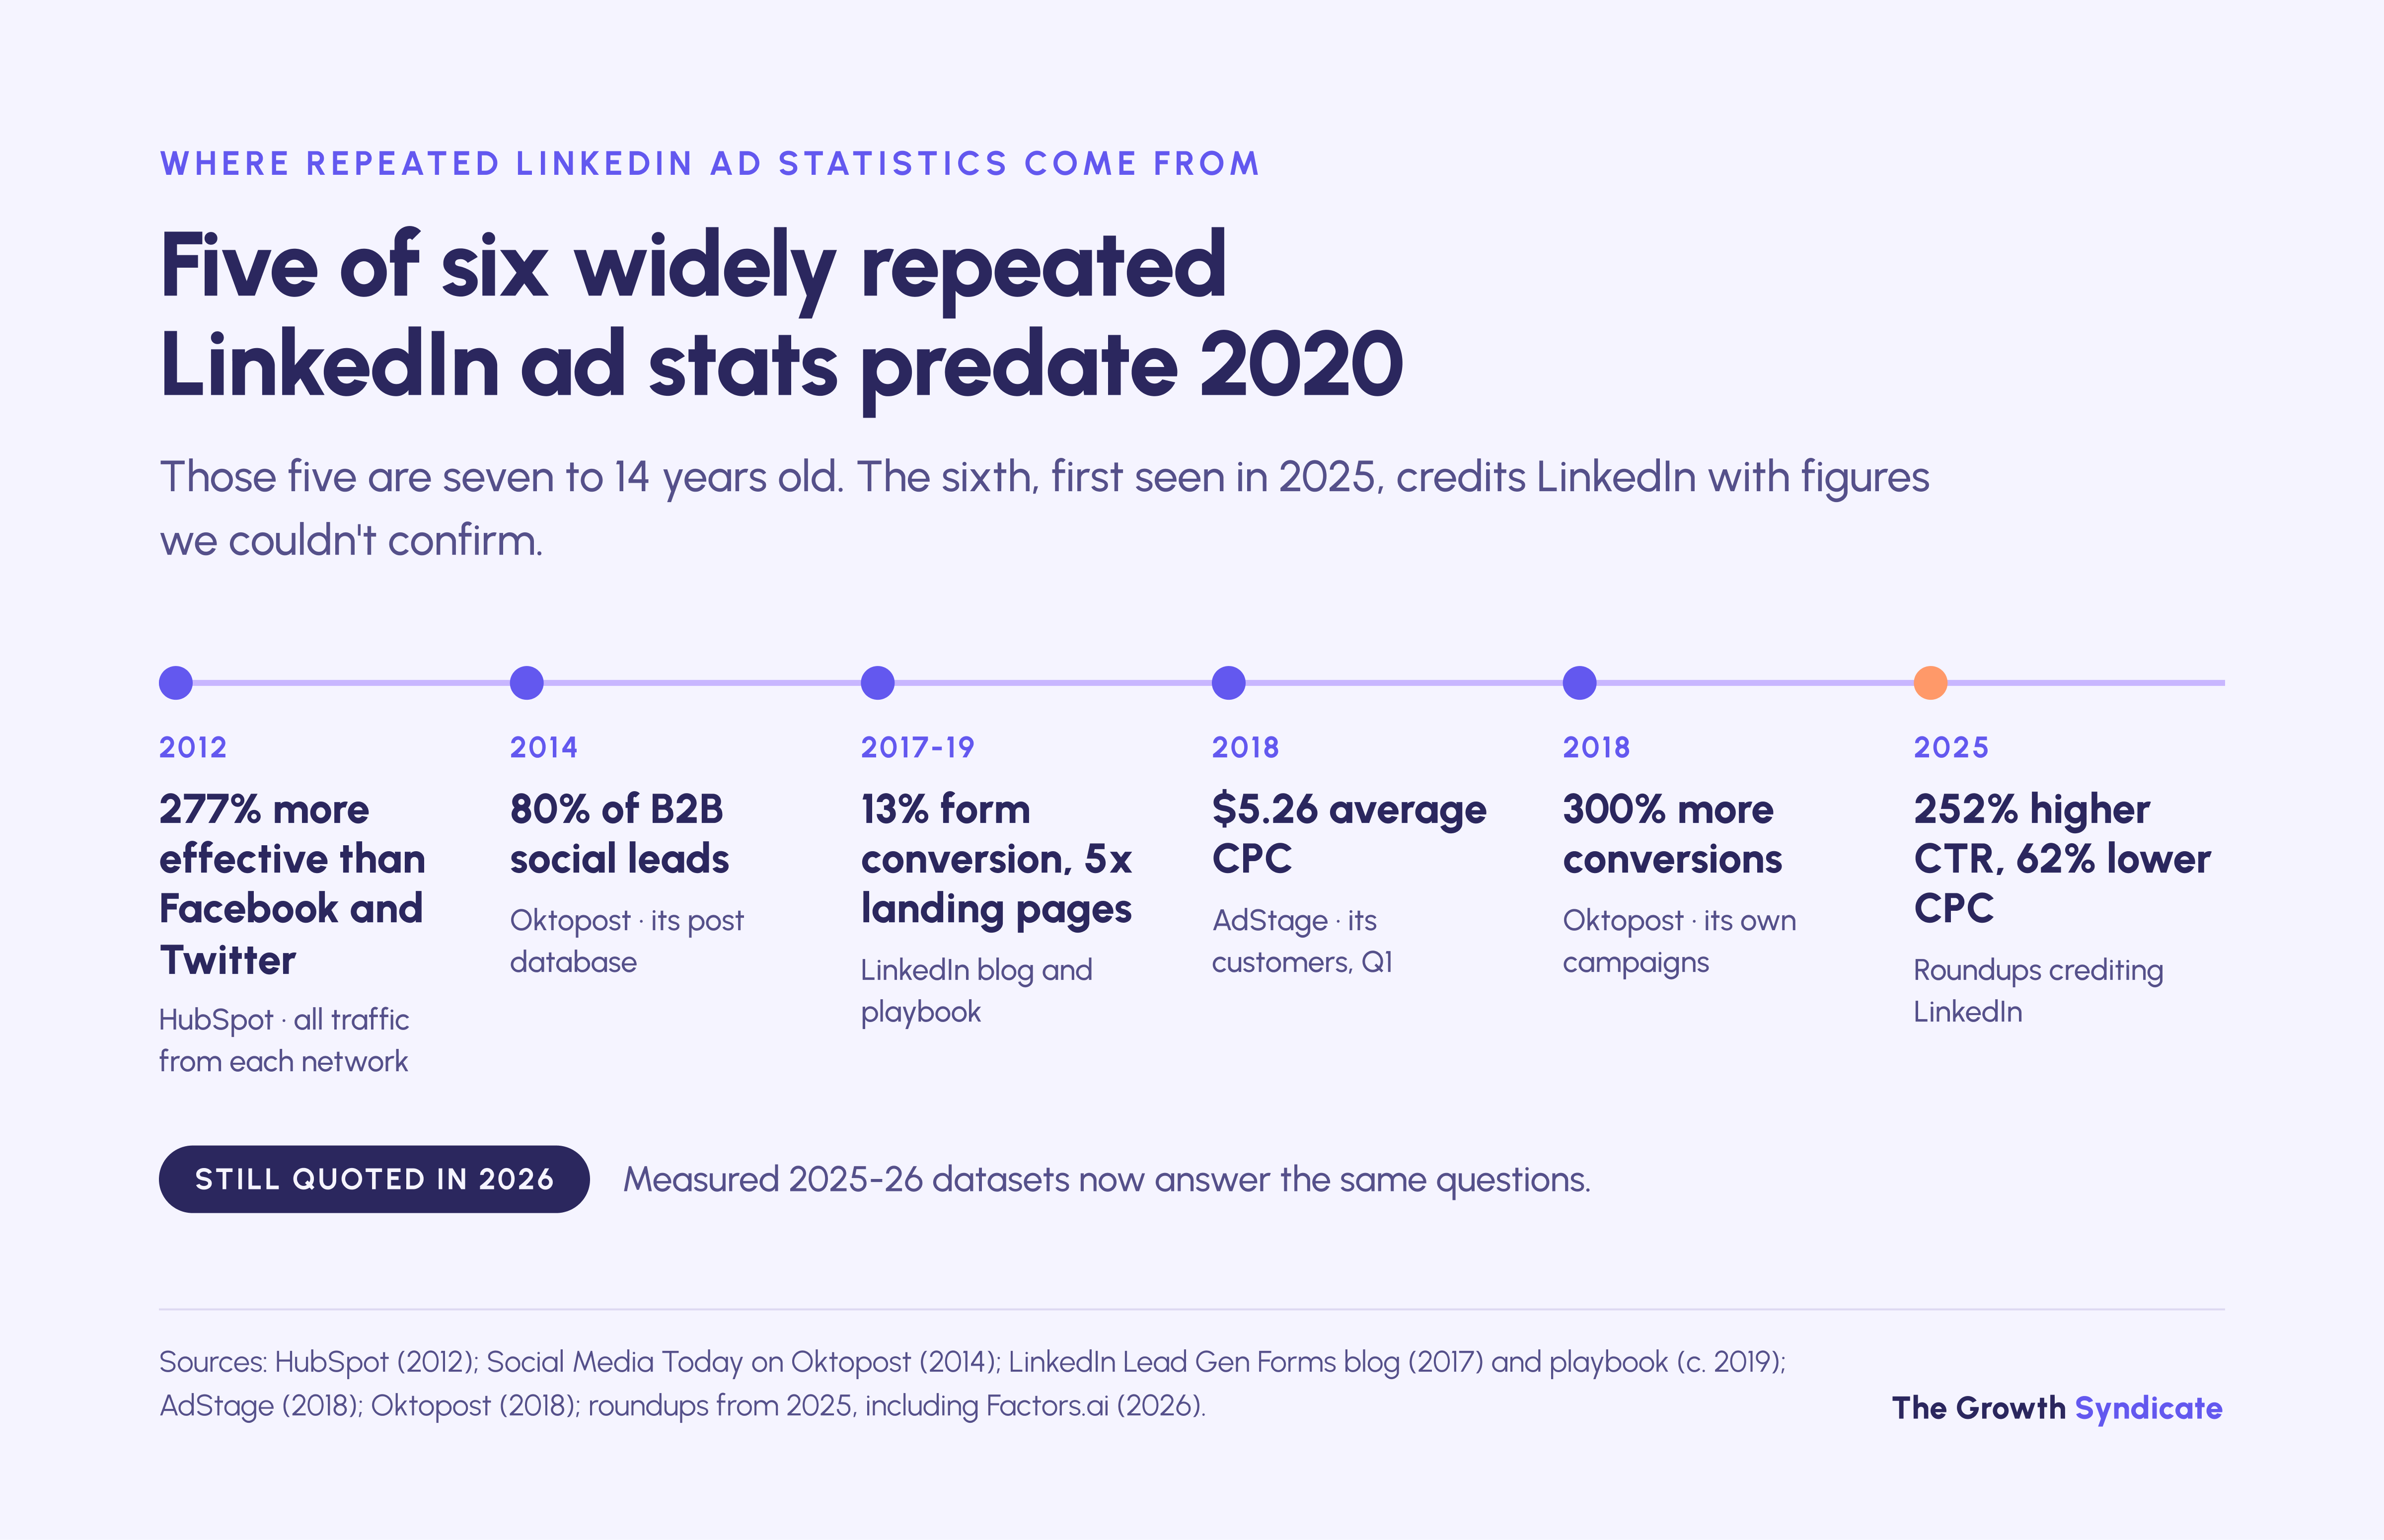
Stop quoting the $5.26 CPC, the 80% share of B2B social leads, the 277% lead-generation advantage and the five-times Lead Gen Form claim. Each one traces to a single vendor or platform source from 2012 to 2019, and most copies have lost both the source and the date. Measured 2025-26 data now answers the same questions.
The 277% figure is close to LinkedIn's 2.74% visitor-to-lead rate measured against the simple average of Facebook's 0.77% and Twitter's 0.69%, from HubSpot's 2012 post. Those were conversion rates for all visitors arriving from each network, not a measure of ad performance.
The 80% figure came from Oktopost's internal database of more than 100,000 posts, reported in March 2014, where most LinkedIn posts and leads came from Group discussions. The networks measured were LinkedIn, Twitter and Google+, not Facebook.
The five-times claim pairs LinkedIn's own 13% form conversion rate with a 2.35% landing-page average from another company's study, which explains the gap better than the form does. Roundups credit the 252% and 62% figures to a LinkedIn blog post, which one roundup words as a 252% increase in clicks and a 62% decrease in cost per click. We couldn't open that post, so we couldn't confirm either figure.
Where do LinkedIn benchmarks break down?
LinkedIn benchmarks break down when your situation differs from the accounts behind them. Every panel on this page comes from accounts connected to a vendor's or agency's tools, and several lean heavily on B2B software companies. Small audiences, thin country samples and brand-awareness objectives all sit outside what the medians describe.
The limits worth knowing before you hold a campaign to any figure here:
- Selection. Advertisers who connect their accounts to Metadata, Kiin Labs or ZenABM are likely to be more sophisticated than average, so the medians probably flatter the typical account.
- Software-heavy samples. HockeyStack's sample is all SaaS companies, and ZenABM describes its own as mostly SaaS. Manufacturing or professional-services buyers can behave differently.
- Small audiences. Below 30,000 people, Kiin Labs measured CPM 32% higher. Audiences under 2,000 cost a median $107.63 per thousand impressions.
- Thin country cells. Outside the US and UK, Kiin Labs' country cells rest on 10 to 60 accounts (cost per lead: 16 in the Netherlands, 10 in Denmark), and ZenABM's Dutch sample is nine companies.
- Objectives. Brand-awareness campaigns are billed and measured differently, and the click and lead benchmarks here don't apply to them.
- Deal size. One-to-one account-based marketing for very large contracts targets so few people that cost per click barely matters; what counts is whether the right ones engage.
How did we verify these figures?
We opened every source we cite on 24 October 2026 and checked each figure against it, noting any page we couldn't open. Grades show how much weight a figure can carry: A for recent primary data with disclosed sample and method, B for primary data with a gap, C for caveated agency data, P for LinkedIn's own claims.
Kiin Labs is graded B because an agency publishes it, although its method is the most detailed here, with medians across accounts, paired within-account comparisons with confidence intervals, and cells under seven accounts withheld (under 10 in its cost report). ZenABM, Dreamdata and HockeyStack are graded B for the gaps listed below.
Where the sources disagree with themselves or each other, this is what we found and how this page handles it.
We refresh this page every quarter and re-check LinkedIn's budget and audience pages each time, because LinkedIn changes formats and minimums often.
Changelog
- October 2026: Page published. All figures checked against their sources on 24 October 2026.
Frequently asked questions
Are LinkedIn ads more expensive than Google Ads?
In Metadata's 2025 data, LinkedIn came out ahead of Google Ads per lead and per dollar of pipeline: a LinkedIn lead cost $202 against $524, and each dollar of LinkedIn lead-gen spend sourced $10.20 of pipeline against $3.95. Dreamdata's 2026 report puts LinkedIn ROAS at 121%, against 67% for Google Search.
What is the 95-5 rule on LinkedIn?
The 95-5 rule comes from research by Professor John Dawes of the Ehrenberg-Bass Institute for LinkedIn's B2B Institute, published in 2021. It estimates that up to 95% of business buyers are out of the market for a given category at any one time, because firms change providers around once every five years on average. Dawes presents it as a heuristic, not a precise rule.
How long do LinkedIn ads take to show results?
Revenue from LinkedIn ads takes most of a year. Dreamdata's 2026 benchmark measured 281 days from a buyer's first LinkedIn ad impression to revenue. Engagement from target accounts and new opportunities show up much earlier, so judge the first two quarters on those, and hold the program to revenue once a full sales cycle has passed.
Can you run LinkedIn ads on $1,000 a month?
You can, but treat $1,000 a month as a test of one audience and one offer. At Kiin Labs' 2025-26 medians, $1,000 buys about 46 US landing-page visits or about three US leads, and about 78 visits or six leads in the UK. That is enough to learn whether the offer works, not to fill a pipeline.
How do I measure ROI on LinkedIn ads?
Measure LinkedIn ROI by joining campaign data to CRM opportunities and reporting pipeline and closed-won revenue per dollar under one stated attribution model. Sourced and influenced models answer different questions, so a figure such as Metadata's sourced $10.20 of pipeline per dollar in 2025 can't be compared with an influenced one. Pick one model and keep it.
Does LinkedIn charge for "see more" clicks?
On engagement campaigns that bill per click, yes. LinkedIn's help documentation lists expanding the intro text, opening the company page, reacting, commenting and following as chargeable clicks, alongside clicks to your landing page. Campaign Manager's average CTR counts all chargeable clicks, so compare it only with benchmarks that count clicks the same way.
Are LinkedIn ads worth it when you sell to small companies?
LinkedIn ads can pay back when you sell to small companies, if the deal value covers the cost. In Metadata's 2025 data, a LinkedIn-sourced customer at a target company with 51-200 employees cost $30,739 in lead-gen spend, at a 20.7% close rate across 29 advertisers, and $1.37 per dollar had already come back in closed-won revenue. Lower-value deals need a cheaper channel.