
Zero-click searches made up 68.01% of US Google searches from January to April 2026, counting every search that ended without a click of any kind, according to SparkToro's analysis of Similarweb panel data. Search volume has not fallen on any published measure, with US desktop searches up 10% between Q1 2024 and Q1 2026; clicks per search fell instead, most where an AI Overview appears. This page lines up the studies and reads them for B2B pipeline.
Last verified: October 2026
Key takeaways
- Two current zero-click figures are both right. Across devices, 68.01% of US Google searches ended with no click in January to April 2026 (SparkToro, modeled device mix); on US desktops, 22.4% did in March 2026 (Datos), which counts follow-up searches separately.
- When Google showed an AI summary, Pew's panel of 900 US adults clicked a traditional search result on 8% of visits, against 15% when it didn't (March 2025).
- Gartner forecast a 25% drop in search engine volume by 2026. Comscore counted 76 billion US desktop searches in Q1 2026, 10% more than two years earlier.
- AI assistants referred 1.08% of website sessions across 1,215 enterprise domains in Conductor's 2025 benchmark, while ChatGPT referrals to B2B sites grew 303% in a year across Demandbase's customers.
- No controlled study links AI search to B2B pipeline yet, and the conversion multiples in circulation (4.4x, 23x) either have no disclosed method or come from a single site.
This page belongs to the same series as our B2B marketing benchmarks and follows the same rule: every figure names its source and sample in the sentence that cites it. Where a report sits behind a form, we name the write-up we read.
Most of the studies come from companies that sell search data or SEO and AI-visibility software, and Google's and OpenAI's user counts are company statements. The Growth Syndicate (TGS), a B2B marketing agency, sells SEO and AI search work, so weigh our reading with that in mind.
AI search and zero-click statistics at a glance
The measured picture in 2026 is fewer clicks per Google search, with no measured fall in the number of searches. Depending on device and definition, 22% to 68% of US searches end without a click, and AI summaries cut clicks to traditional results roughly in half. AI assistants still refer only about 1% of website sessions.
SparkToro's 68.01% and Datos' 22.4% describe the same search engine in the same year and still differ by nearly 46 points, because one counts a follow-up search as a dead end and the other counts it separately (the section on why studies disagree explains the rest). Pew's 8% against 15% is the cleanest measure of what an AI summary does to clicks, because it comes from real users' browsing. Gartner's 25% is the only forecast in the table, and nothing measured since 2024 points its way.
What percentage of Google searches are zero-click?
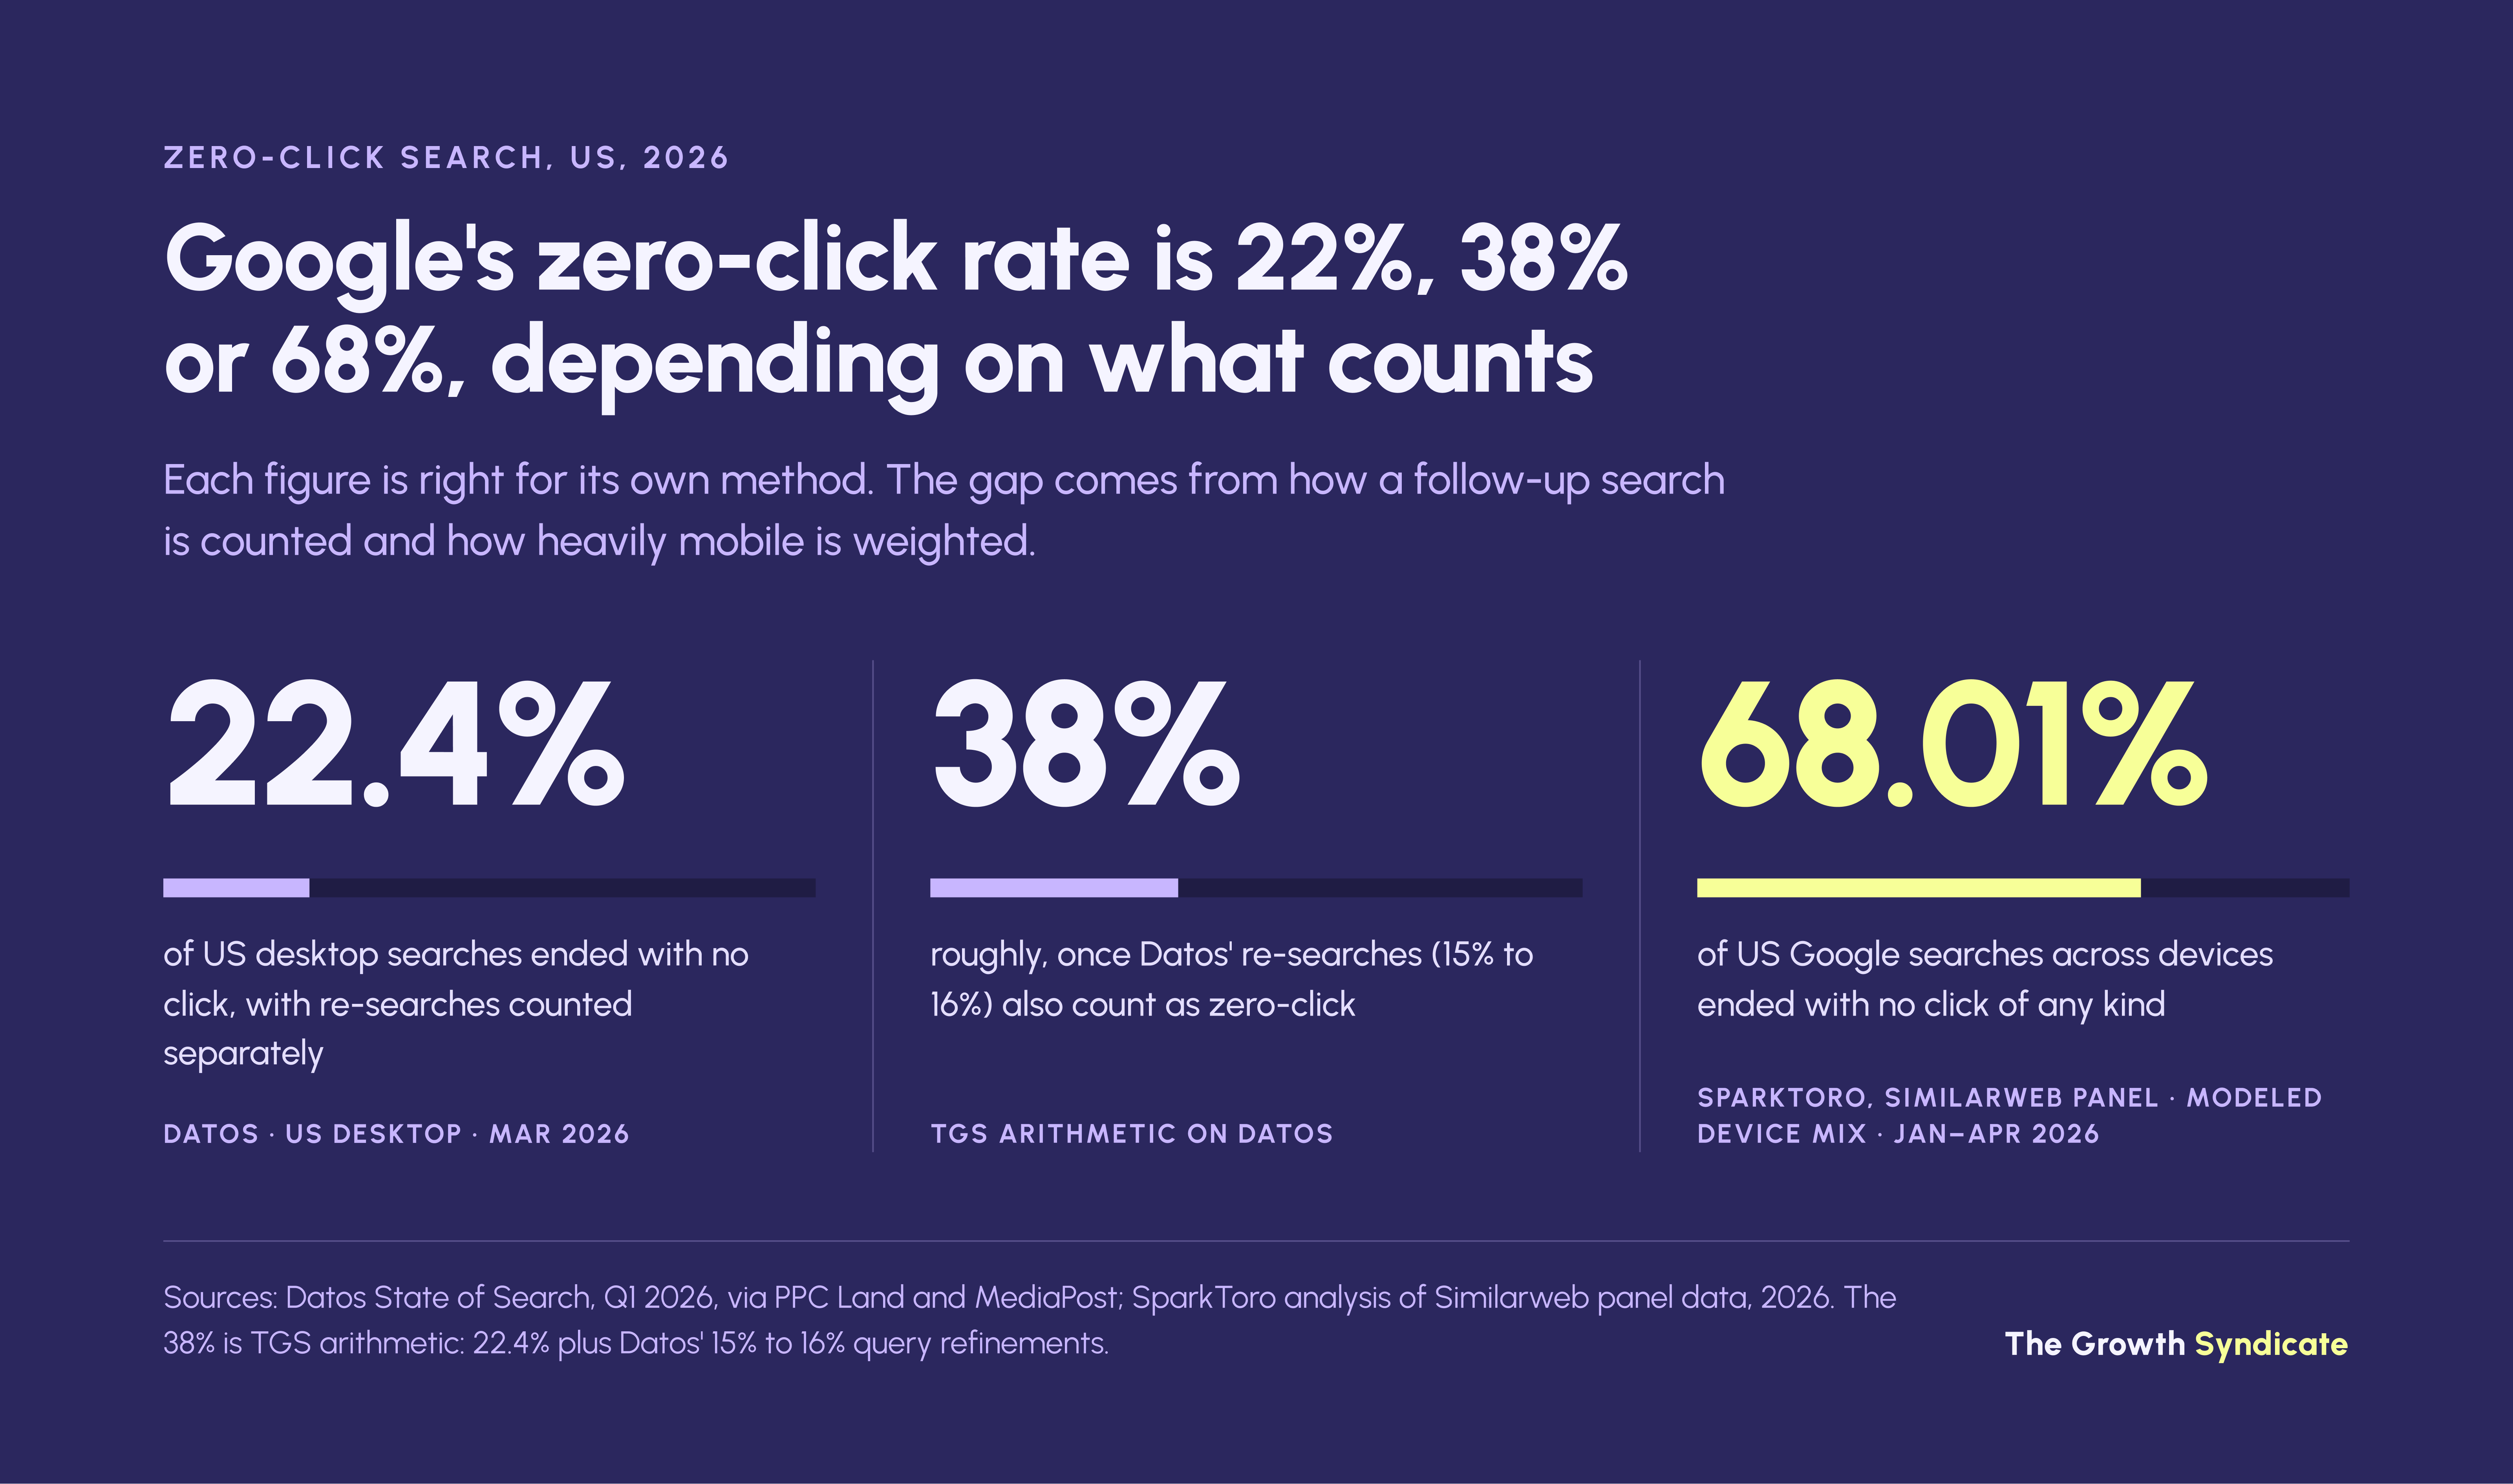
Between 22% and 68% of US Google searches are zero-click, depending on what counts as a click. SparkToro's analysis of Similarweb data puts the all-device share at 68.01% for January to April 2026. Datos measured 22.4% on US desktops in March 2026, but it books a search followed by a new search separately.
A zero-click search is a search that ends without the searcher clicking any result. SparkToro's 2026 study counts clicks on organic links, ads and Google's own properties such as Maps and YouTube as clicks, so its 68.01% is the share of searches with no click at all, and a search followed only by another search counts as zero-click. The figure is often repeated as the share of searches sending no one to the open web, a different measure that would come out higher.
The method matters as much as the definition. Similarweb's panel size isn't disclosed, the device mix is modeled at two-thirds mobile, mobile sessions are treated as ended after 10 seconds of inactivity, and searches inside the Google app are excluded. Only 0.34% of searches in the period went on to AI Mode.
Datos' State of Search report for Q1 2026, which we read through PPC Land and MediaPost because the report sits behind a form, found the share of US desktop searches ending with no click fell from 24.5% in December 2025 to 22.4% in March 2026. Query refinements held at 15% to 16% in their own bucket. Counting them as zero-click puts US desktop at roughly 38% (our arithmetic), still before any mobile weighting.
SparkToro's 2024 study, on Datos panel data from September 2022 to May 2024 (mobile only from January to May 2024, with minimal iPhone coverage), found 58.5% of US and 59.7% of EU Google searches ended in zero clicks. About 37% of searches ended the session and about 22% led to a changed query. Measured against the open web instead, 360 of every 1,000 US searches sent a click to a site outside Google, and 374 in the EU.
The 2026 post compares its figure with 60.45% for 2024 and doesn't say why that differs from the 58.5% SparkToro published at the time. Its own figures point back to 58.5%: searches with at least one click fell 9.51 points, a 22.9% decline, which only works from a 2024 base of about 41.5% (our arithmetic). The two years also come from different panels, so the rise is indicative rather than a like-for-like trend.
Datos' Q2 2026 edition, again read through secondary coverage, reported the share of US desktop searches sending a click to the open web at about 40% in June 2026, the lowest in its dataset (Search Engine Journal). Survey data points the same way. In Bain's December 2024 survey of 1,117 consumers with Dynata, about 80% said they rely on zero-click results in at least 40% of their searches (Bain).
Use 68.01% when you mean all Google searches across devices, with the definition attached. Use Datos when you need desktop behavior or a month-by-month trend. Neither measures B2B queries on their own.
How do AI Overviews affect click-through and SEO?
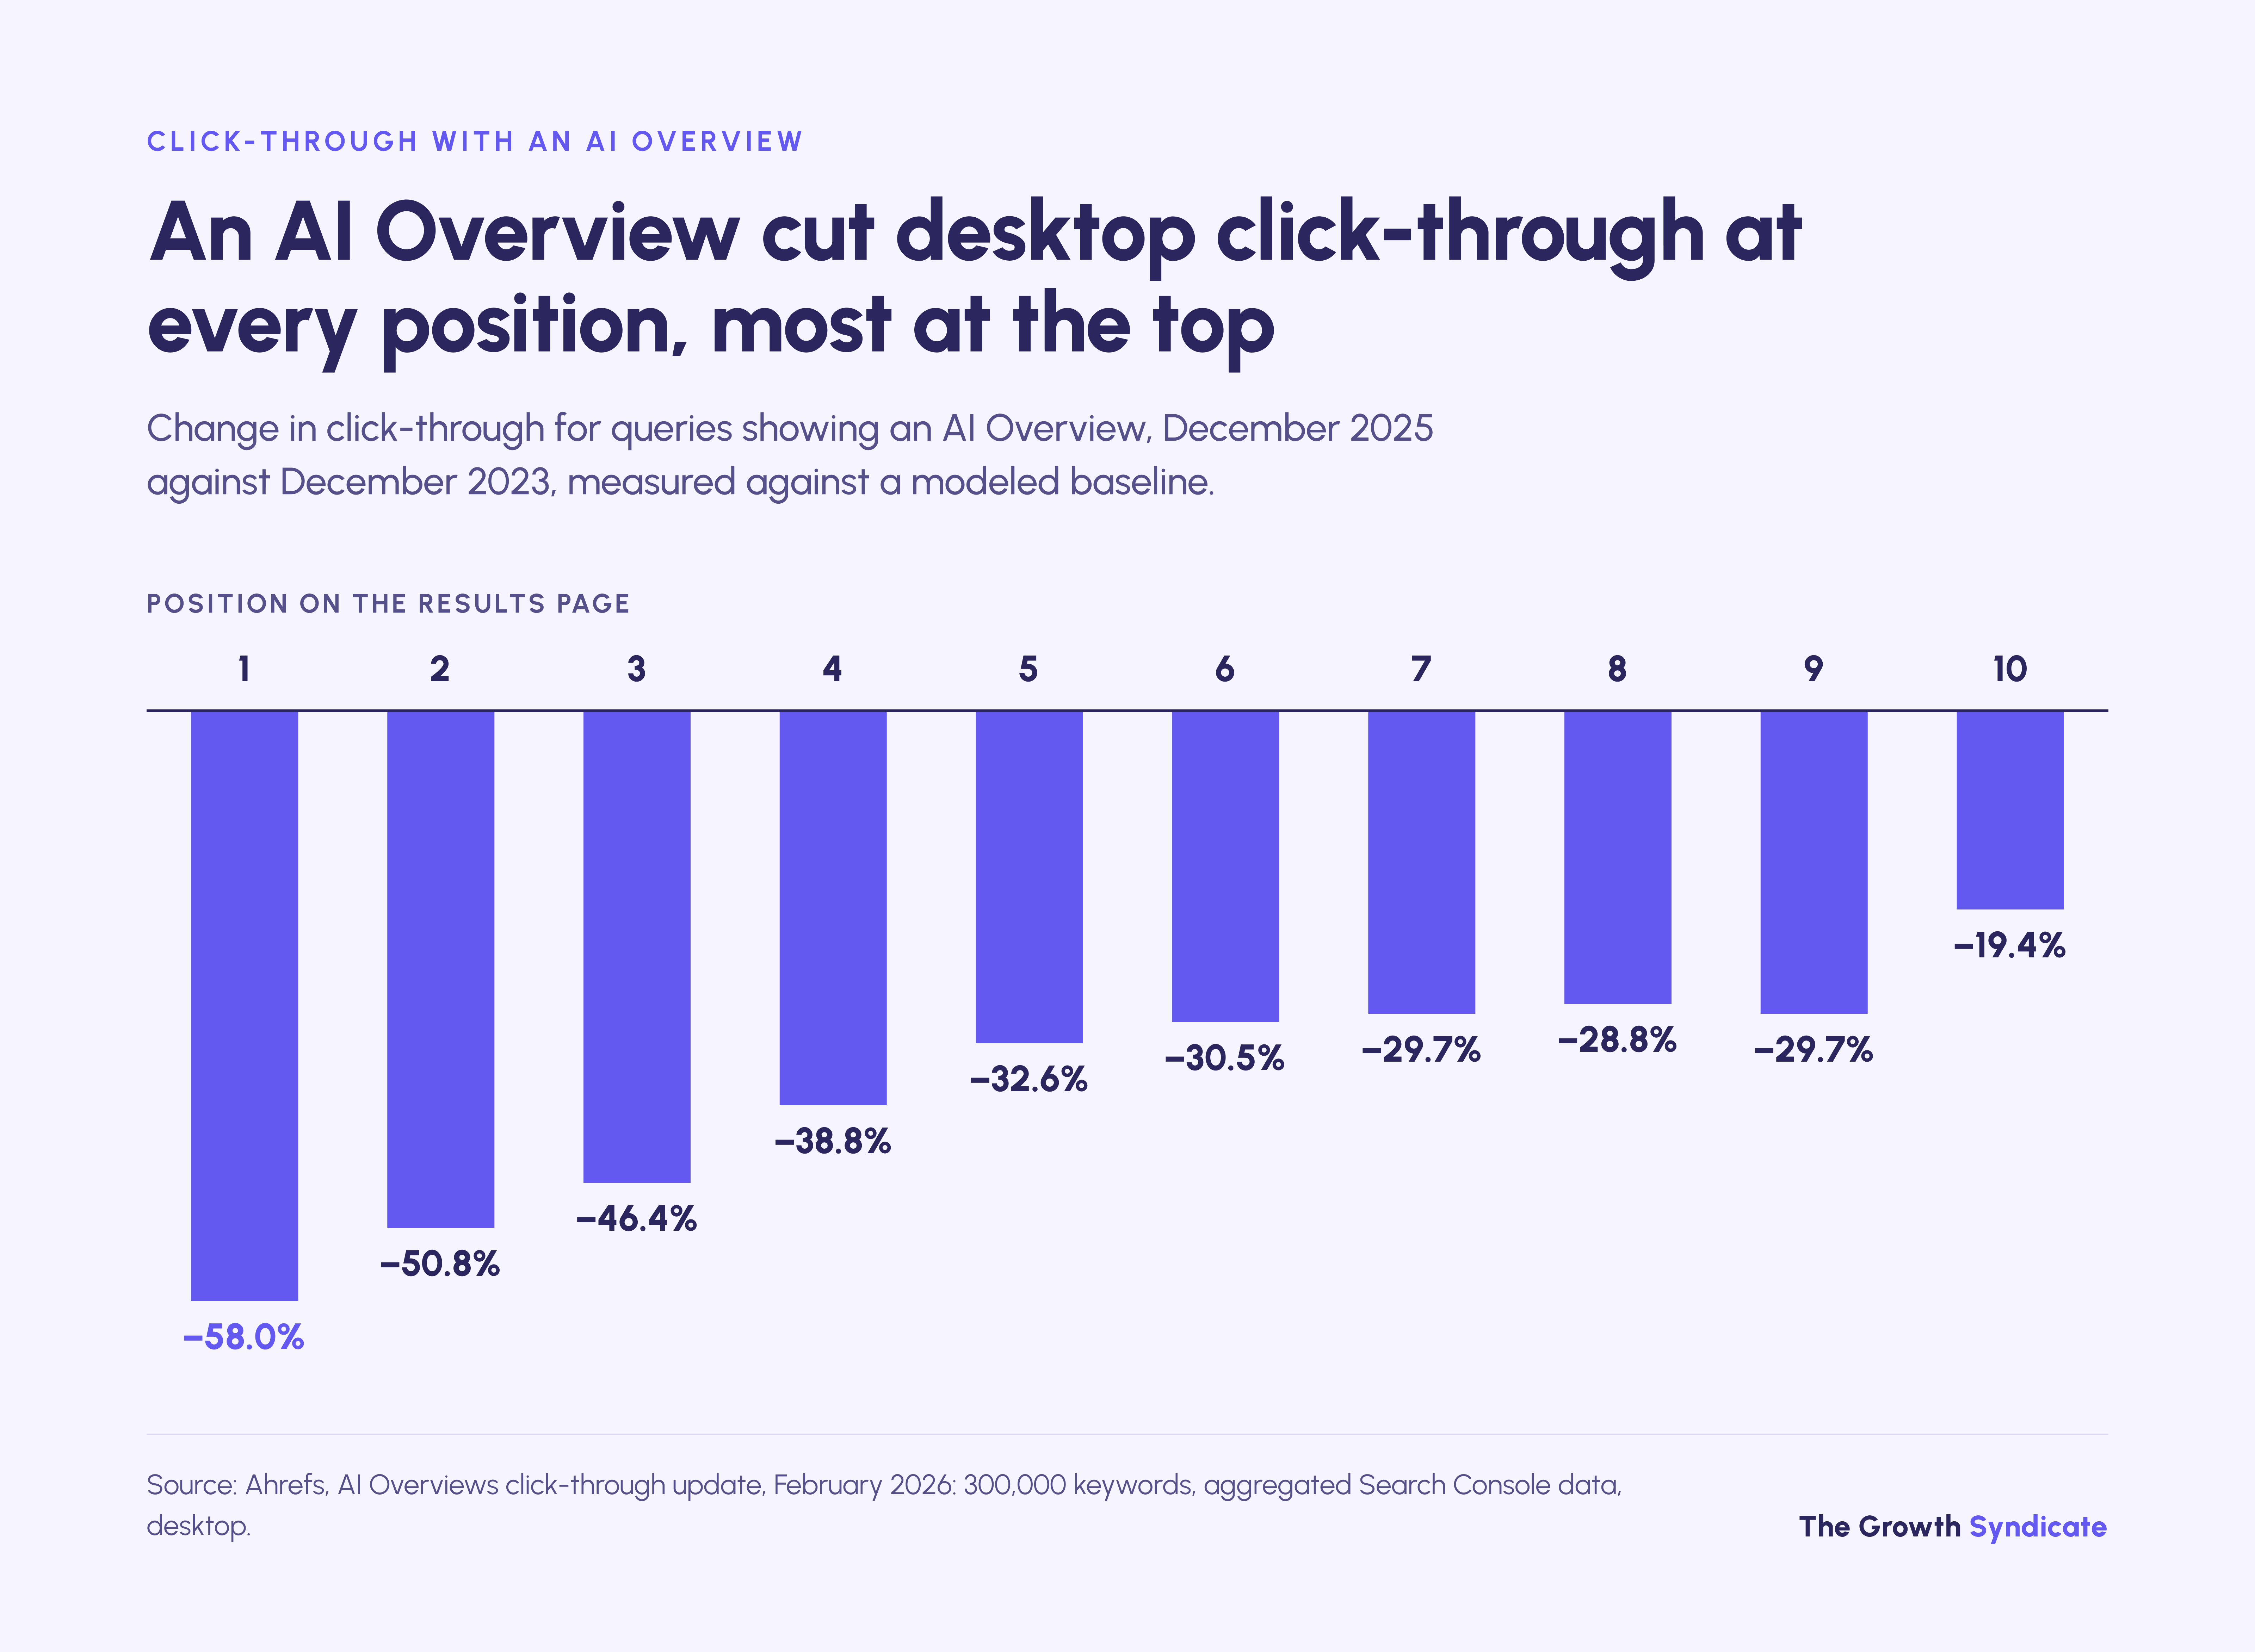
AI Overviews reduce clicks to the results beneath them. In Pew's March 2025 browsing panel, visits with an AI summary led to a click on a traditional result 8% of the time, against 15% without one. Ahrefs' 2026 model puts position-one desktop click-through 58% lower when an Overview appears, though pages cited inside the Overview lose less.
Pew Research Center tracked 900 US adults who shared their browsing data for March 2025, covering 68,879 Google searches. An AI summary appeared on 18% of them. Users clicked a link inside the summary on about 1% of visits, and they ended their browsing session after 26% of pages with a summary, against 16% of pages without one.
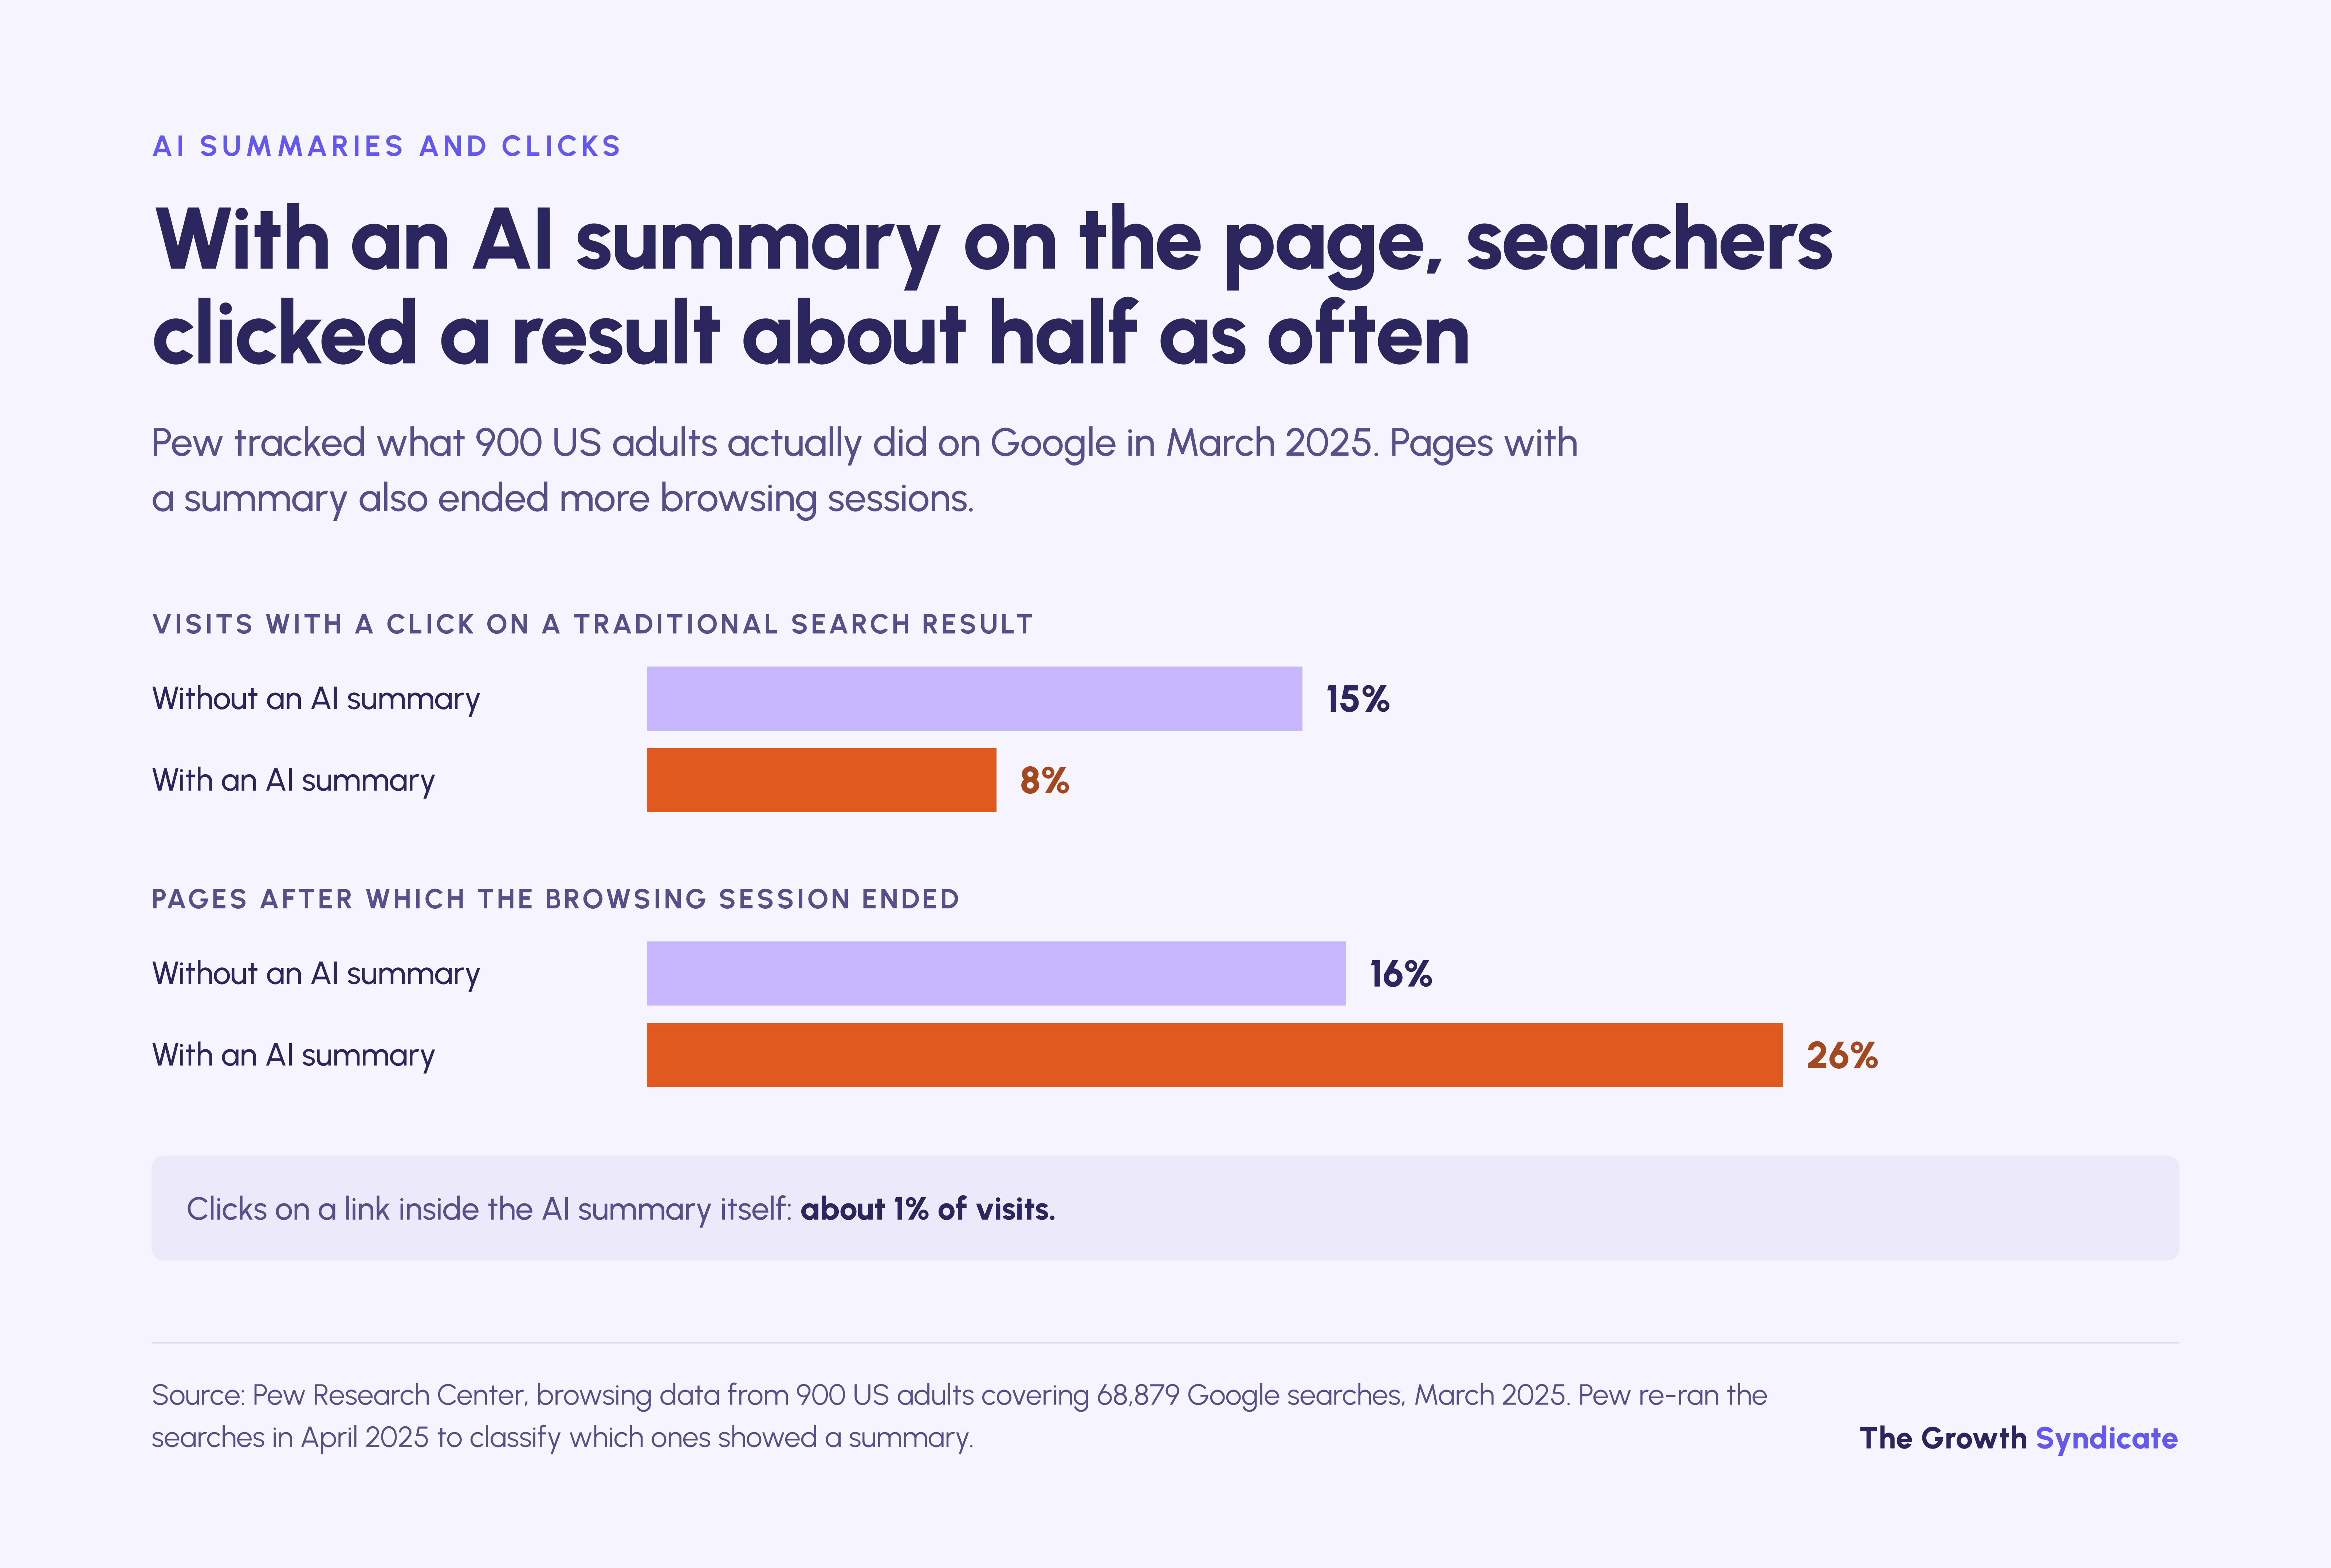
Pew classified which searches showed a summary by re-running them through a scraping service on April 7 to 17, 2025, so the split is a close proxy rather than a record of what each user saw. It is still the only study here built on what real people clicked.
Ahrefs' February 2026 update, vendor research on 300,000 keywords using aggregated Search Console data, compared desktop click-through in December 2023 and December 2025 against a modeled baseline. Position one was 58% lower when an Overview appeared, and positions two to ten fell between 19.4% and 50.8%. The study's April 2025 edition had put the position-one loss at 34.5%.
Seer Interactive, an agency that sells AI search services, analyzed 3,119 queries from 42 client organizations in November 2025 and found organic CTR on queries with an Overview fell from 1.76% in June 2024 to 0.61% in September 2025. Seer states the decline as 61%; its endpoints give about 65%. Paid CTR on the same queries fell from 19.70% to 6.34%.
Seer's April 2026 update, on 5.47 million queries from 53 brands, found organic CTR with an Overview recovering from 1.31% in December 2025 to 2.36% in February 2026. Seer calls that an 85% rise; its table gives about 80%, and the level stays below the 3.82% for queries without an Overview. Seer says it can't claim causation, and the two studies use different cohorts, so they don't form one series.
Do pages cited in AI Overviews keep more clicks?
Pages cited inside an AI Overview keep more of their clicks, in the only data that measures it. In Seer's 2025 client data, brands cited in an Overview earned 35% more organic clicks and 91% more paid clicks than uncited ones. In its 2026 update, cited results drew about 120% more organic clicks per impression on informational queries.
Both figures are correlational, and the 120% covers informational queries across 2025 rather than the December to February comparison above. Cited results still drew 38% fewer clicks than results on queries with no Overview in Seer's data. Being cited limits the loss; it doesn't restore the old click-through.
These studies cover informational and mixed query sets, and Ahrefs' figure is desktop only. None of them isolates the queries B2B buyers type when they compare vendors.
How often do AI Overviews appear?
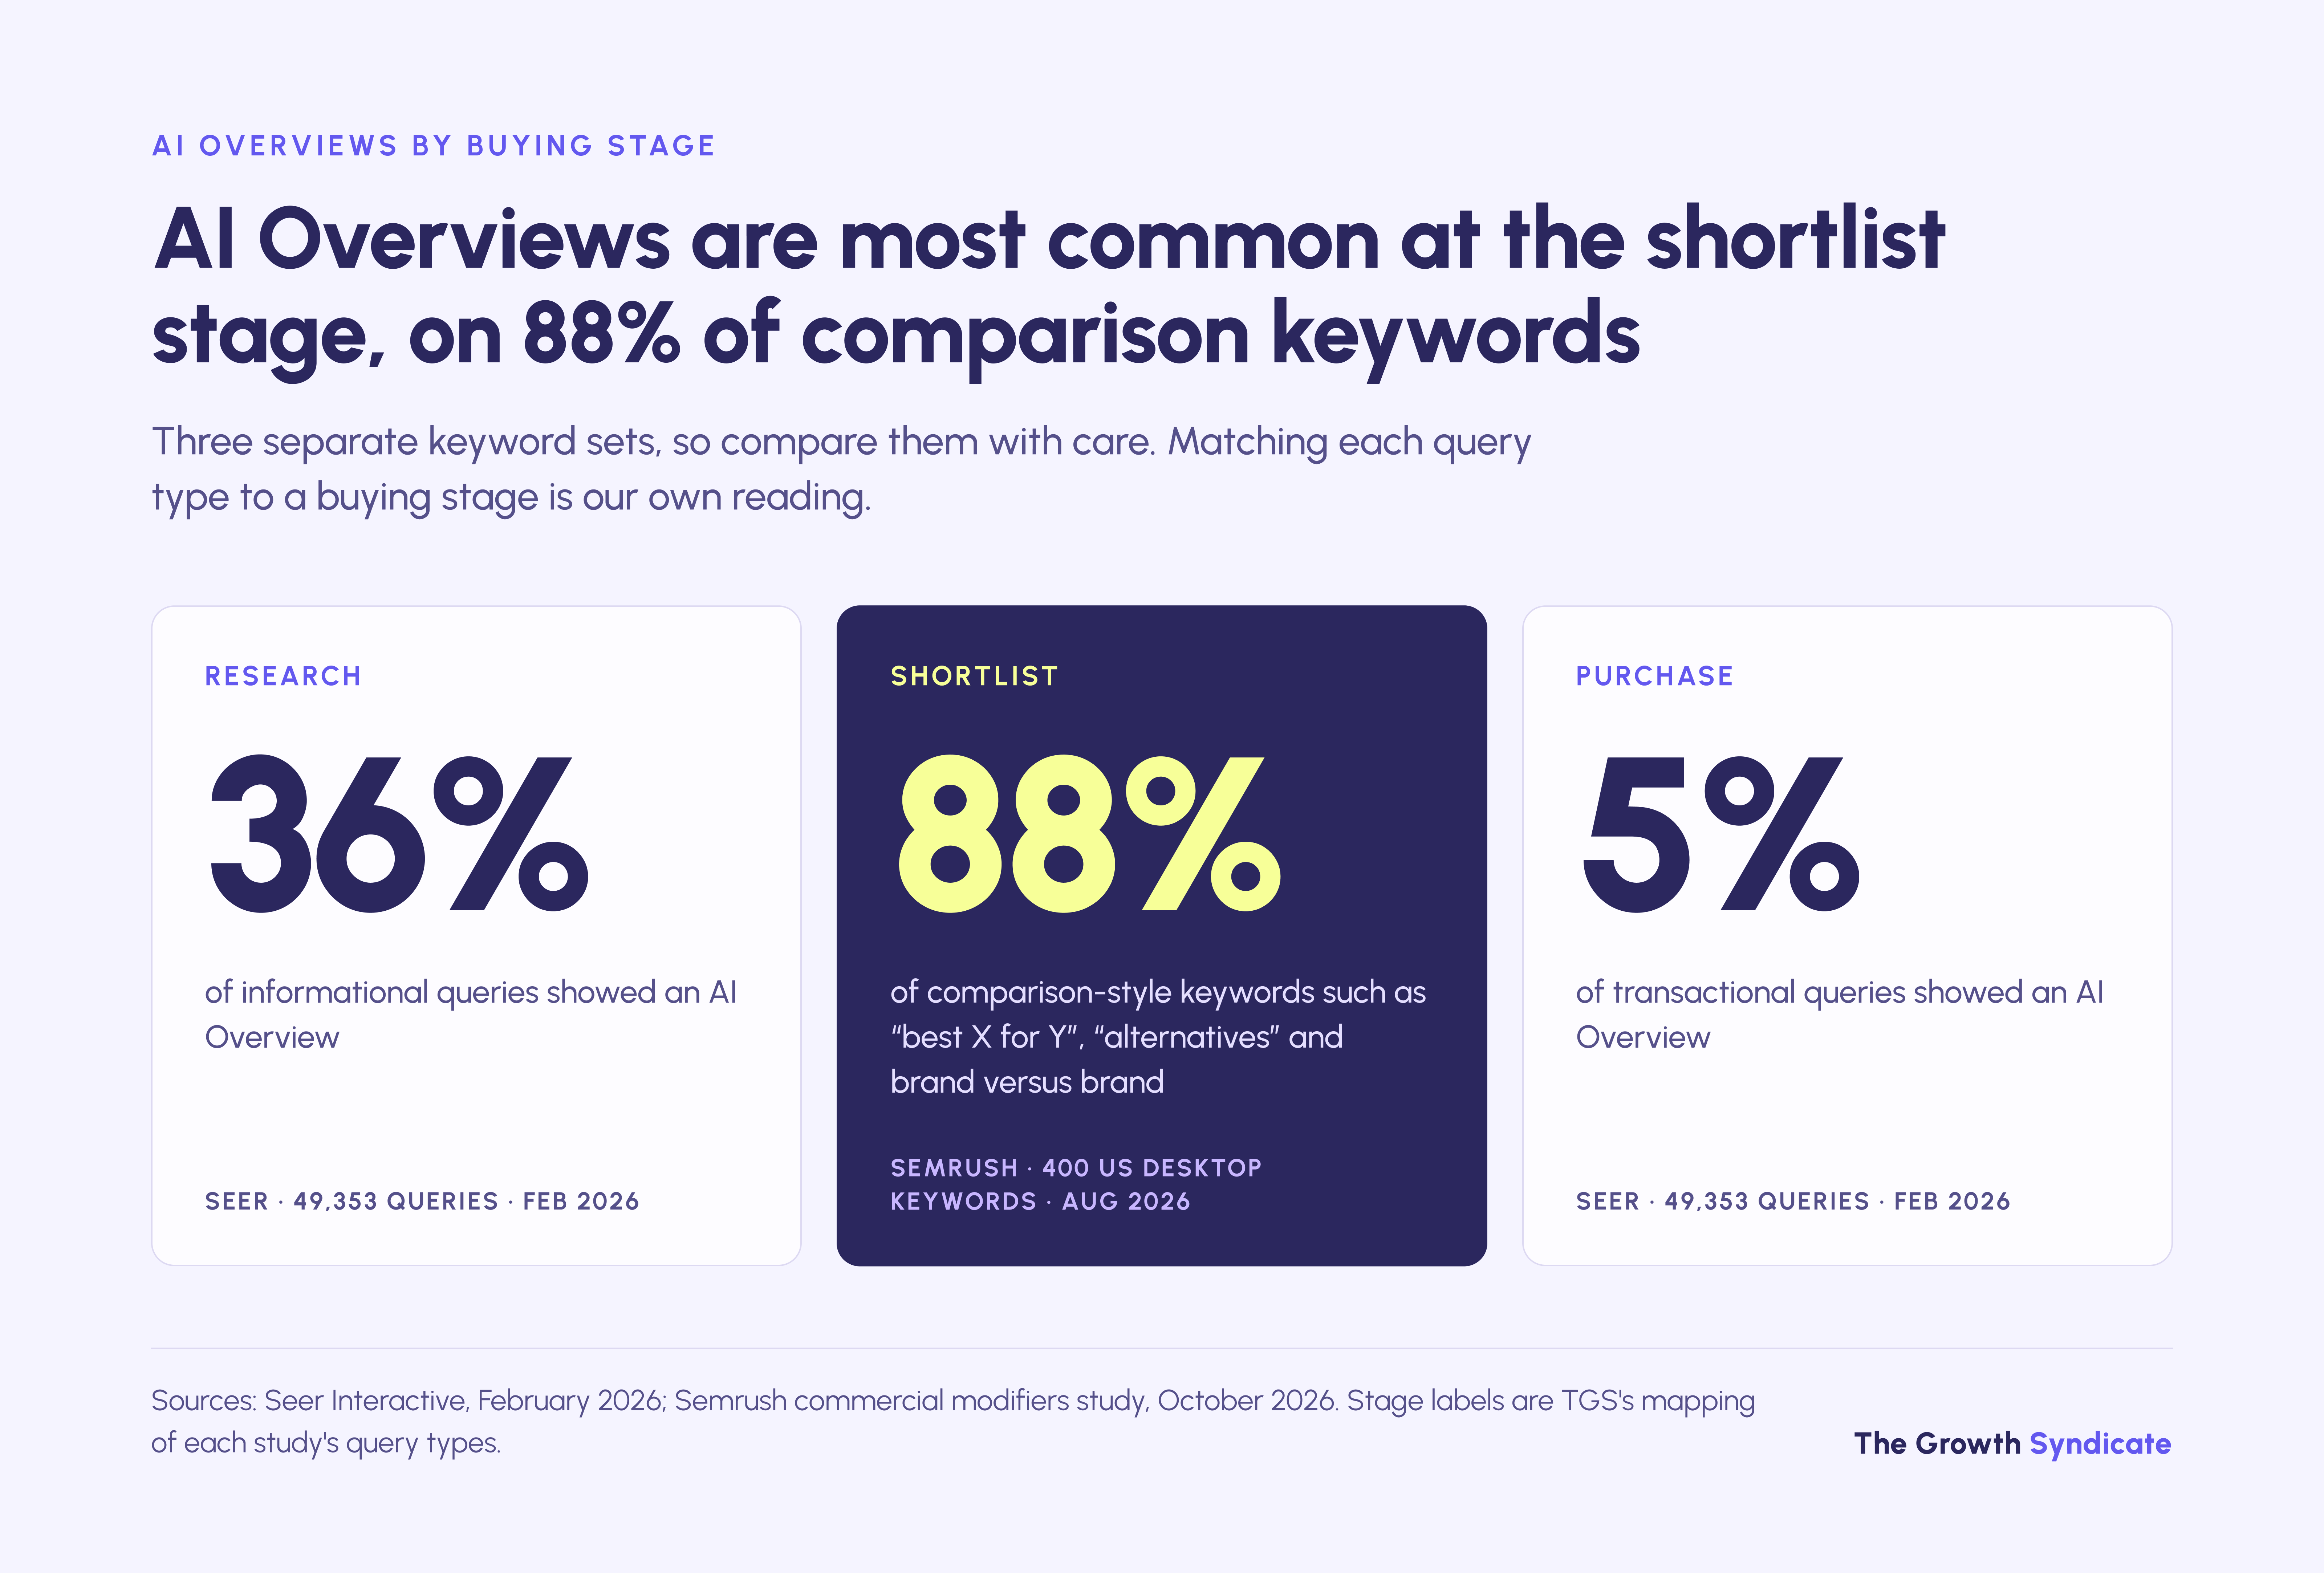
AI Overviews appeared on 25.11% of US searches in Conductor's late-2025 index and on 48% of the queries BrightEdge tracked by February 2026. Intent moves the rate more than anything else: in Seer's February 2026 data they showed on 36% of informational queries and 5% of transactional ones.
Conductor's 2026 AEO/GEO benchmarks, vendor research, checked about 21.9 million unique US searches in its own index between September 15 and October 12, 2025, and found an Overview on 5.5 million of them. That is a share of distinct keywords, not of the searches people actually run. BrightEdge, another vendor, measured presence rising from roughly 30% to 48% of its tracked queries across nine industries over the year to February 2026, without disclosing how many keywords it tracks.
Seer's intent figures come from a separate set of 49,353 client-chosen queries in February 2026: 36% of informational, 8% of commercial and 5% of transactional queries showed an Overview. Seer also reports 95.4% for "X vs Y" comparison queries, but that figure covers 280 queries matched by text pattern inside the informational set, so it isn't an intent class of its own.
Commercial queries are where the estimates move fastest. Semrush's October 2026 study, vendor research, tracked a fixed panel of 400 US desktop keywords built on modifiers such as "best X for Y", "alternatives", "reviews", "price" and brand-versus-brand, in banking, ecommerce and software. Overview coverage rose from 45.75% in September 2025 to 88% in August 2026, and to 97.08% when weighted by search volume.
An earlier Semrush study of 600,000+ US desktop keywords found the share of commercial-intent results pages with an Overview grew 71% on average between November 2025 and April 2026, while the transactional share fell 5%. Finance grew fastest, at 231.25%. Those are relative changes, and the study doesn't publish the starting or ending shares.
Prevalence estimates differ mainly because of the keyword set. A client's tracked keywords, a vendor's index and a hand-picked panel each over-represent different intents, and weighting by keyword or by search volume moves the answer by nine points in Semrush's own panel. Device and month matter too, and every figure in this section is desktop or unstated.
Did AI reduce Google search volume?
No measured data shows Google search volume falling, despite Gartner's February 2024 forecast that traditional search engine volume would drop 25% by 2026. Comscore counted 76 billion US desktop searches in Q1 2026, 10% more than in Q1 2024, and Datos measured searches per US desktop searcher rising. Nobody has published an all-device series.
Gartner's prediction came with no published method; it draws on a report available only to Gartner clients. Its horizon is the end of 2026, so the window hasn't closed, but no measured series published since points toward it.
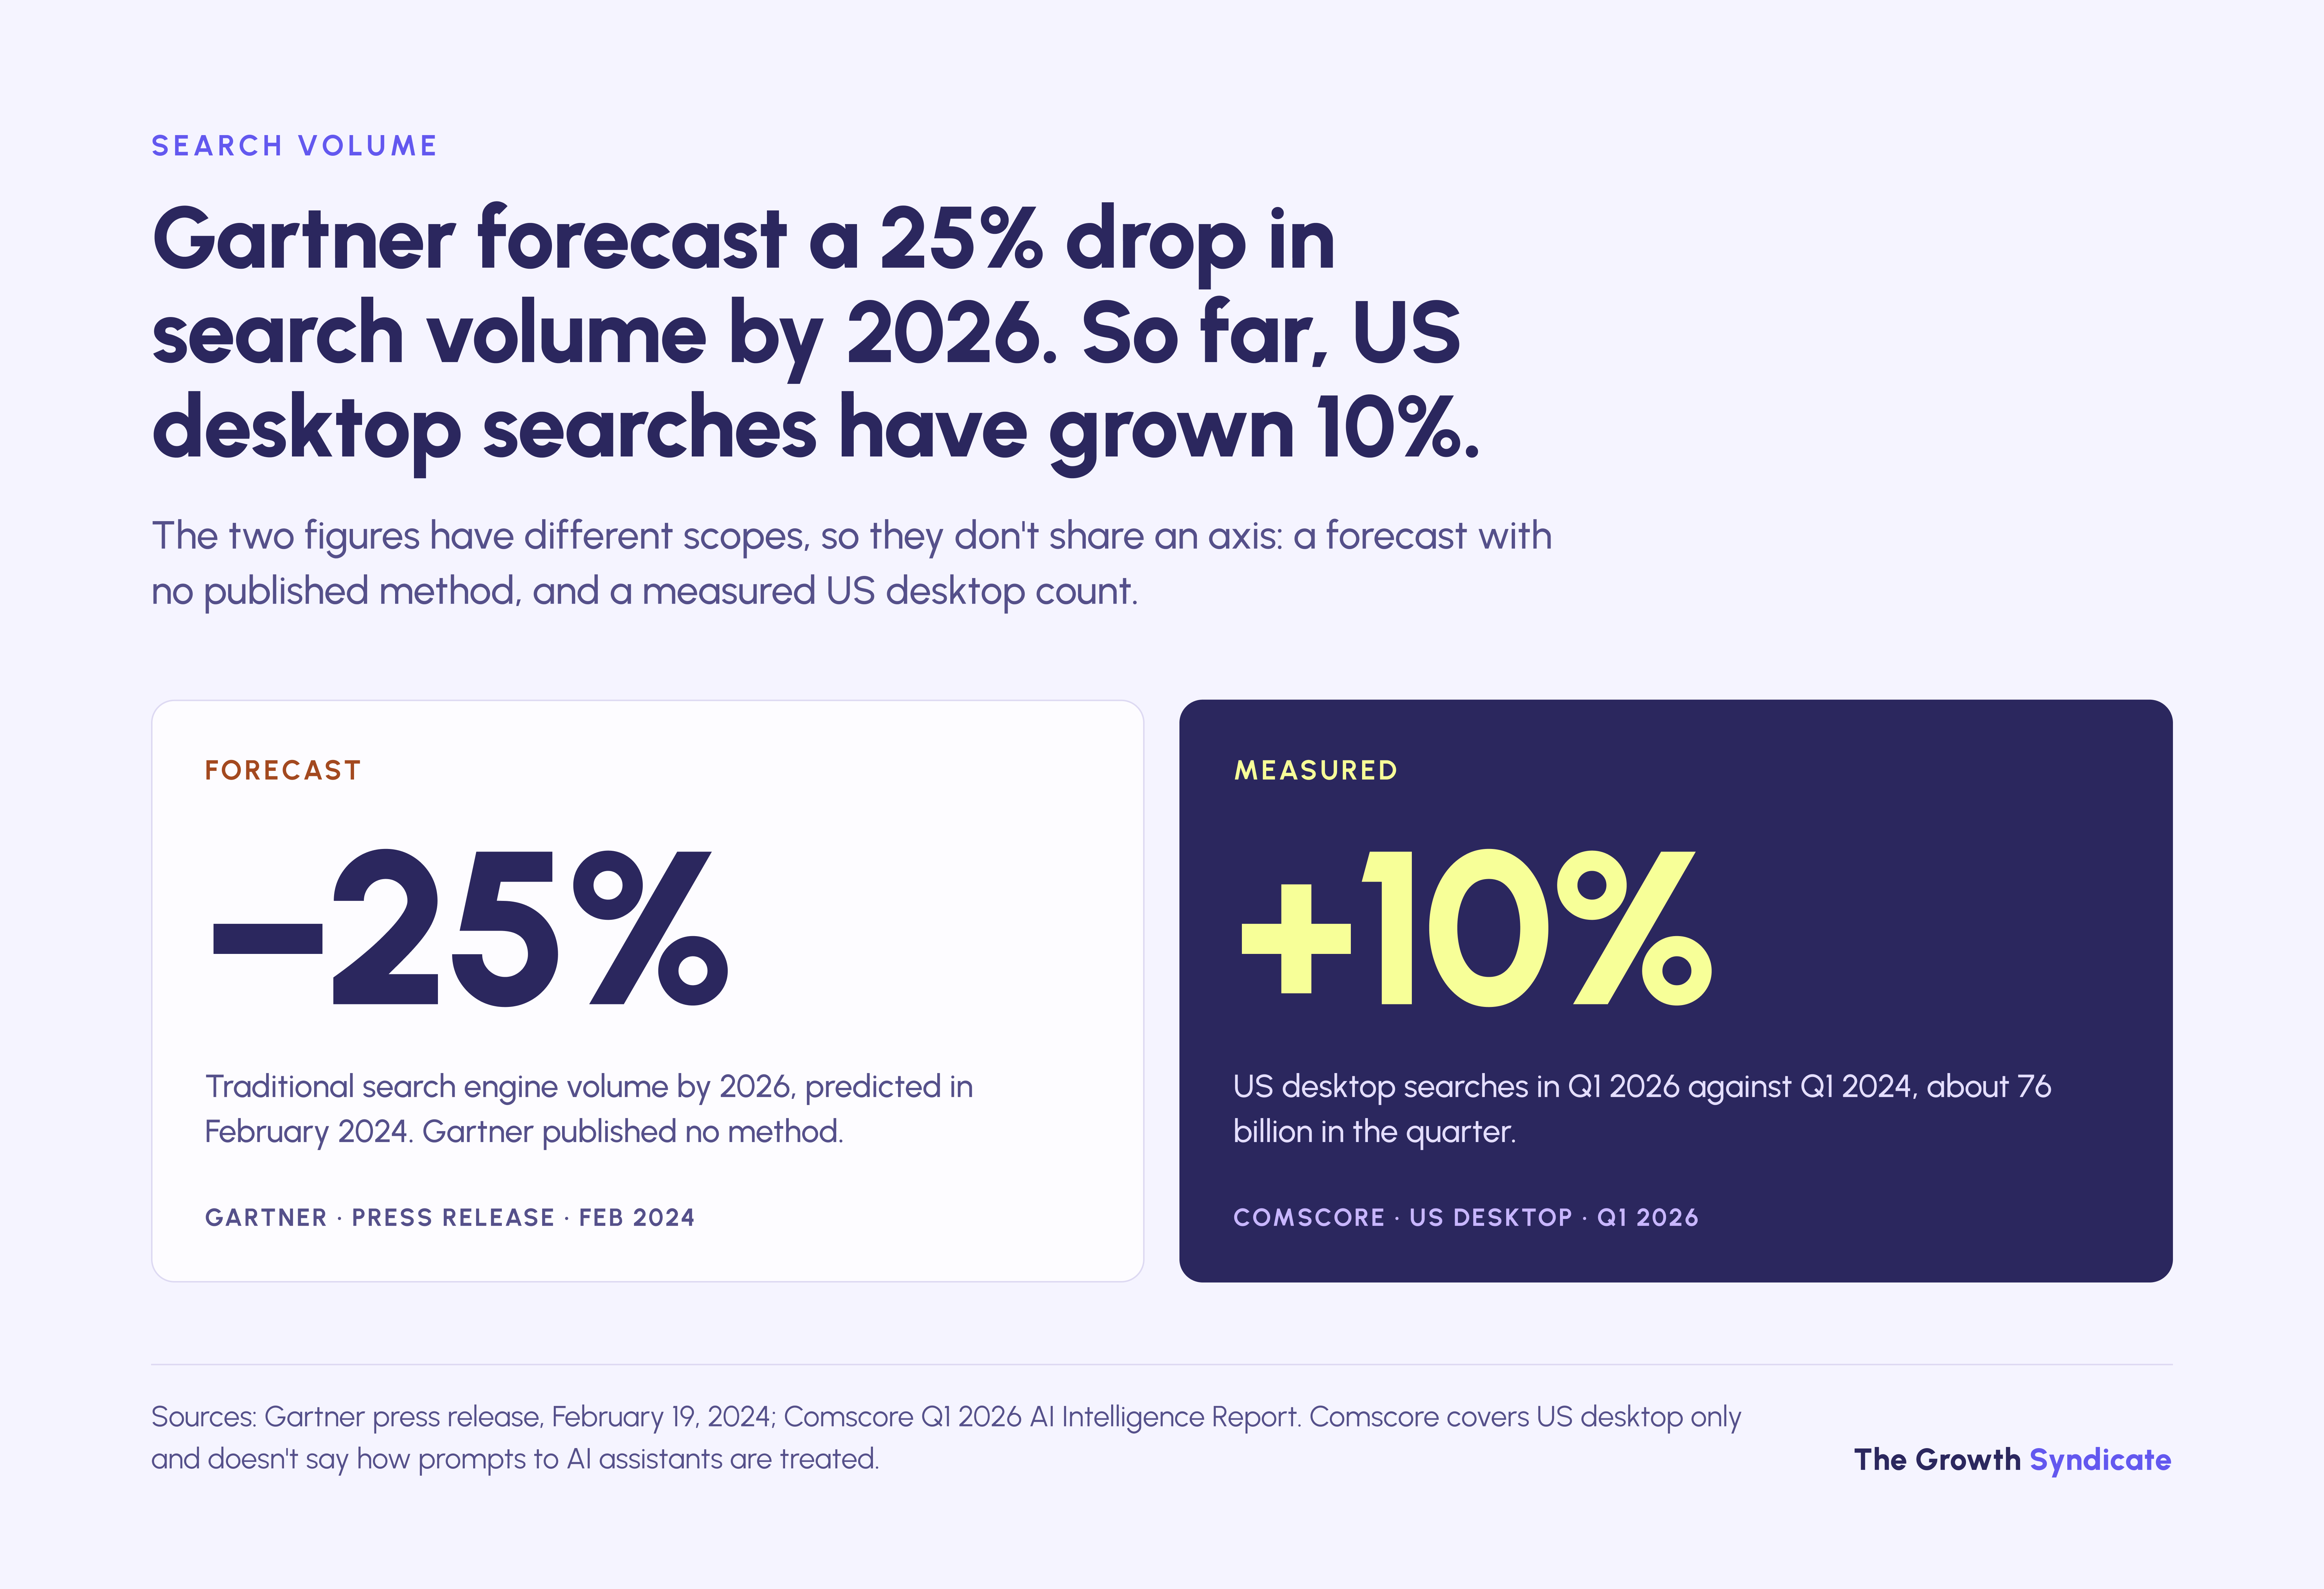
Comscore's Q1 2026 AI Intelligence Report covers US desktop only, and the release doesn't say how prompts to AI assistants are treated or how large the panel is. SparkToro found Google searches per US desktop searcher grew 21.64% in 2024 on Datos panel data (SparkToro), a per-searcher measure rather than total volume. Datos' Q1 2026 report put searches per US desktop searcher at 102.5 in March 2026, up from 95.3 in December 2025.
Alphabet's Q1 2026 remarks said queries were at an all-time high, and its Q2 2026 remarks said AI Mode, like AI Overviews, "is driving an incremental increase in Search queries overall". On October 28, 2026, its Q3 remarks put year-over-year query growth at "the highest it's been in the last five years". All three are company statements that agree in direction but give no query counts or growth rates.
AI tools remain small next to search. In Datos' panel they accounted for 1.65% of all US desktop activity in Q1 2026, up from 1.31% a year earlier, and about 1.83% in Q2, while Google held 94.3% of US desktop search in March 2026. That share figure counts every desktop event, so it compares AI tools with all web activity rather than with searches alone.
Adoption rarely runs in a straight line, and AI answers may settle the same way: heavy use for some questions, while search and vendor sites keep others.

Every series in this section measures desktop or comes from Google itself. Mobile search volume, where most searches happen, has no published measured series, so the honest claim is no measured decline rather than measured growth on every device.
How many people use AI search, and what is its market share?
About half of US adults have used an AI chatbot, and 60% have read AI summaries in Google results, in Pew's February 2026 survey of 5,119 adults. Company counts run larger: Google reports more than 2.5 billion monthly users of AI Overviews, and OpenAI more than 1 billion weekly users of ChatGPT. Google still handles about 94% of US desktop search.
Pew's 2026 survey found 49% of US adults have ever used an AI chatbot, 44% have used ChatGPT, and 42% use chatbots to search for information. All three are "ever use" measures; about 24% use a chatbot daily. Pew changed its question wording from 2024, when 33% reported using chatbots, so the trend is approximate.
Google announced the AI Overviews and AI Mode figures at I/O 2026, where it put the Gemini app above 900 million monthly users; by its Q3 remarks in October 2026, the app had reached 1 billion. OpenAI reported more than 900 million weekly active users and more than 50 million consumer subscribers in February 2026 (OpenAI), then more than 1 billion weekly active ChatGPT users in its August 2026 ads announcement. None of these counts is audited, and Google counts monthly users while OpenAI counts weekly ones.
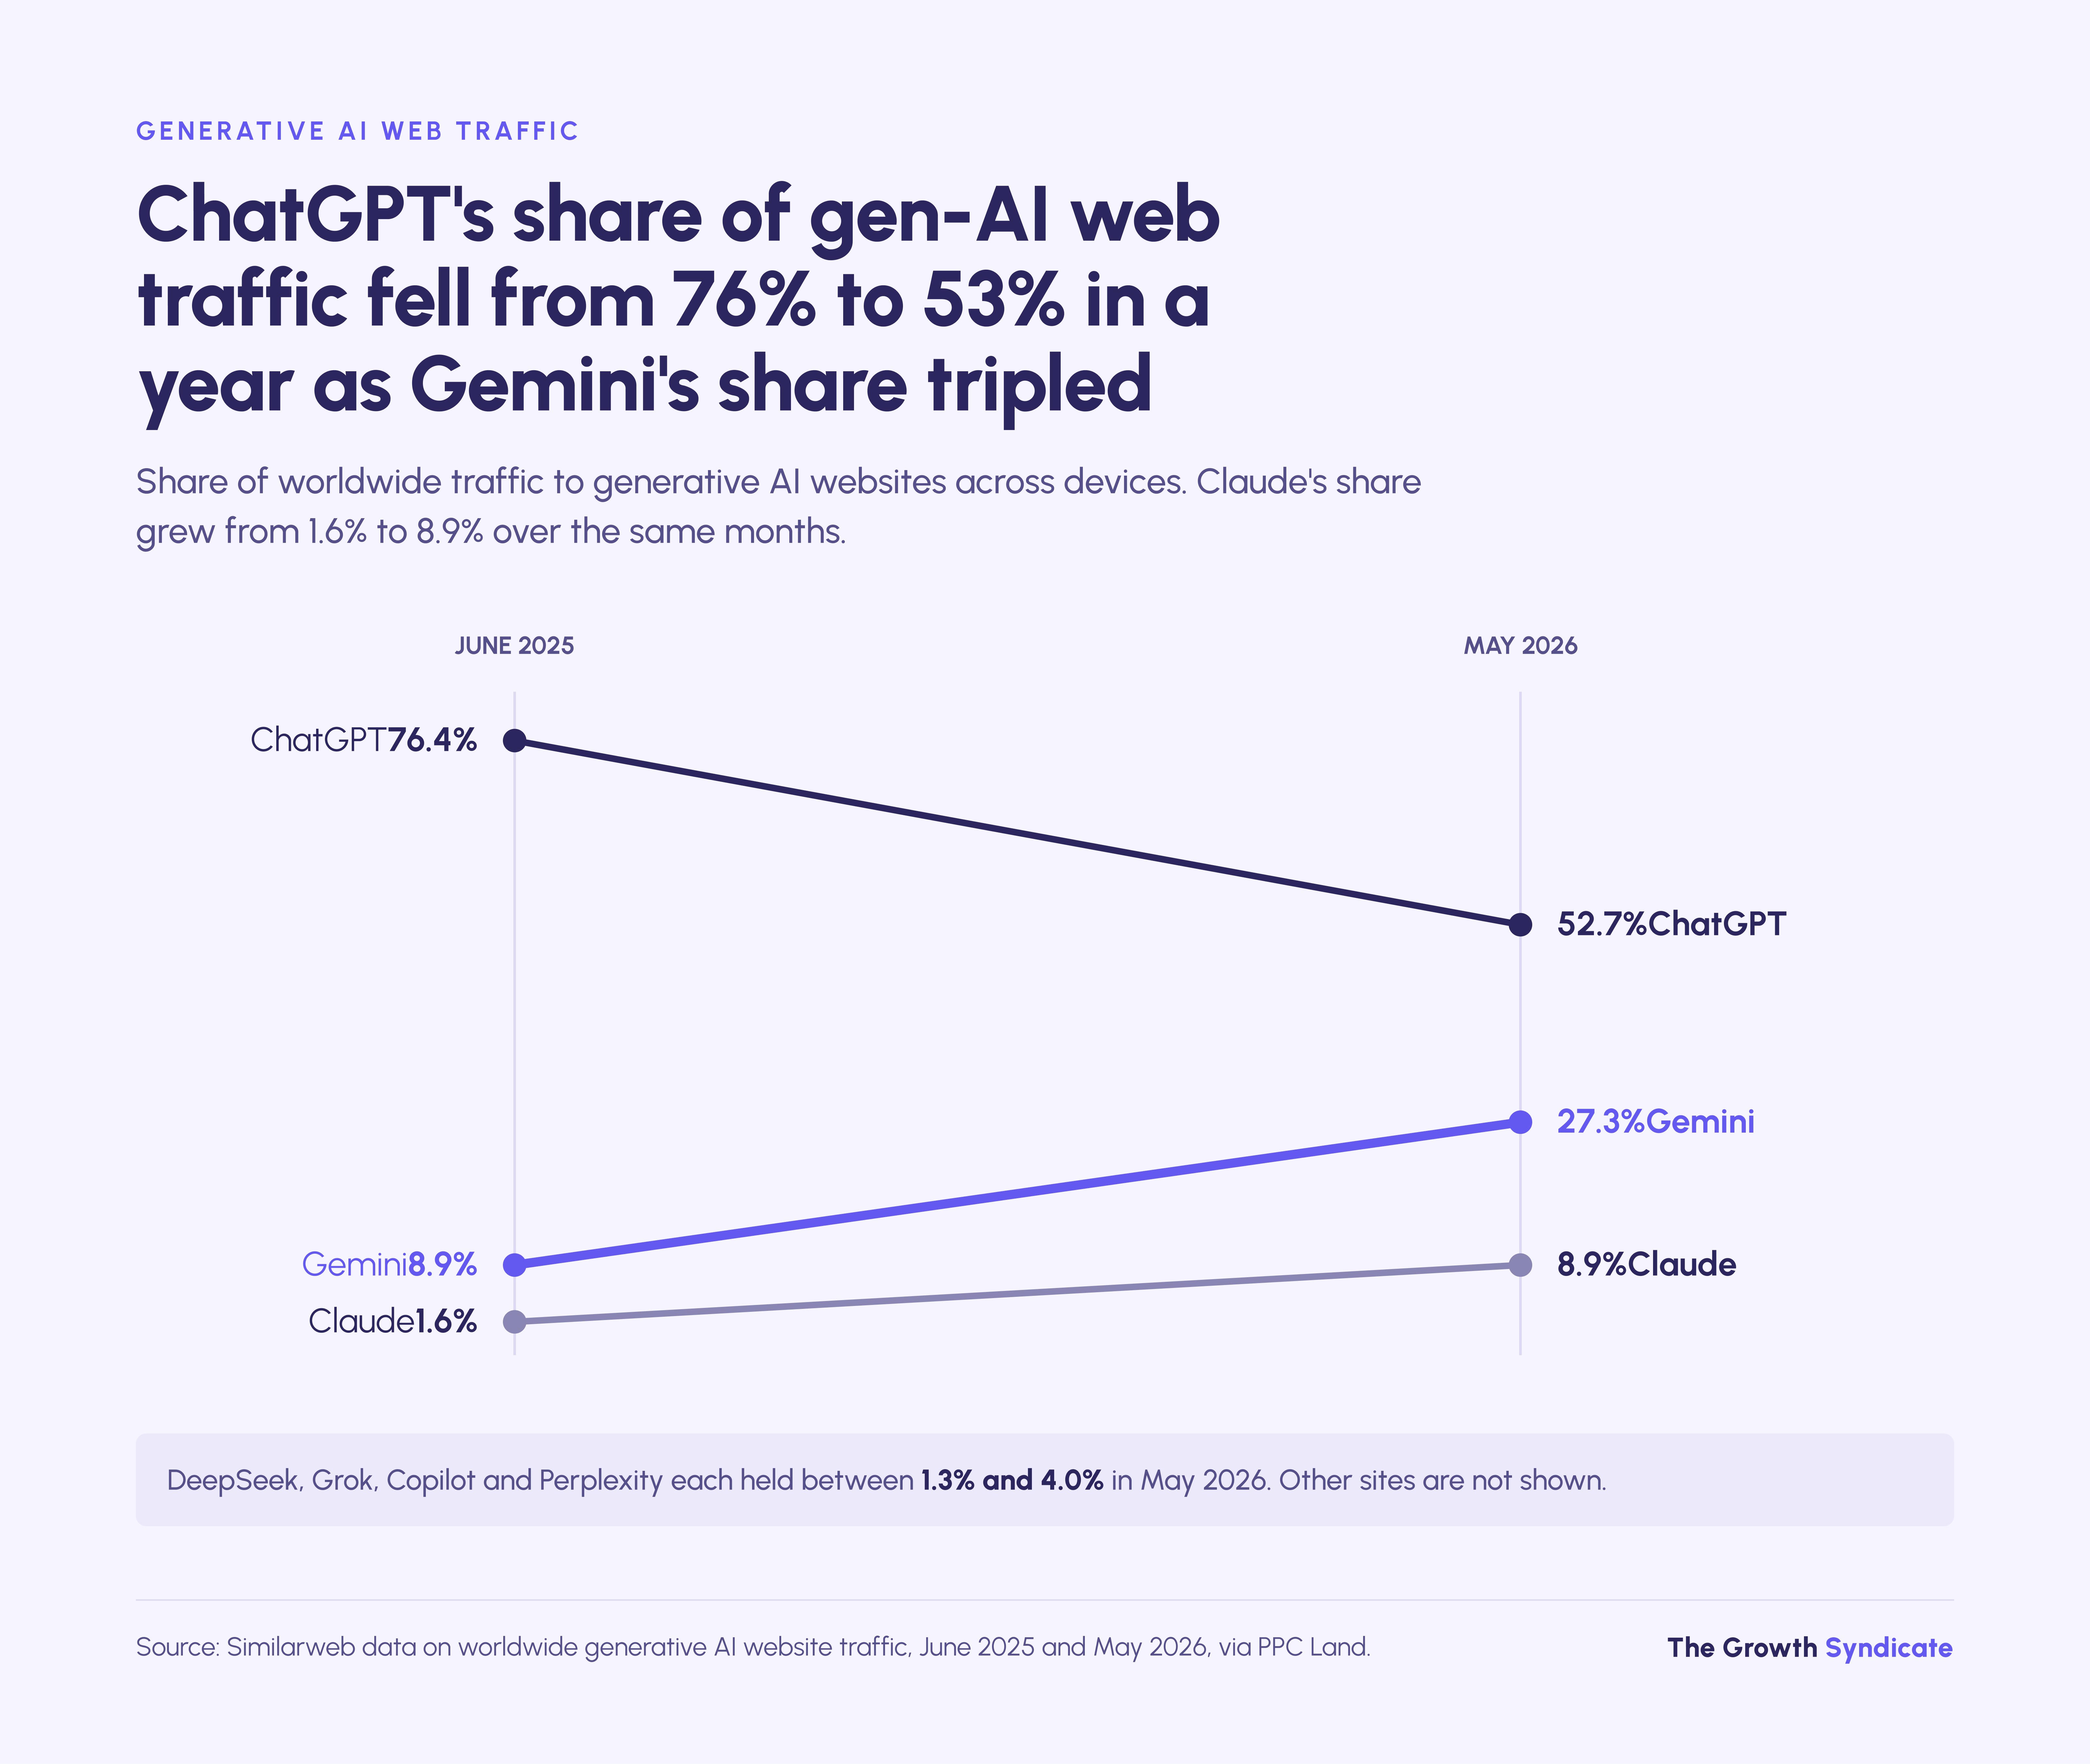
AI search market share has shifted fast among the assistants themselves. ChatGPT's share of worldwide generative AI web traffic fell from 76.4% in June 2025 to 52.7% in May 2026, while Gemini rose from 8.9% to 27.3% and Claude from 1.6% to 8.9%, in Similarweb figures reported by PPC Land. Generative AI platforms reached 9.5 billion visits a month by May 2026, up 70% year over year (Similarweb).
B2B buyers use AI for vendor research as well. In Responsive's 2025 survey of 350 B2B buyers, published by an RFP software vendor, generative AI had overtaken traditional search for a quarter of them, and 48% of US buyers used it for vendor discovery. The sample is global, and the release doesn't give the size of the US group.
Set against search, these numbers are still small. Datos measured AI tools at 1.65% of all US desktop activity in Q1 2026, and Google held 94.3% of US desktop search.
How much traffic does AI search send, and does it convert?
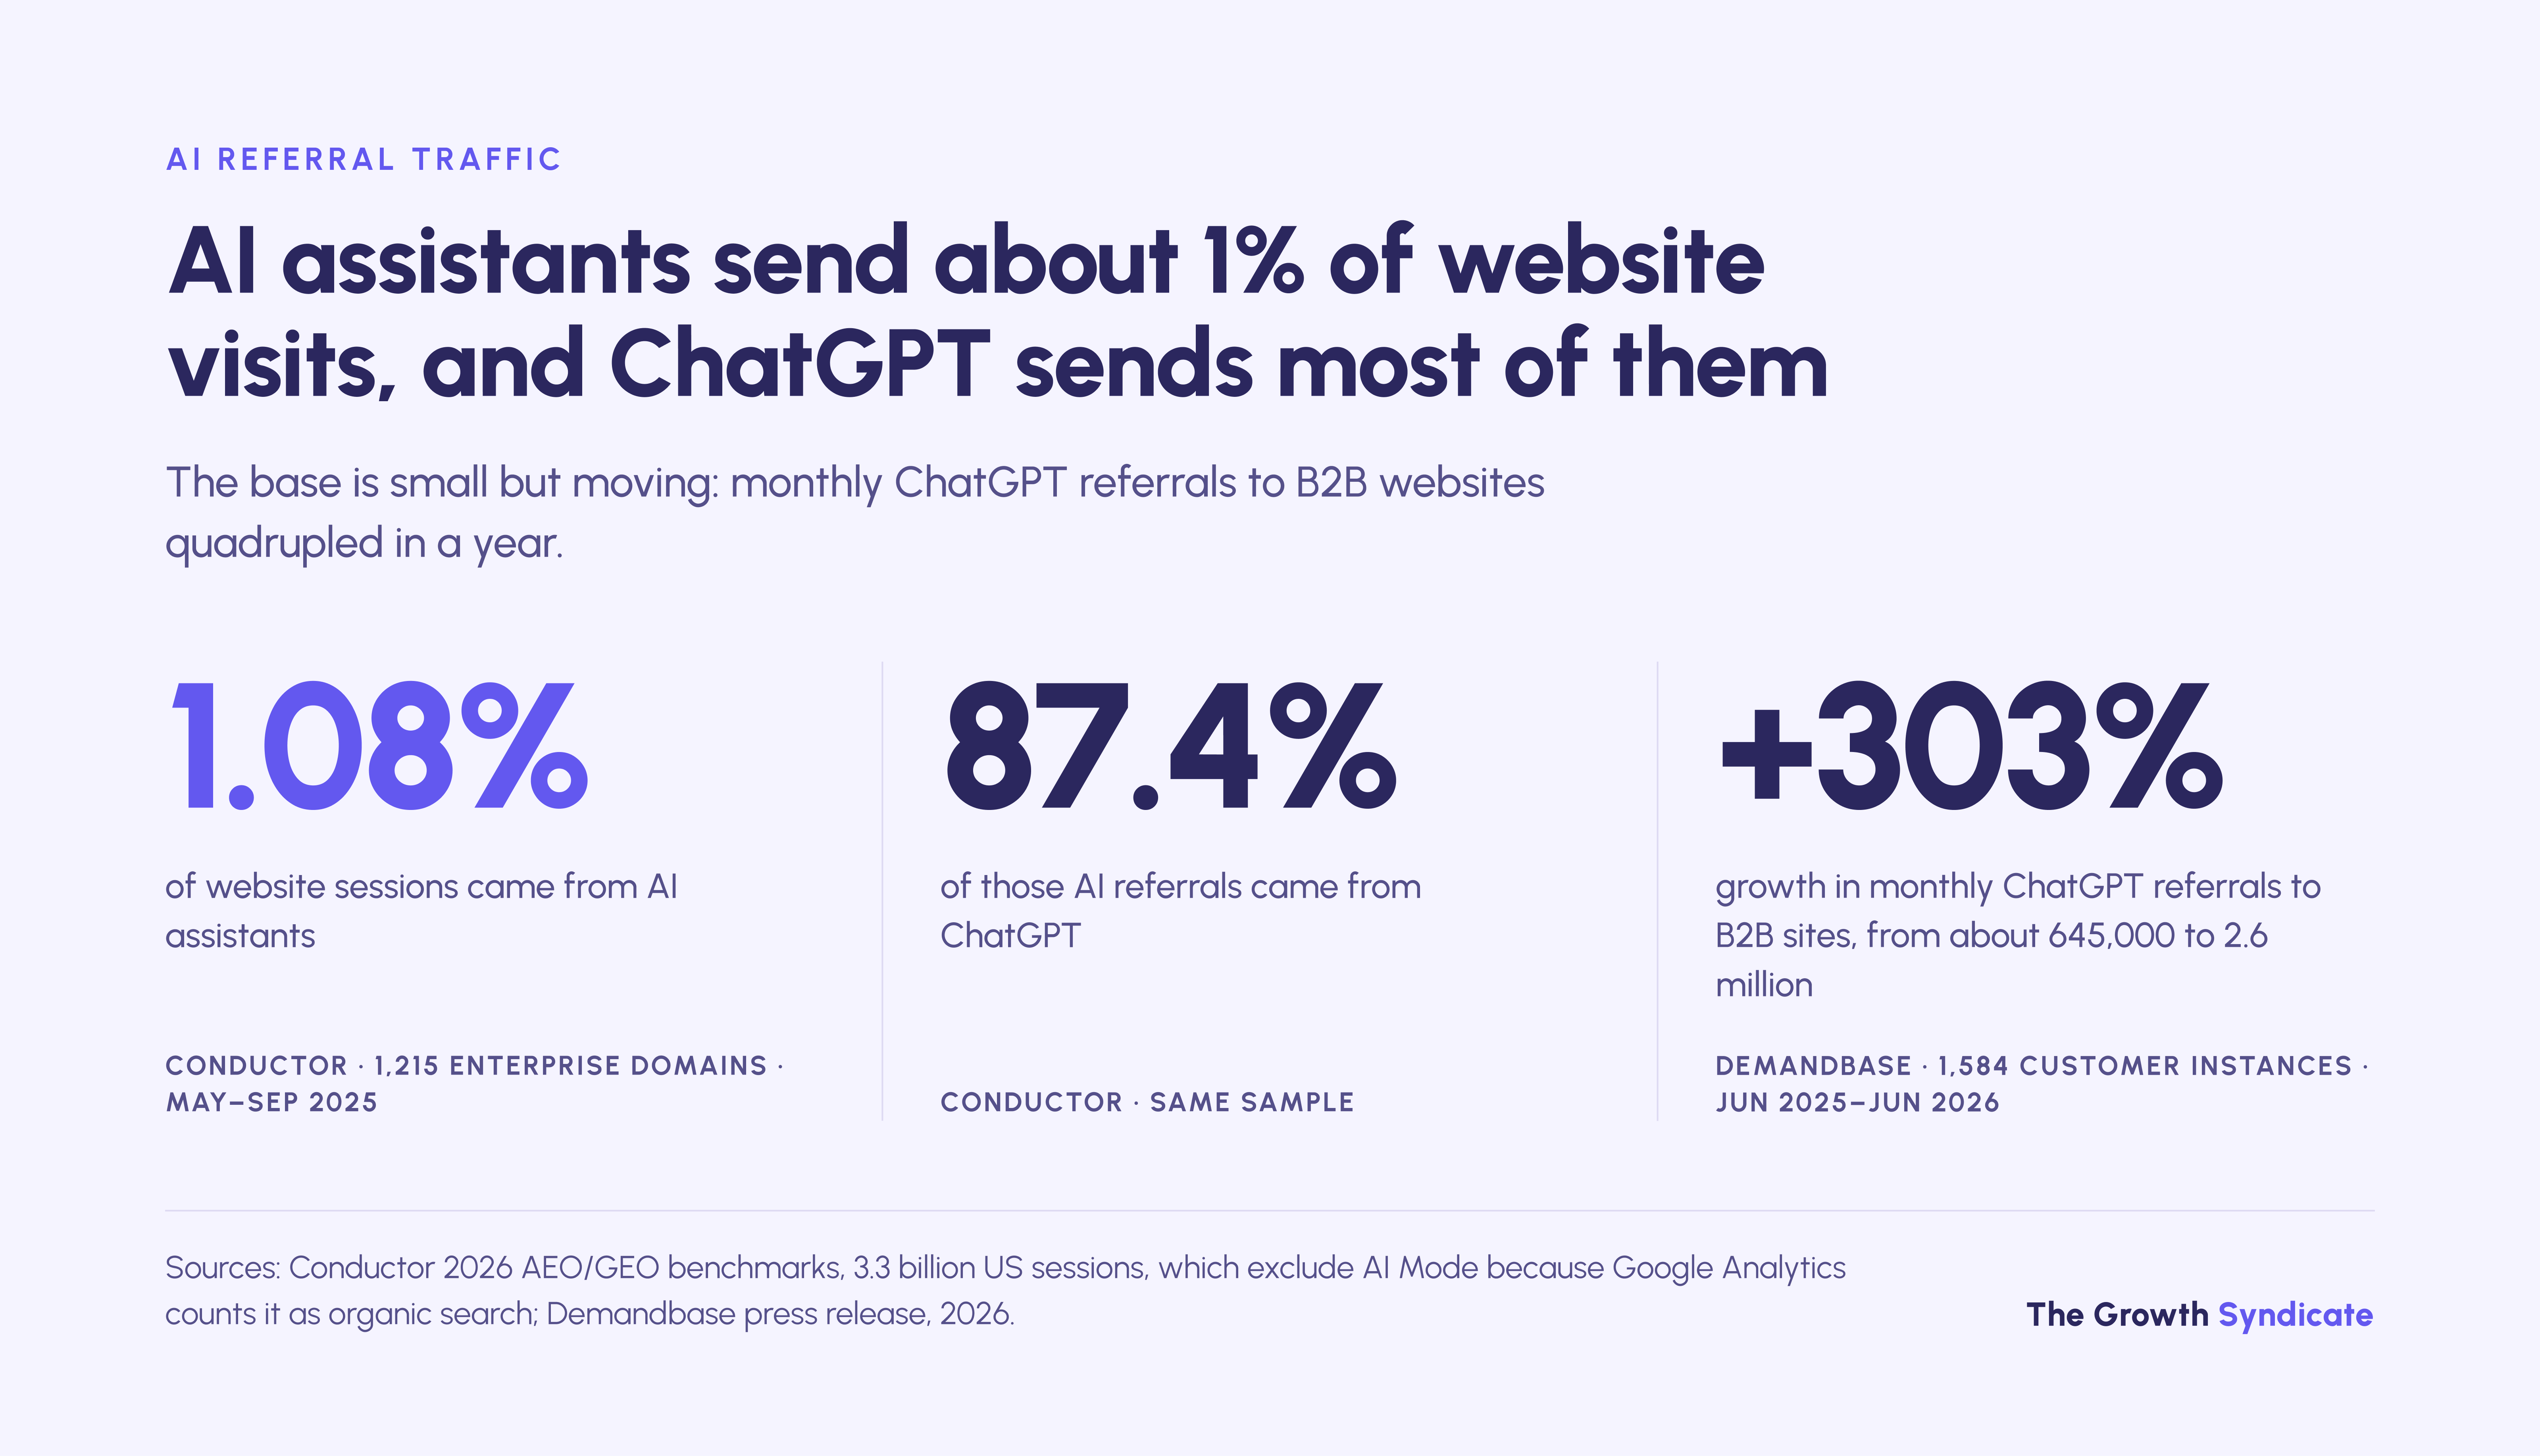
AI search sends little traffic so far, but the B2B share is climbing fast. AI assistants referred 1.08% of website sessions across 1,215 enterprise domains in Conductor's 2025 benchmark, and ChatGPT referrals to B2B sites grew 303% in a year, to 2.6 million visits a month, across Demandbase's customers. Whether that traffic converts better is unproven for B2B.
Conductor's traffic sample covered more than 3.3 billion US sessions between May and September 2025. ChatGPT sent 87.4% of AI referrals, and information technology had the highest AI share at 2.80%. Conductor excluded AI Mode from these figures, because Google Analytics counts AI Mode visits as organic search.
Demandbase, which sells B2B advertising software, counted monthly ChatGPT-referred visits to its customers' websites rising from about 645,000 in June 2025 to 2.6 million in June 2026, with a sharp jump in May 2026. Perplexity referrals fell, and Gemini and Claude stayed flat. The data spans 1,584 Demandbase customer instances and more than 11 billion visits, but the release gives no AI share of total traffic and no conversion data.
Why can't Google Analytics isolate AI Overview traffic?
Google Analytics can't isolate AI Overview or AI Mode clicks because Google files them under Organic Search. Google's GA4 channel documentation says so, and Search Console counts both features inside its Web search type. Its generative AI report, open to all sites since August 31, 2026, shows impressions only, with the two features combined.
Google's default channel group definitions place AI Overviews and AI Mode in Organic Search and exclude them from the AI Assistant channel, which collects clicks from assistants such as ChatGPT, Gemini, DeepSeek, Copilot and Grok. Google doesn't publish that channel's full list, and its page doesn't mention Perplexity. Search Central's page on AI features and your website says both appear in the Performance report under the Web search type, and the generative AI report counts how often links to a site were shown in either feature, without clicks or a split between them.
AI Mode traffic was harder to see still at launch. Its links carried a noreferrer attribute, so clicks arrived as Direct traffic until Google fixed the problem by May 28, 2025 (Search Engine Roundtable). Traffic reports from before that date undercount AI Mode, and no report since can separate it from ordinary organic search.
Does AI search traffic convert better?
No controlled B2B study shows AI search traffic converting better than organic search. The published multiples come from retail sites, publishers, a single website or methods nobody disclosed. The one B2B dataset we found, across 28 B2B SaaS companies, measured 0.13% of AI-referred sessions turning into leads, with no organic baseline to compare against.
Adobe's retail data shows how fast a conversion gap can flip. AI-referred traffic to US retail sites grew 393% year over year in Q1 2026, and in March 2026 it converted 42% better than other traffic, after converting 38% worse a year earlier. Retail checkout behavior says little about a six-month B2B purchase.
Microsoft Clarity's study reported a "sign-up CTR" of 1.66% for traffic from LLMs against 0.15% for search, across 1,277 domains over one month, without defining either side of the ratio. Semrush's "4.4 times as valuable" comes from a traffic study that discloses no sample, sites, period or calculation.
The 23x figure comes from Ahrefs' own site: AI search visitors were 0.5% of its traffic over 30 days and produced 12.1% of sign-ups, and the author wrote that he doubted the gap would hold. The page's numbers give about 24x against all traffic, not against organic search.
TripleDart, a B2B SaaS agency, measured 82 leads from 65,583 AI-referred sessions across 28 companies in Q1 2026, using HubSpot's last-click source field. Homepages took 31.9% of those sessions and converted at 0.32%, and ChatGPT sent 72.2% of sessions and 86.6% of leads. Without an organic figure from the same accounts, 0.13% can't be called better or worse than search.

Field note: We don't judge AI search from Google Analytics, because AI referrals are about 1% of sessions in Conductor's benchmark and GA files AI Overview and AI Mode clicks under organic search, so a channel report can't isolate them. We ask what happened in the CRM instead: which opportunities were created, by which accounts, and what they were worth. A form field asking buyers how they found you catches some of what no referrer records.
Prompt tracking covers part of the gap, though AI visibility tracking is still a young discipline, with small samples and methods that vary from tool to tool.
Where do AI answers get their sources?
AI answers cite fewer sources than a results page shows, and many of them sit outside Google's top 10. Across 55,936 queries, AI engines cited a mean of 4.3 URLs per answer against 10.3 for Google and Bing, and 38% of domains appeared in both (Zhang et al., 2025). Ahrefs found 37.9% of AI Overview citations came from top-10 pages.
Zhang and colleagues, in a preprint that hasn't been peer reviewed, compared ChatGPT, Gemini, Perplexity, Grok, Google AI Mode and Copilot Search with Google and Bing, on queries drawn from US trending keywords collected in July and August 2025. AI engines cited 3.4 domains per answer against 7.3, and 37% of domains appeared only in AI results. The paper gives the overlap as 38% in one section and 37% in another.
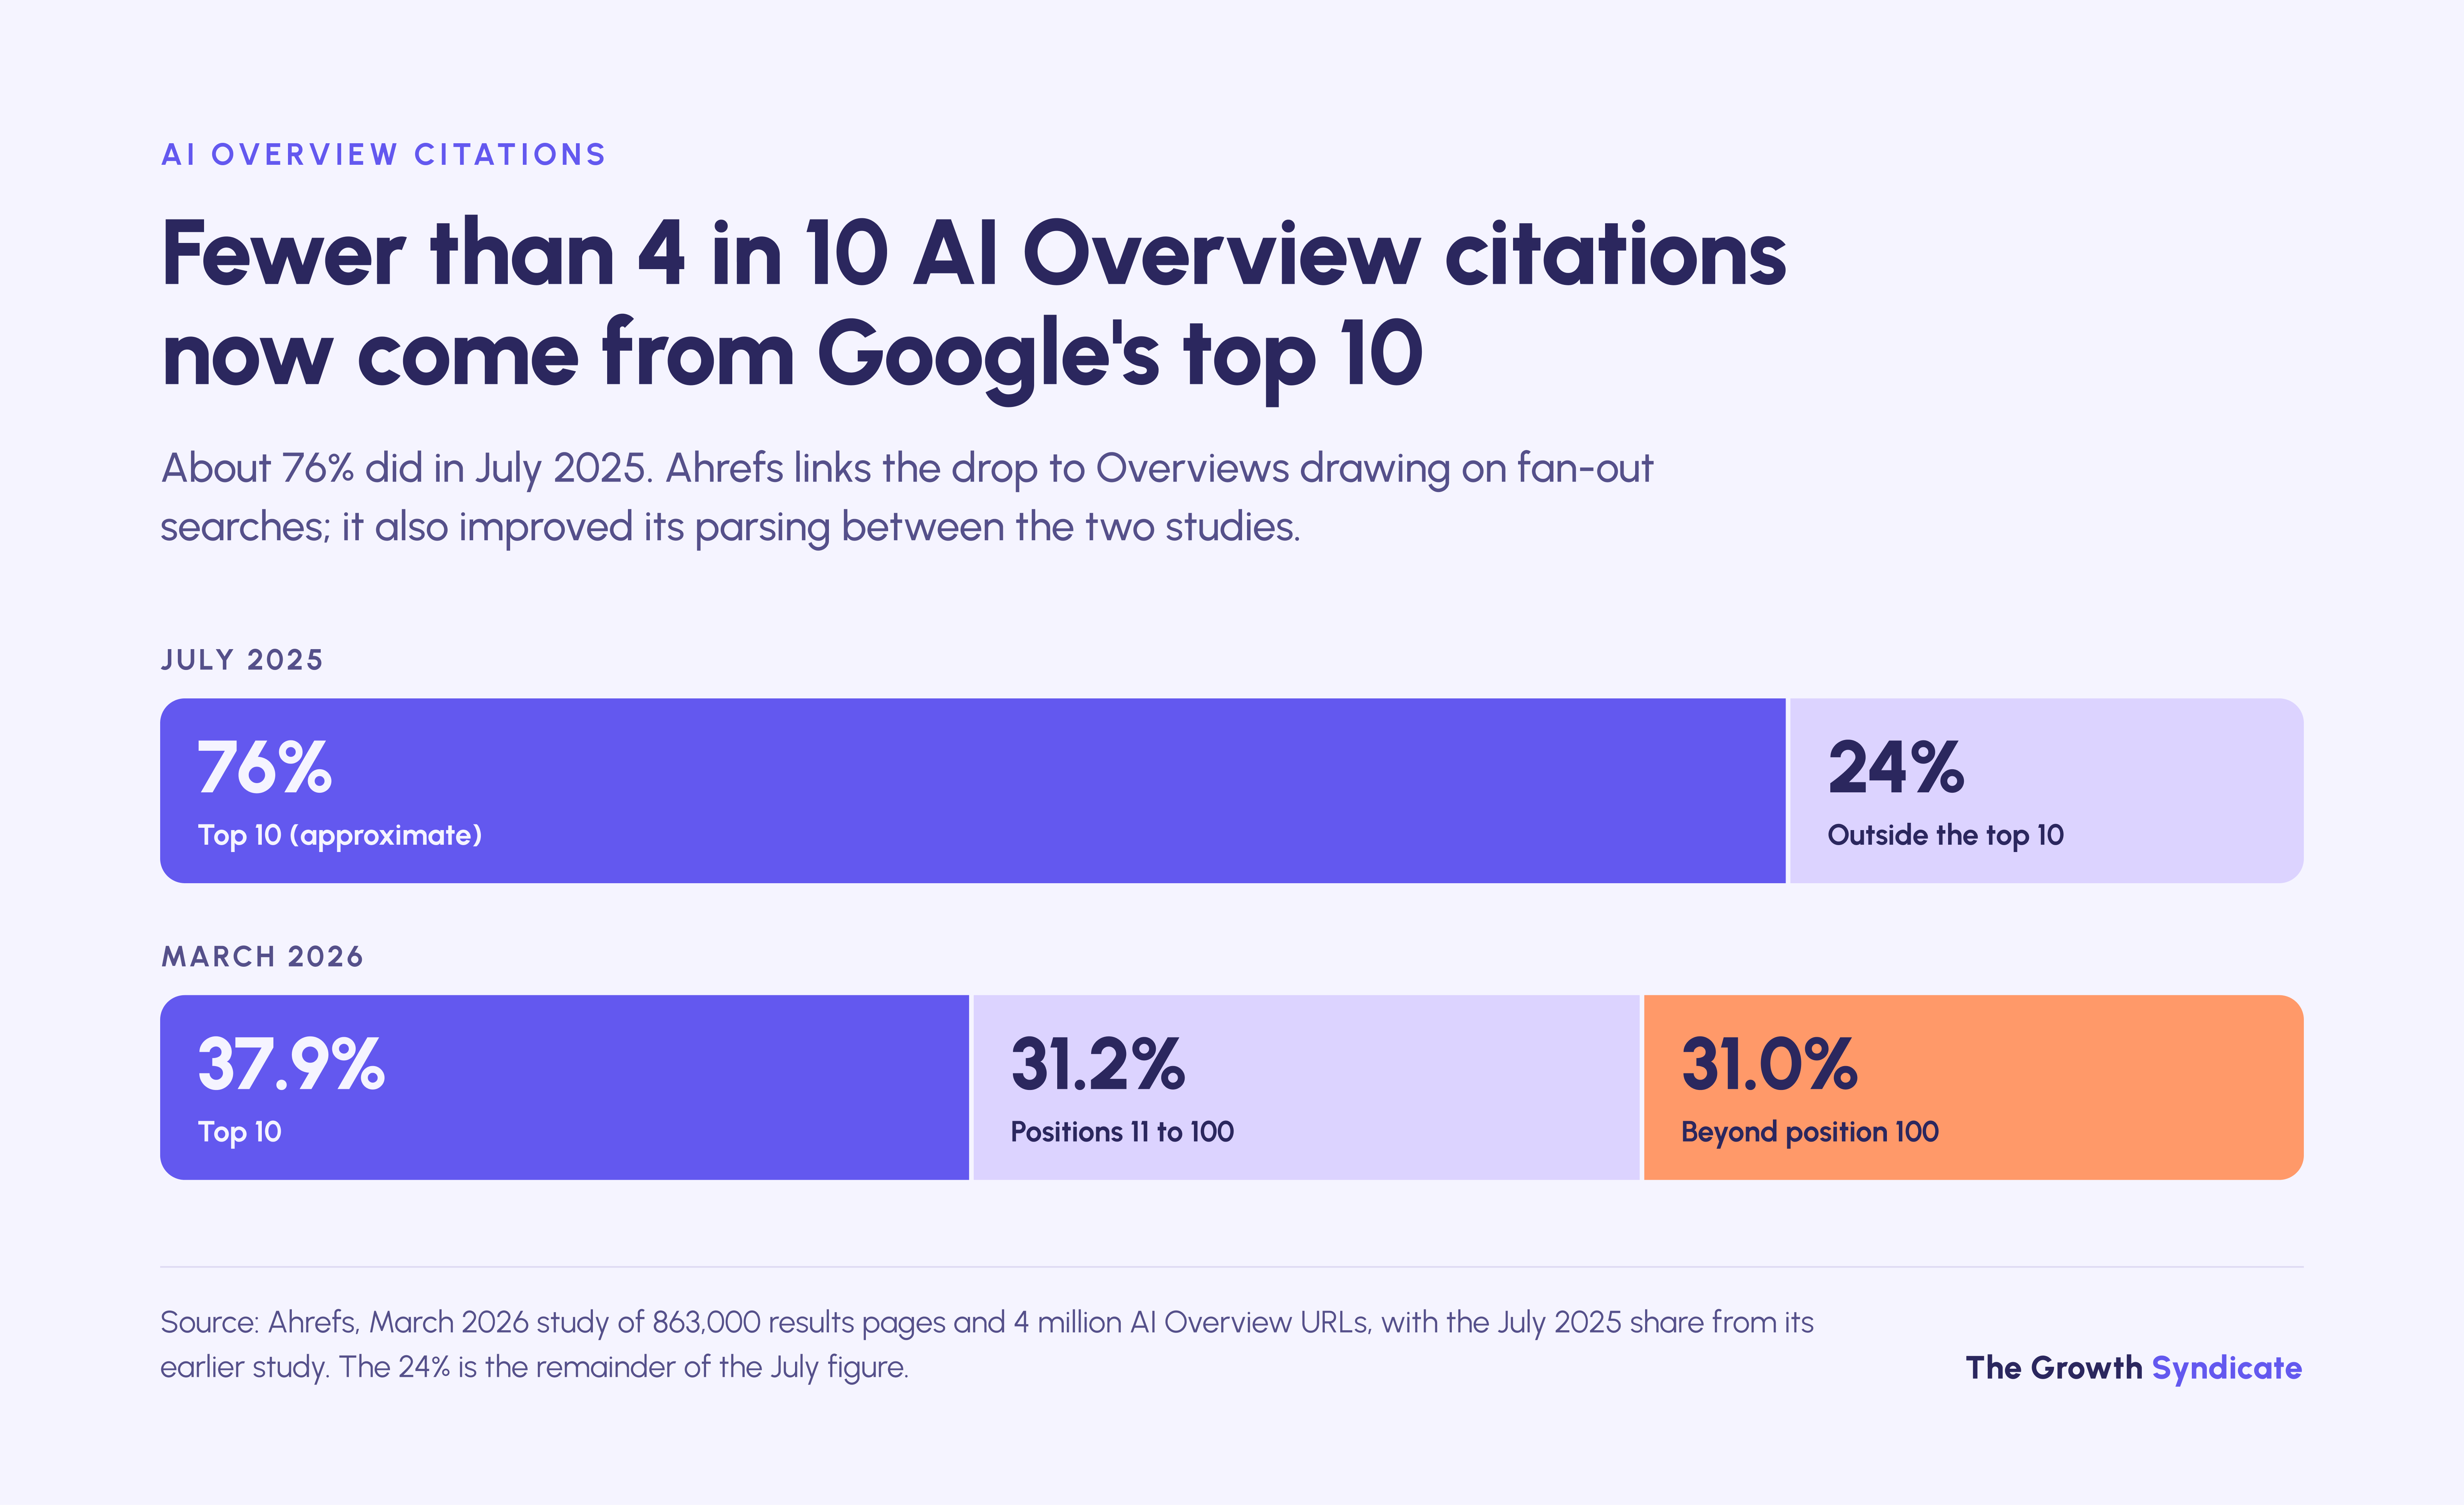
Ahrefs' March 2026 study of 863,000 results pages and 4 million AI Overview URLs found 37.9% of citations came from top-10 pages, down from about 76% in July 2025, 31.2% from positions 11 to 100 and 31% from beyond the top 100. Counting blue links only, the beyond-100 share is 36.7%. Ahrefs attributes the drop to Overviews drawing on fan-out searches, and it also improved its parsing between the two studies, so part of the change may be method (our inference).
Earned media dominates what assistants cite, on a broad definition. Muck Rack's May 2026 analysis of more than 25 million links cited by ChatGPT, Claude and Gemini classed 84% as earned, including journalism at 27%, while paid and advertorial content made up 0.3%. Muck Rack sells PR software, and its "earned" category also includes academic, government, encyclopedic, social and third-party company sources, a choice PR Daily called "a very generous definition of earned media".
How often each assistant cites varies widely. In the same data, ChatGPT included citations in 96% of responses, with about five sources each, Gemini in 82%, with about eight, and Claude in 55%, with about 13 when it cited at all. The engines also disagree on what to cite: in Kevin Indig's analysis of 20,000 prompts, weighted toward Spain and the EU, only 2.37% of cited URLs appeared in ChatGPT, Perplexity and AI Overviews for the same prompt.
Do brand mentions matter more than backlinks for AI citations?
Brand mentions track AI visibility more closely than backlinks in the largest study so far. Across 75,000 brands, Ahrefs found branded web mentions correlated with AI Overview brand visibility at 0.664, against 0.218 for backlinks. The study is correlational, so it shows where visible brands get mentioned, not that mentions cause citations.
Ahrefs' brand study covered brands with a domain rating above 40, and branded anchor text (0.527), branded search volume (0.392), domain rating (0.326) and referring domains (0.295) all ranked above backlinks. About a quarter of the brands had no Overview mentions at all. The pattern fits Muck Rack's finding that assistants mostly cite third-party sources: what other sites say about a company carries more weight than what its own pages say.

Field note: For Rapid Circle, a 2024 Microsoft Partner of the Year, the Cloud Leadership Show drew more than 12,000 YouTube views during our nine-month program, alongside more than 10 enterprise deals influenced or driven by account-based marketing. That is the kind of presence beyond Google the brand-mention studies point to. We didn't measure its effect on AI citations, so we don't claim one.
Does fresh content get cited more often?
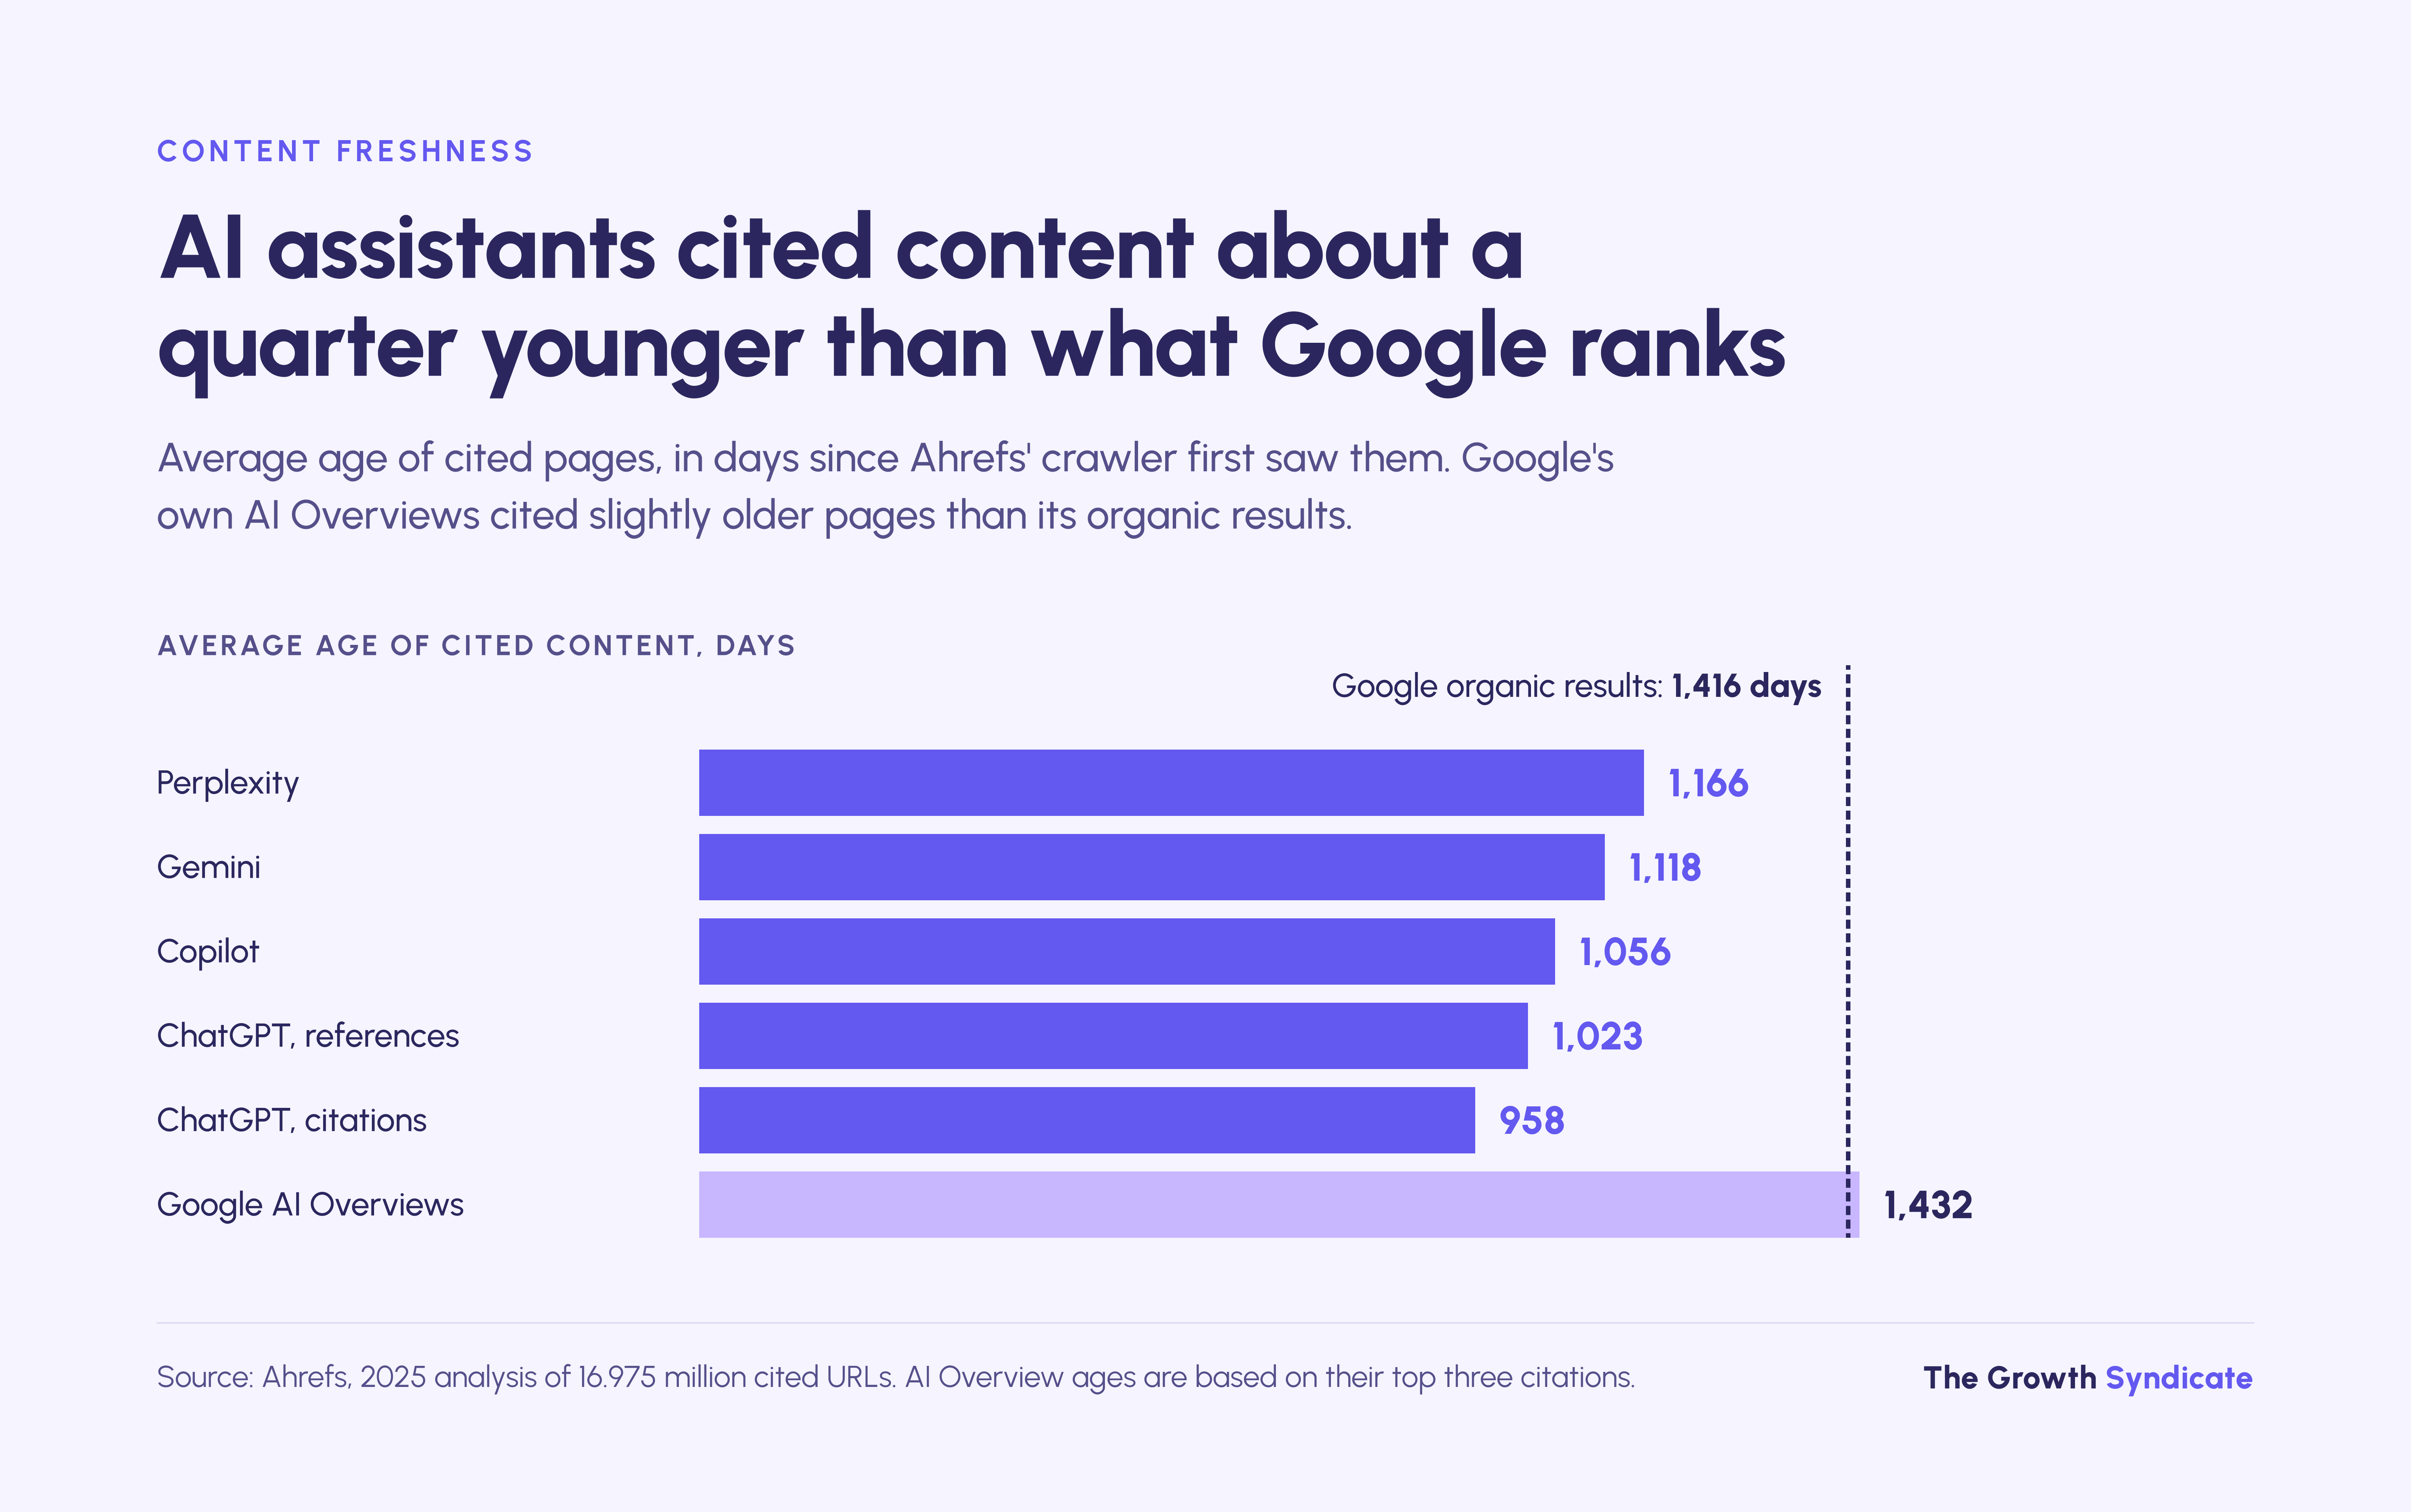
AI assistants cite content that is about a quarter fresher than what ranks organically. Ahrefs' 2025 analysis of 16.975 million cited URLs found assistant citations averaged 1,064 days old, while AI Overviews cited content slightly older than organic results. The widely repeated claim that fresh content is 4.3x more likely to be cited has no source.
Ahrefs' freshness study states the gap as 25.7%, measured against 1,432 days; its own table gives organic results 1,416 days, which makes the gap 24.9%. The 1,064 is an unweighted mean of five figures from four assistants, with ChatGPT's references and citations counted separately, and AI Overviews cited content 16 days older than organic results, based on their top three citations. Ahrefs counts age from the date its crawler first saw each page.
AirOps, which sells content-refresh software, analyzed more than 4,000 pages cited by ChatGPT and found pages not updated in over a year were more than twice as likely to lose citations. The report gives two conflicting shares for how many cited pages were more than a year old (26.2% and 56.4%), so treat the finding as directional.
Do schema markup, formatting or llms.txt help AI citations?
None of the three has measurable support. Ahrefs tracked 1,885 pages adding schema and found no significant change in AI Mode or ChatGPT citations, while AI Overview citations fell 4.6%. SE Ranking found no link between llms.txt and citations across about 300,000 domains, and a controlled test found formatting-only edits made little difference.
Ahrefs' schema test compared each page that added JSON-LD between August 2025 and March 2026 with three control pages from other domains, over 30 days before and after. AI Mode citations rose 2.4% and ChatGPT's 2.2%, both statistically indistinguishable from zero, and the AI Overview decline was significant. Only pages that were already heavily cited were tested, and Google has stopped showing FAQ rich results since May 7, 2026 (Search Central updates).
Gaming the engines is a poor bet even where it works for a while. Google's AI optimization guide says seeking inauthentic mentions across the web "isn't as helpful as it might seem".

SE Ranking's llms.txt study found 10.13% of nearly 300,000 domains had the file and no correlation between having it and being cited. Google says the files aren't needed for Search and won't help or hurt visibility.
Two lab studies point to what does move citations. In the original GEO experiment (Aggarwal et al., KDD 2024), adding quotations, statistics and cited sources raised visibility in generative answers by up to 40% on GPT-3.5, with smaller gains on Perplexity, while keyword stuffing scored below baseline. In 252,000 controlled trials across six models built on B2C product reviews, Vishwakarma and colleagues, writing from the software company Sprinklr, found topical relevance and list position drove which source got cited first, explicit prices and recent timestamps helped, and formatting-only edits had little effect.
Most of what moves citations in these studies is relevance and being discussed by other sites, which is why we treat GEO as SEO with a measurement problem rather than a separate discipline.
Why do zero-click studies disagree?
Zero-click studies disagree mainly because they define a click differently and weight devices differently, on different panels and months. Counted the same way, the gap narrows: Datos' 22.4% desktop figure rises to roughly 38% once follow-up searches count as zero-click (our arithmetic), and SparkToro's 68.01% models two-thirds of searches as mobile.
The seven studies in the table split on eight points:
- What counts as a click. SparkToro counts clicks on Google's own properties and ads as clicks; the open-web measure counts only clicks that leave Google.
- Follow-up searches. SparkToro counts a search followed by another search as zero-click, and Datos books refinements separately.
- Device weighting. SparkToro models a two-thirds mobile mix; Datos, Comscore and Ahrefs measure desktop.
- Panels. SparkToro's 2024 and 2026 studies use different providers, Datos and Similarweb.
- The Google app. Neither SparkToro study includes searches inside it.
- Query sets. Client-tracked keywords, a vendor's index and a fixed panel each skew toward different intents, and weighting by volume or by keyword changes the result.
- Timing. Seer's 2025 and 2026 figures cover different months and cohorts, a gap during which AI Overviews kept changing.
- Baselines. SparkToro's 2026 post uses 60.45% for 2024 without explanation, where its 2024 study published 58.5%.
PaperStreet, a law-firm marketing agency, argued in June 2026 that the true 2024 rate was about 37%, SparkToro's own share of searches that ended the session. That reading fits some questions, but a searcher who reformulates three times before clicking still found the first results unhelpful.
What does this mean for B2B pipeline?
For B2B teams, the measured change is fewer clicks per search on informational and comparison queries, while buyers keep searching. No study yet measures zero-click rates by B2B query type or links AI search to pipeline in a controlled way. The practical response is to protect the pages buyers use to decide, and to judge search in the CRM.
Exposure concentrates in early research. Informational queries showed AI Overviews 36% of the time in Seer's data and transactional ones 5%, so a blog that ranks for definitions and how-to questions carries most of the click loss. The comparison queries buyers type when building a shortlist are catching up fast: Semrush's panel of "best X for Y", "alternatives" and brand-versus-brand keywords showed Overviews 88% of the time by August 2026.
Buyers haven't stopped searching; they search and ask. Comscore's desktop counts rose, and in Responsive's survey generative AI had overtaken search for only a quarter of B2B buyers. ChatGPT's 303% growth in B2B referrals, in Demandbase's data, starts from a small base, and none of the published B2B datasets reports what those visitors went on to buy.
Field note: For high-risk, high-ticket purchases, we expect the vendor's own site to matter more as AI answers spread, not less. An AI answer can put a company on a shortlist, but buyers still go to the site to validate it, read in depth and hear from the company directly, which is why we treat B2B website design as pipeline work. The pages a shortlisted buyer checks, product, proof and comparison pages, deserve the attention that used to go into ranking blog posts.
Inbound still compounds where the pages are right. For Madeinadd, an Italian digital manufacturing platform for 3D printing that we have worked with since March 2024, more than 60% of customers now come from inbound, where more than 80% of revenue used to come from outbound sales, and organic impressions on Google doubled. That result predates most AI Overview data, so we read it as evidence that inbound compounds, not as evidence about AI search.
Field note: Being cited for the wrong prompt is as useless as ranking for the wrong keyword. We have seen an agency rank a client for "AI project management" and report it as a win, when the people searching were looking for online courses, not software. The same check applies to AI visibility: track the prompts your buyers would type before celebrating a mention.
AI makes content cheaper to produce and easier to copy, which pushes the value toward what can't be copied. In our State of AI in B2B Marketing report, 63% of 110 B2B marketing leaders surveyed in 2025 named more noise and less differentiation as a risk of AI, the most widely cited concern in the survey.
Our SEO and AI search work starts from the CRM for that reason: a ranking or a citation counts when it shows up as an opportunity from an account we meant to reach. Four situations call for different responses:
- If most of your organic clicks come from informational queries, expect the steepest losses, and put effort into being the cited source, with original data and named expertise on pages that answer one question each.
- If you sell high-value contracts, spend on the pages a shortlisted buyer checks before a call, especially proof and comparison pages, before adding more top-of-funnel content.
- If your reporting stops at Search Console, connect search to CRM opportunities before you judge the channel, because impressions and clicks alone say little about pipeline.
- If you want to know whether AI answers mention you, run a fixed set of buyer prompts every month and record which domains get cited, since the sources an engine trusts tell you where to earn mentions.
How exposed is your traffic to AI Overviews?
Your exposure depends on how much of your organic traffic comes from informational queries, because those carry AI Overviews most often. The defaults below let you apply each study's figures to your own click mix, one source at a time, and see how the result changes if your pages are cited inside the Overview.
To run the numbers, you need your monthly organic clicks from Search Console, your split of clicks by query intent and your typical ranking position. Apply each source's figure on its own rather than averaging them, because the studies measure different things on different keyword sets.
The calculation is simple enough to run by hand. Take 10,000 monthly organic clicks, 60% of them from informational queries: at Seer's 36% rate, about 2,160 clicks come from queries likely to show an Overview. Pew's gap implies those queries yield about 47% fewer clicks than they would without a summary, and Ahrefs' desktop model implies 58% for a page in position one (our arithmetic).
Every input comes from correlational data, mostly vendor or agency research, and none of it is specific to B2B. The defaults change with the monthly refresh of this page.
Which AI search statistics should you stop quoting?
Stop quoting the older "68%" figures, the round "60% of searches are zero-click", the claim that fresh content is 4.3x more likely to be cited, the 23x and 4.4x conversion multiples, and Gartner's 25% volume drop stated as fact. Each traces to a misquote, a superseded figure, one website, an undisclosed method or a forecast.
The original "68%" is BrightEdge's 2019 Channel Report, which found 68% of trackable website traffic came from organic and paid search. Its wording never mentioned where online experiences begin, but that version still circulates on statistics pages, and it now collides with SparkToro's unrelated 68.01%.
The "60%" has four sources and no current one. It rounds up SparkToro's 2024 figure of 58.5%, echoes the 60.45% SparkToro's 2026 post used for the same year without explanation, repeats Bain's figure of about 60%, which Bain credits only to its own research, and matches Wikipedia's "about 60%", which describes search engine users rather than searches.
The 4.3x freshness figure has no study behind it. The agency Digital Applied traced it in June 2026, checked the Ahrefs and Zyppy studies and found it in neither, and Ahrefs' own freshness data supports a gap of about a quarter, not a multiple.
Where do these statistics break down?
These statistics describe US Google behavior, mostly on desktop, measured by companies that sell search data or software. They break down for searches inside the Google app, for B2B buying queries that no study isolates, and for any claim about cause and effect. Read them as context for your own Search Console and CRM data rather than as targets.
The limits worth knowing before you hold a program to any figure here:
- Vendor interest. SparkToro, Similarweb, Datos (owned by Semrush), Ahrefs, Semrush, Conductor, BrightEdge, Muck Rack, Demandbase and AirOps all sell search, AI-visibility or content tools. Seer and TripleDart are agencies, as is TGS.
- Desktop bias. Comscore, Datos, Ahrefs' click-through study and both Semrush studies measure desktop. SparkToro's mobile share is modeled, and no study here covers searches in the Google app.
- Chosen query sets. Seer's queries are its clients' choices, BrightEdge doesn't disclose its keyword count, and Conductor counts its own index, so their prevalence figures describe those sets rather than search as a whole.
- Observation, not experiment. Every click-through and citation study here is observational except the two lab experiments, which use test setups rather than live engines.
- Consumer and retail data. The strongest conversion data comes from retail sites and publishers, and B2B buying cycles run for months.
- Gated reports. Both Datos reports and Similarweb's full report sit behind forms, so those figures come from published write-ups.
- Speed. AI Overview coverage nearly doubled in Semrush's commercial panel within a year, and the assistants' traffic shares moved by more than 20 points. Figures older than a few months describe a different product.
How did we verify these figures?
We opened every source cited on this page on October 24, 2026, and checked each figure against it, naming the write-up we read where a report sits behind a form. Each source has a grade for how much weight it carries and a label saying whether a figure is measured, vendor research, a company statement or a forecast.
Grade A means recent primary data with a disclosed sample and method. Grade B means primary data with a gap, such as an undisclosed sample, a company statement or figures that don't reproduce from the source's own numbers, or a reputable secondary report. Grade C means unconfirmed, or agency data with no comparison baseline; vendor interest doesn't lower a grade and is labeled separately.
We re-checked Google's statements after Alphabet's Q3 2026 results, on November 9, 2026. We re-check the headline figures on this page every month, because AI Overview coverage and assistant traffic shares move faster than any other benchmark we publish, and we record every figure we replace in the changelog with the date it changed.
Changelog
- October 2026: Page published. All figures checked against their sources on October 24, 2026.
Frequently asked questions
What is a zero-click search?
A zero-click search is a search that ends without the searcher clicking any result. The answer may come from an AI Overview, a featured snippet or a knowledge panel, or the searcher may give up or search again. Studies disagree on whether a follow-up search counts, which is why published zero-click rates range from 22% to 68%.
Is SEO dead because of AI search?
SEO is not dead, but its returns per ranking have fallen. US desktop searches rose 10% between Q1 2024 and Q1 2026 in Comscore's data, and AI assistants referred about 1% of website sessions in Conductor's 2025 benchmark. Informational queries now yield fewer clicks when an AI Overview appears, so pages have to earn both the click and the citation.
How do you win in a zero-click search market?
Earn the citation where buyers research and the click where they decide. Pages that answer specific questions with named evidence get cited more often, and the pages a shortlisted buyer checks, such as proof and comparison pages, still win the click. Judge the result by CRM opportunities, not sessions.
How do I get my content cited in AI Overviews?
Rank well, answer the query directly and get mentioned elsewhere. In Ahrefs' 2026 data, 37.9% of AI Overview citations came from top-10 pages, and branded web mentions correlated with Overview visibility far more strongly than backlinks. Adding statistics, quotations and cited sources raised visibility by up to 40% in the original GEO experiment.
How do I track brand mentions in AI search?
Track brand mentions by running a fixed set of buyer prompts in ChatGPT, Perplexity, Gemini and Google's AI Mode every month and logging which brands and domains each answer cites. Keep the prompts constant so changes reflect the engines rather than your wording. Treat the results as directional, because answers vary between runs and engines rarely cite the same pages.
Does Google Analytics show AI Mode traffic?
Not separately. Google's GA4 channel definitions place clicks from AI Overviews and AI Mode in the Organic Search channel and exclude them from the AI Assistant channel, so they can't be split from other Google organic visits. AI Mode clicks also appeared as Direct traffic at launch, until Google fixed a referrer bug by May 28, 2025.
How can I measure ROI from zero-click searches?
Measure ROI from zero-click searches by tying search activity to CRM opportunities rather than to clicks. Track which target accounts engage, ask new leads how they found you, and compare pipeline from organic and AI-referred sources over a full sales cycle. Impressions that rise while clicks fall can still produce pipeline, and only the CRM shows whether they did.