
There is no reliable cross-company MQL to SQL conversion rate. The oldest source we could find for the famous 13% is a 2014 lead-to-opportunity figure, and the closest current primary benchmark, Norwest's 2025 survey of 177 sales and marketing leaders, puts the median lead-to-SQL rate at about 36%. This page puts every funnel benchmark on one set of definitions, from stage conversion and win rate to cycle length, cost per lead and coverage, so you can see which stage of your own funnel is weak.
Key takeaways
- The oldest source we found for the "13% average MQL to SQL rate" is Implisit's 2014 data on leads becoming opportunities, and the post's text never uses the terms MQL or SQL.
- Norwest's 2025 medians run about 36% from lead to SQL, 40% from SQL to opportunity, 42% from opportunity to proposal and 45% from proposal to win, with wide spreads around each.
- Win rate depends on the motion and on where counting starts. Ebsta's 2025 CRM data puts the new-logo win rate at 19% and the expansion win rate at 45%, while Norwest's median from proposal to win is about 45%.
- Sales cycle length depends on the clock. Dreamdata's 2026 report, on 2025 data, measures 272 days from first marketing touch to closed revenue, of which 52 days fall inside the sales pipeline.
- A 3x pipeline coverage rule implies a win rate of about 33%. At a 19% win rate, the same arithmetic points to about 5.3x.
Last verified: October 2026. Every benchmark below comes from a report we opened and read, with its sample and year where the source states them, and our client results come from published case studies of The Growth Syndicate (TGS), a B2B marketing agency. The grading method is at the end of the page, which belongs to a wider B2B marketing benchmarks series.
What are normal B2B conversion rates at each funnel stage?
Normal B2B funnel conversion, going by the medians in Norwest's 2025 survey of 177 sales and marketing leaders at venture- and PE-backed B2B companies, runs about 36% from lead to SQL, 40% from SQL to opportunity, 42% from opportunity to proposal and 45% from proposal to win. At every stage the middle half of respondents spans at least four 10-point buckets, so "normal" is a wide band.
Norwest's 2025 B2B Sales & Marketing Benchmark Report asked 177 sales and marketing leaders, surveyed between July and August 2025, to report each stage's conversion rate. The report prints a median for each stage and the full distribution in 10-point buckets, so only the "middle half" column is our reading of where the 25th and 75th percentiles fall. Lead to SQL, for example, has its median in the 31-40% bucket, its lower quartile in 11-20% and its upper quartile in 51-60%.
The win-rate rows come from Ebsta and Pavilion's 2025 GTM Benchmarks, which analyzed 655,000 opportunities worth $48 billion at 387 companies. The two sources may agree more than they first appear to. Multiply Norwest's median opportunity-to-proposal rate by its proposal-to-win rate and you get about 19%, close to Ebsta's new-logo win rate, although Ebsta doesn't say at which stage its win rate starts counting and medians don't strictly multiply.
How this page defines each stage
Each benchmark on this page names the stage its source measured. Where your CRM uses different definitions, convert before you compare.
What is a good MQL to SQL conversion rate?
We found no current primary source that publishes a defined, cross-company MQL to SQL conversion rate, so treat any single "good" number with suspicion. The closest current benchmark is Norwest's 2025 lead-to-SQL median of about 36%. Ebsta's 2025 report shows 68% beside an MQL-to-SQL label, up 32%, but defines neither stage.
Your own rate depends first on what your team calls an MQL. A team that turns every form fill into an MQL should expect a low rate, and a team that flags only demo requests a high one. Setting that boundary is a lead qualification decision before it is a benchmarking one.
Norwest's distribution shows how wide the normal range is. About 16% of respondents reported lead-to-SQL conversion between 1% and 10%, while 13% reported 51-60%, and 4% did not know their rate. Ebsta's 32% is a relative change: by its own example, a win rate moving from 20% to 30% counts as +50%.

A good MQL to SQL rate, then, is one that holds steady while your definition stays fixed and improves when the work does. Compare your rate against your own history before you compare it with anyone else's.
Field note, Frends: at Frends, a European integration platform, MQL-to-SQL conversion rose from 14% to 25-30% while we provided its fractional marketing leadership, including an account-based marketing program. We started with two industries in Sweden, public sector and energy, and built a shared file of accounts engaging with the ads, which sales reviews every week and marks as useful or not. The rate moved while both teams worked from the same list, which is why we treat MQL to SQL as a joint metric.
Why do MQL to SQL benchmarks disagree so much?
MQL to SQL benchmarks disagree because companies define an MQL in at least four different ways, and some don't track MQLs at all. In Norwest's 2025 survey, 30% counted only high-intent leads such as demo requests, 25% used a scoring model, 22% required engagement plus a persona match, 16% counted any form fill or event, and 5% did not track MQLs.
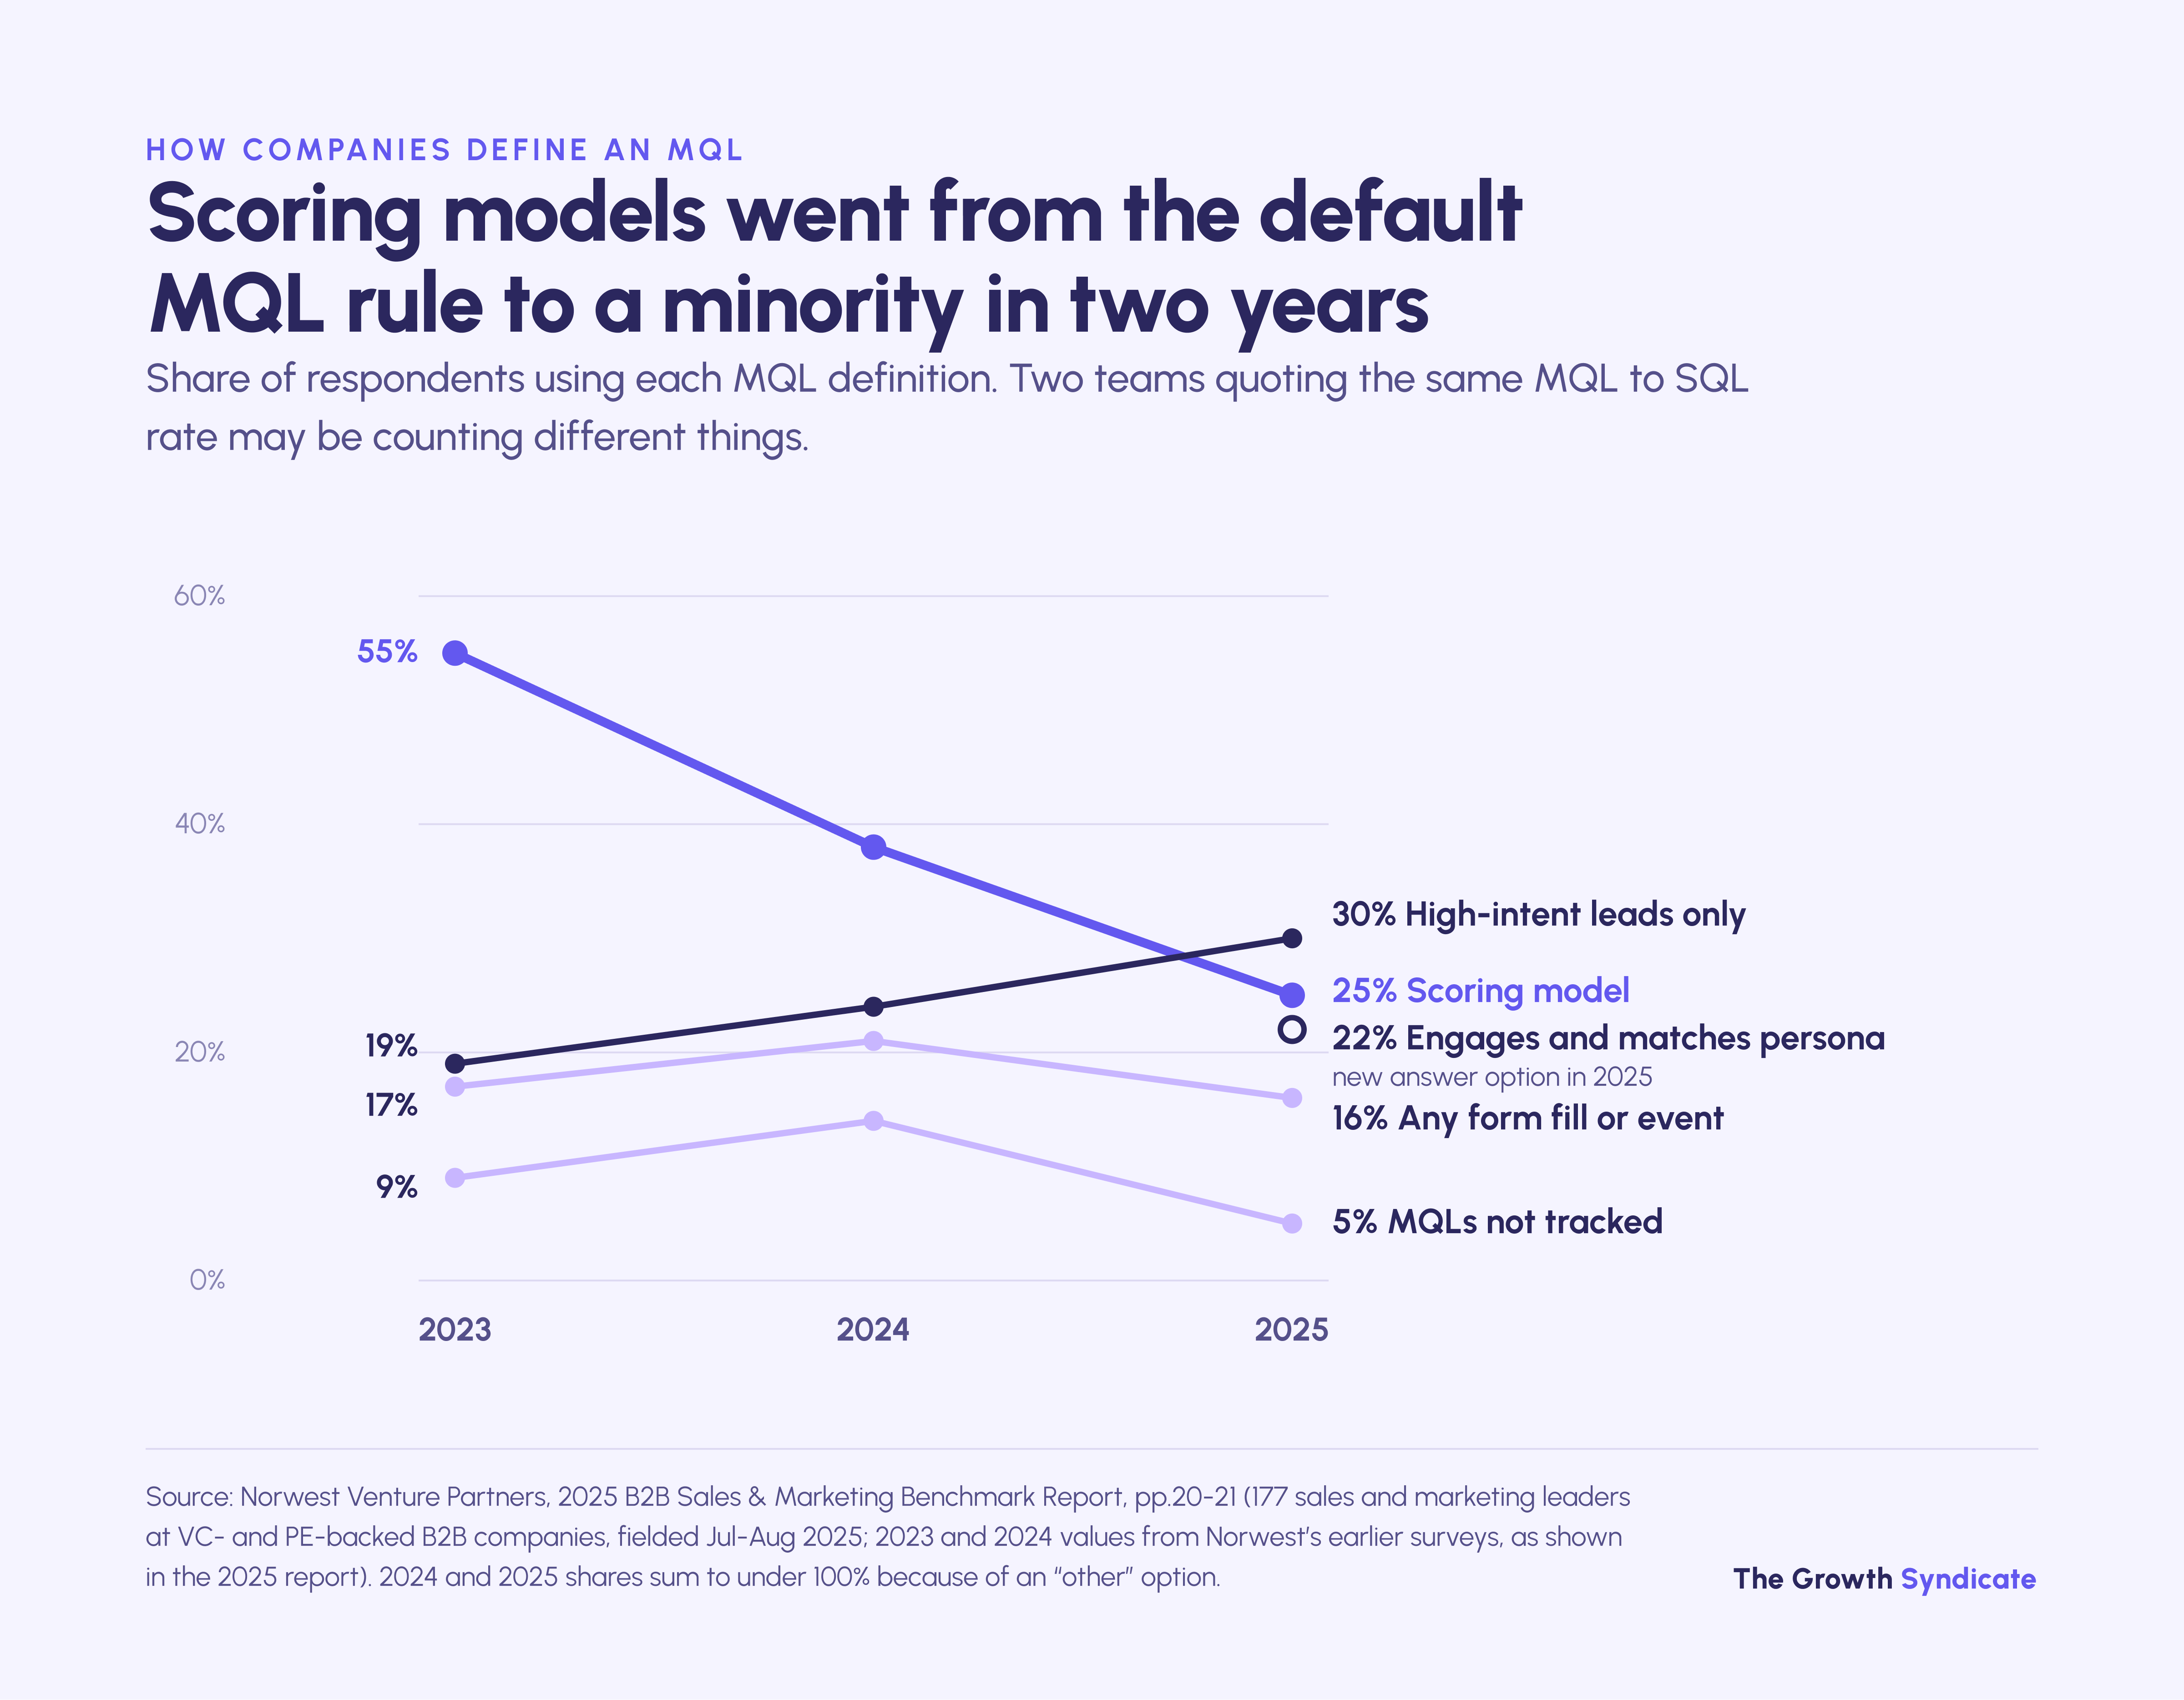
The mix is moving quickly. Scoring models dropped from 55% of Norwest's respondents in 2023 to 25% in 2025, while high-intent-only definitions rose from 19% to 30%. A rate measured on scored MQLs and a rate measured on demo requests can both be accurate and still sit far apart.
Agency benchmarks make the problem visible. First Page Sage, an agency that publishes benchmarks from its own client data, reports a B2B SaaS MQL to SQL rate of 13% on one page and 38% on another, from overlapping data windows. Both pages define an MQL in almost the same words, and neither states how many clients sit behind its figure, so nothing on either page explains the gap.
Part of the drift comes from buyers. The 6sense 2025 B2B Buyer Experience Report, a survey of nearly 4,000 buyers, found first contact with a vendor came about 61% of the way through the journey, down from about 69% a year earlier. A Gartner survey of 646 B2B buyers, fielded in August and September 2025 and published in March 2026, found 67% prefer a rep-free experience.
A lead that reaches marketing's scoring rule late in that journey is likely to convert differently from one that arrives early, which makes buyer journey data and funnel data hard to compare directly. The buying group adds another variable: Forrester's 2026 buying research puts a typical decision at 13 internal stakeholders and nine external influencers.
What share of leads become opportunities, and how many close?
About one lead in seven becomes an opportunity at Norwest's 2025 median rates, and about one in 37 becomes a customer. Further down the funnel, win rate depends on the motion: Ebsta's 2025 CRM data puts the new-logo win rate at 19%, against 45% for expansion deals sold to existing customers.
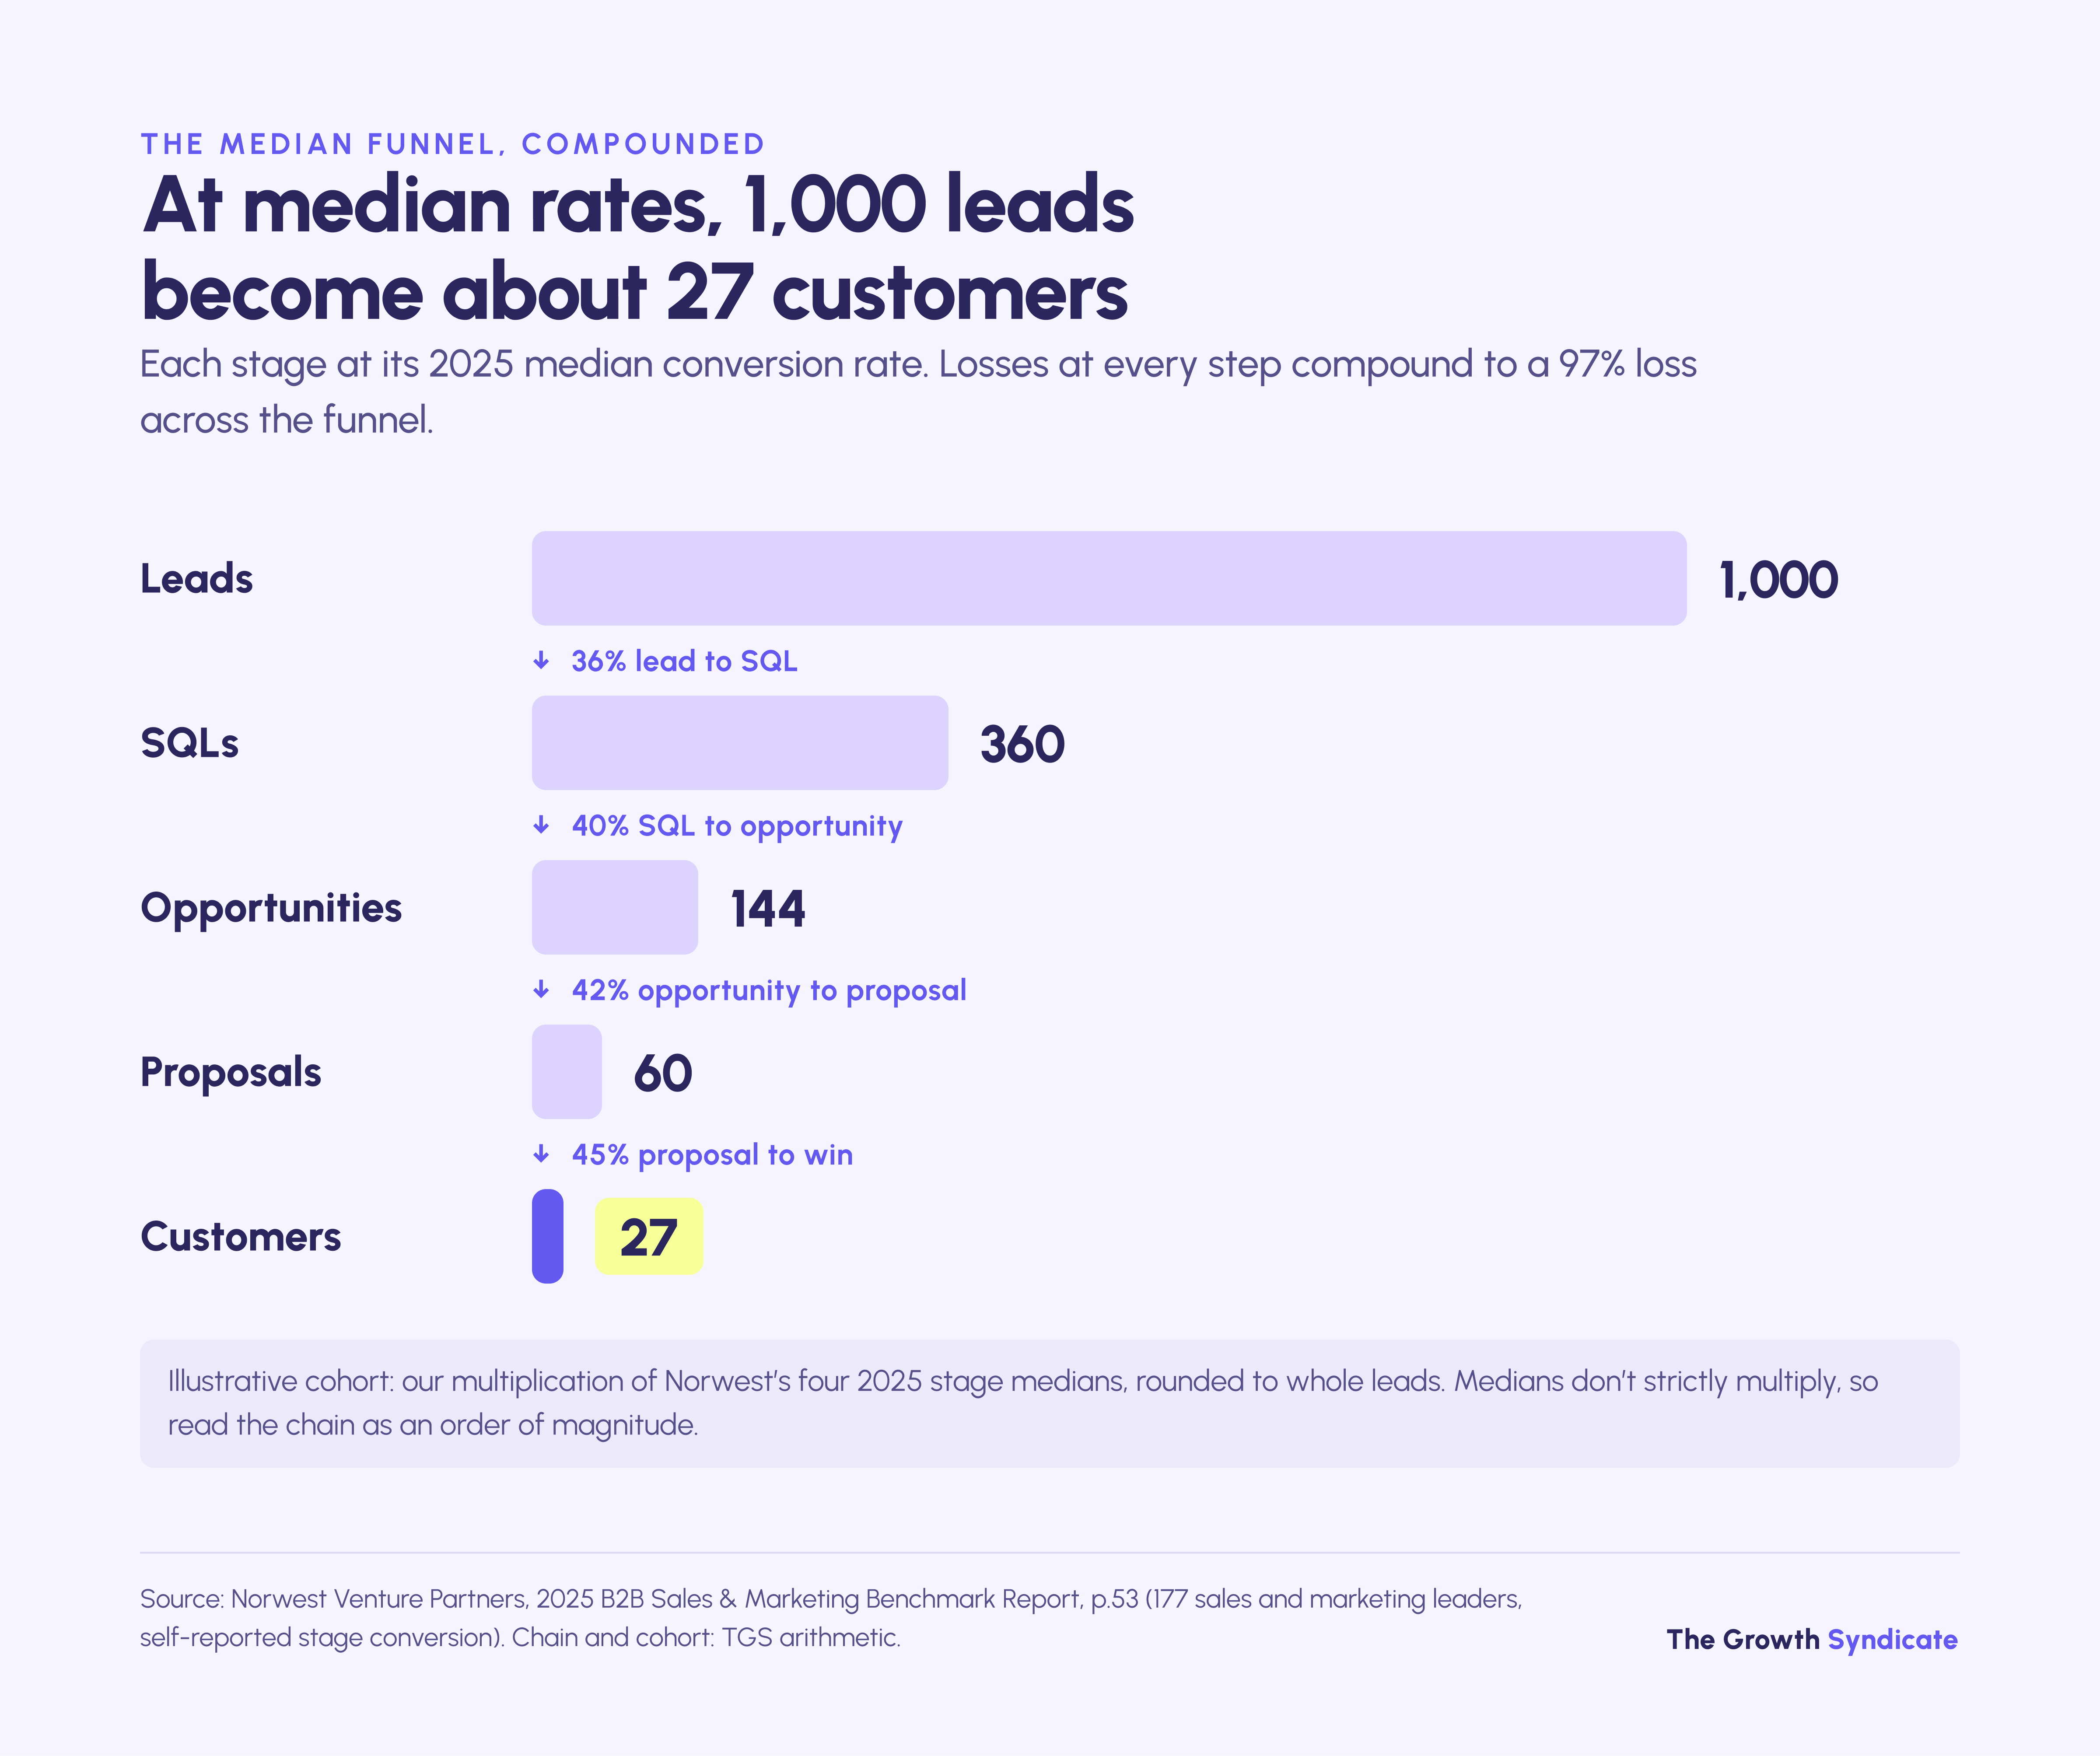
Those two ratios are our multiplication of Norwest's medians, not figures Norwest reports. Lead to SQL at 36% times SQL to opportunity at 40% gives about 14%, and carrying the chain through proposal and win gives about 2.7%. A real funnel rarely sits at the median on every stage at once, so use the chain to locate a weak stage rather than to forecast.
The HubSpot figure from its 2024 Sales Trends report describes 2023 performance as reported by 1,400+ B2B and B2C sales professionals in seven countries, and HubSpot doesn't define win rate, so it sits in the table as a contrast rather than a benchmark. Ebsta doesn't say whether its 19% counts deals or deal value, or at which stage it starts counting, and one graphic in the same report prints 18%; we use the 19% from its benchmark table. No source we found publishes win rate by deal size, so this page doesn't either.
How long is the average B2B sales cycle?
The average B2B sales cycle depends on when the clock starts. Dreamdata's 2026 report puts the full journey in 2025 at 272 days from first marketing touch to closed revenue, with 52 of those days inside the sales pipeline. Ebsta's 2025 data has deals closing in 91 days for new business and 52 for expansion, without saying when its clock starts.
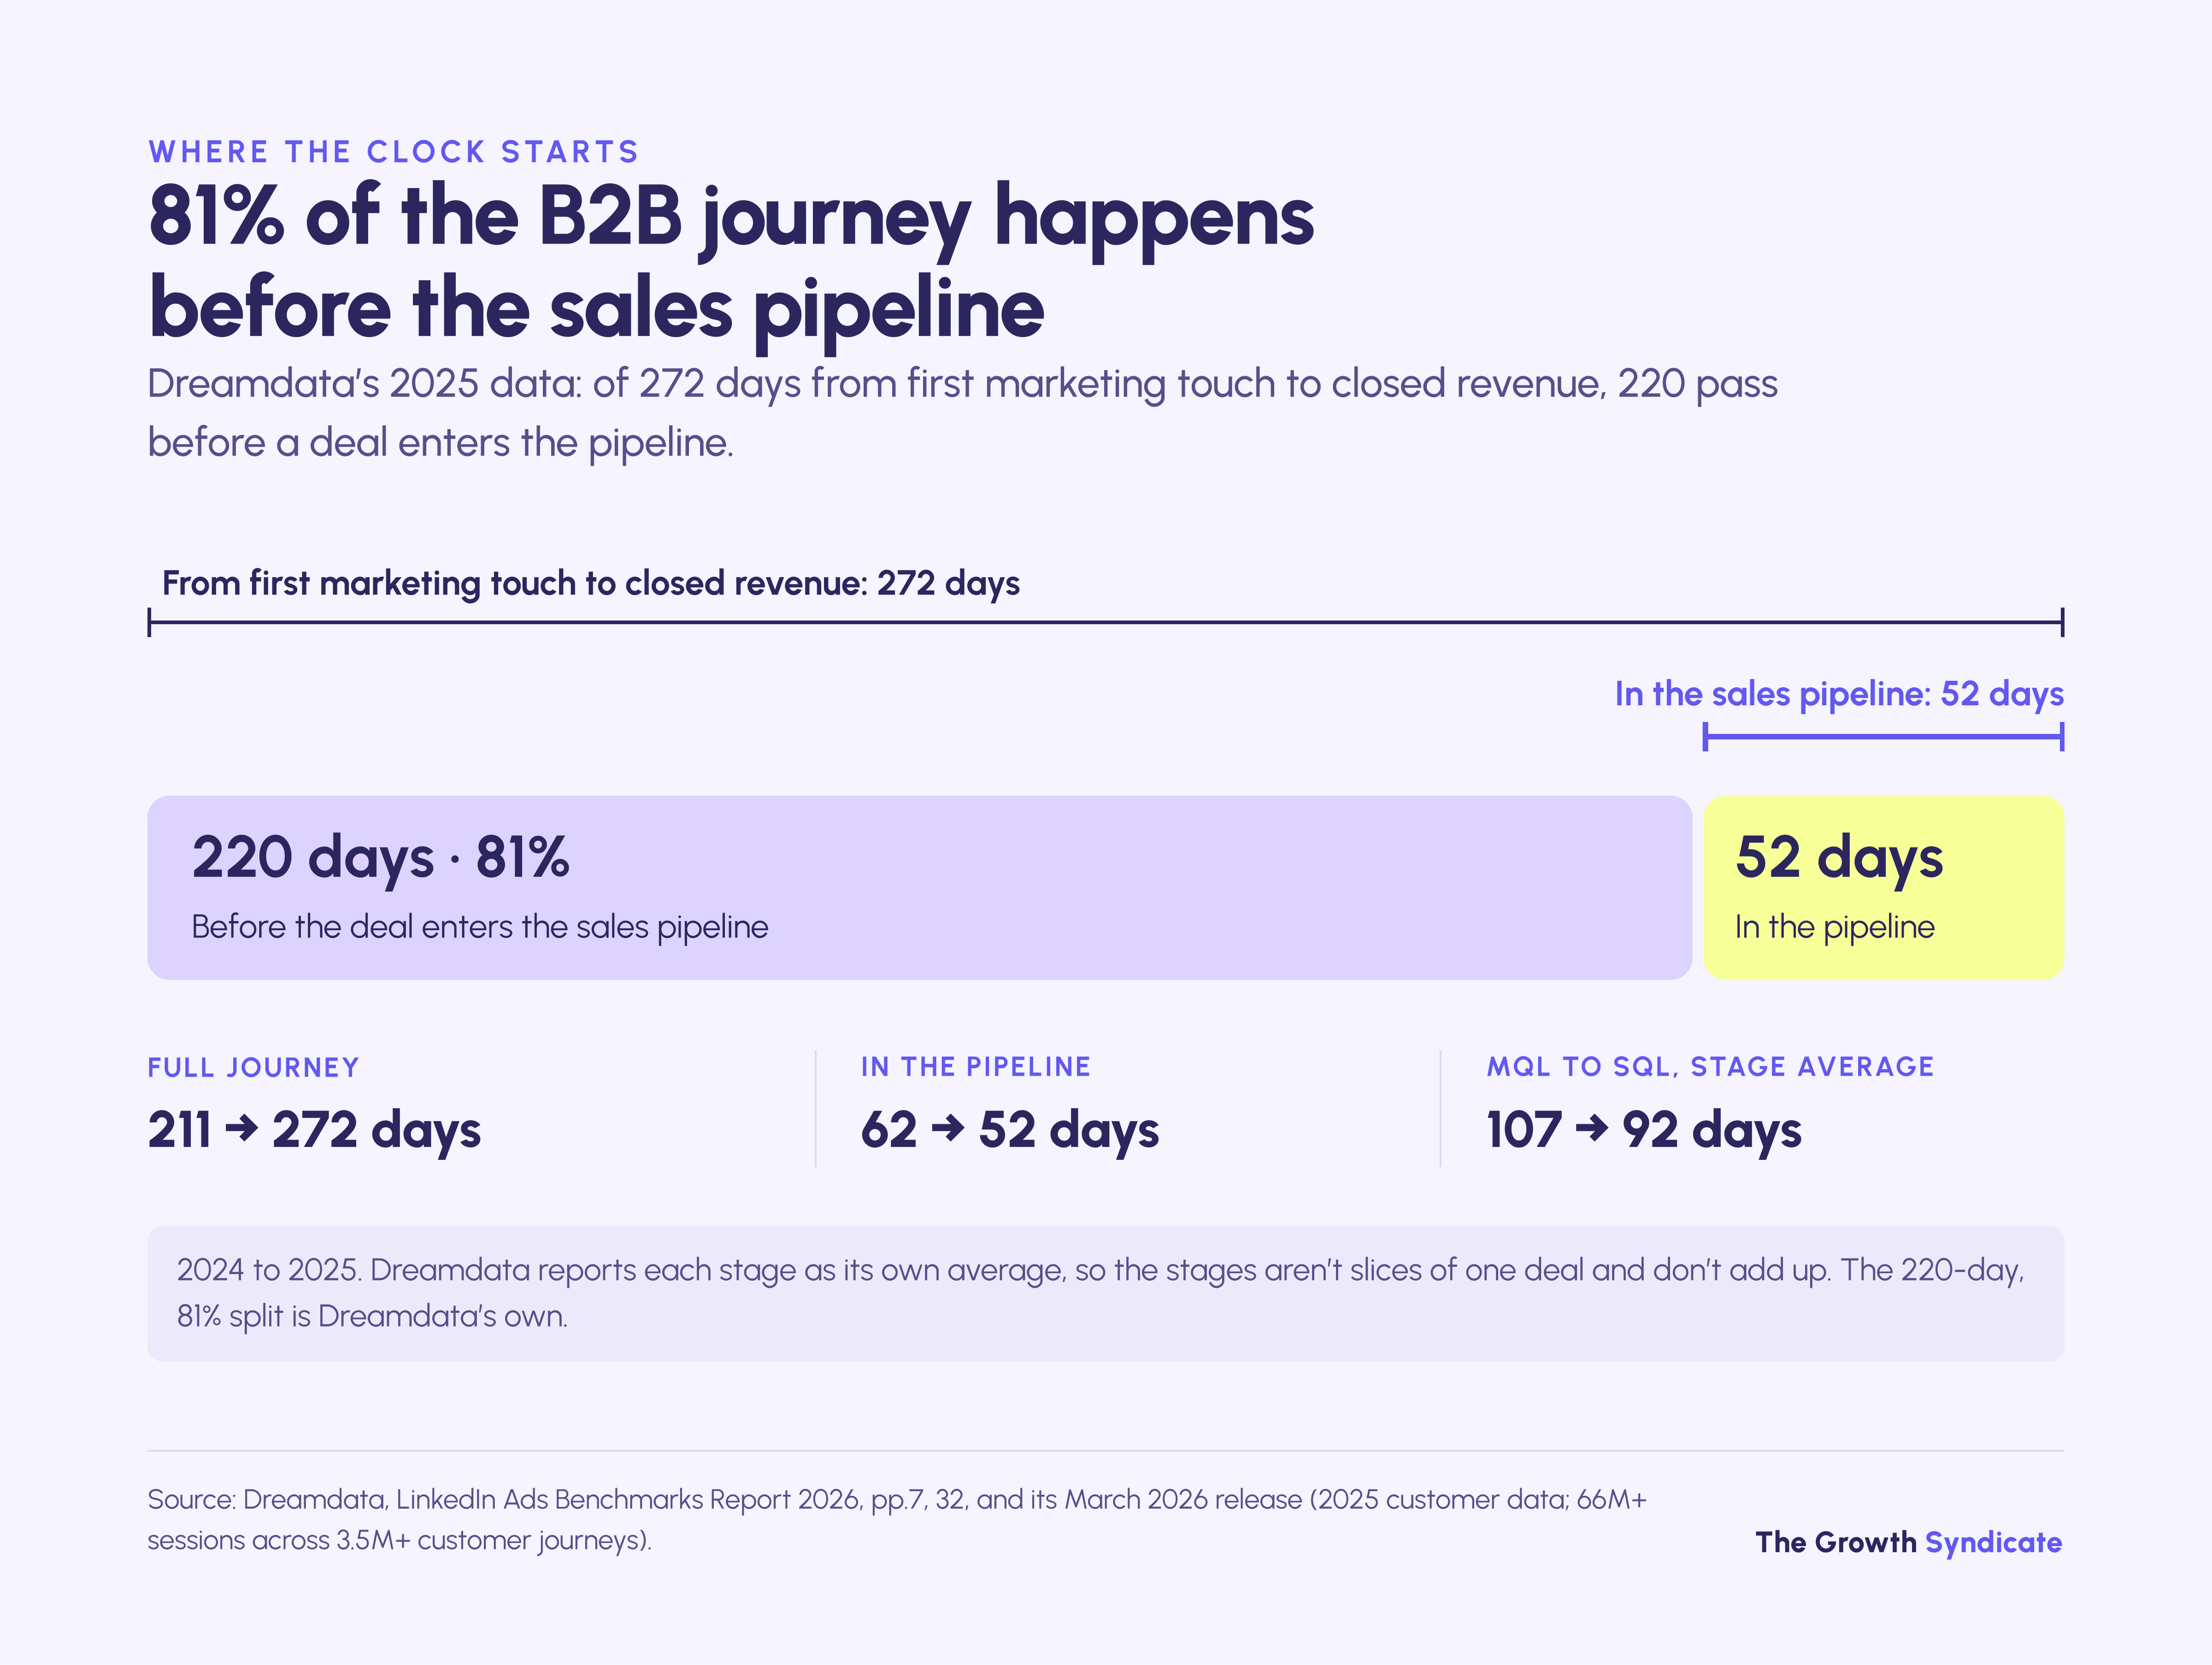
Dreamdata's 2026 report draws on more than 66 million sessions across 3.5 million customer journeys from its customers' data. Between 2024 and 2025 the full journey lengthened from 211 to 272 days, while the average time from MQL to SQL fell from 107 to 92 days and time in the pipeline fell from 62 to 52. Dreamdata's tentative reading is that more of the research, education and internal alignment now happens before a lead becomes an MQL, so buyers reach sales better informed.
Cycles lengthen reliably as deal size grows. Norwest's 2025 survey reports average cycles from about two to three months for deals under $25K ACV to about nine to twelve months above $500K, shorter in 2025 than in 2024, which Norwest reads as a return to 2023 patterns. Across all its respondents, 51% reported an average cycle of three to six months, 27% of seven to twelve months, 15% under three months and 7% over a year.
Company size stretches it further. At large buying companies, which Dreamdata defines as over 250 without naming the unit, the MQL-to-SQL stage alone averaged 220 days in 2025. Buying groups are growing too: Dreamdata found the average deal involved 10 stakeholders in 2025, up from 6.8 in 2024, and Ebsta found sellers engage 8 stakeholders on a new deal against 5 on an expansion.
Long cycles change what a team can report in the first quarter of a program, and a program judged on closed revenue that early will usually look like it failed.
Field note, reporting inside a long cycle: when a client's sales cycle runs to nine months, the first weeks of a new program can't show closed revenue. We agree at the start which deliverables and leading signals we will report until opportunities appear, usually engaged target accounts and booked meetings. The pipeline conversation starts when the cycle allows it, and everyone knows in advance when that is.
What is a good cost per lead in B2B?
A good B2B cost per lead depends heavily on deal size. Norwest's 2025 survey found an average reported cost per lead of $387 for companies selling under $50K in annual contract value, $1,365 at $50K-$100K and $4,129 above $100K. And 41% of respondents could not report a cost per lead at all.
Norwest's figures are averages of what respondents reported, and the survey doesn't define a lead, so read them as orders of magnitude. The pattern is still clear: a lead for a deal above $100K ACV costs more than ten times a lead for a deal under $50K. Among respondents with sales cycles longer than six months, half did not know their cost per lead.
Platform data counts a different thing. Metadata's LinkedIn cost benchmarks put the 2025 median cost per lead at $376 across 88 advertisers. Weighted by spend across 138 advertisers the figure falls to $202, which Metadata itself places at the 26th percentile and calls not typical.
Lead Gen Forms came in at $193 per lead in Metadata's data (97 advertisers), against $346 for landing pages (65). Cost per lead also swings by ad format, from $142 for document ads to $362 for conversation ads, so a single LinkedIn cost benchmark needs the same care as a funnel one.
A cheap lead can still be an expensive deal. Ebsta's 2025 channel-efficiency index, which multiplies win rate by deal size and divides by cycle length, rates partner referrals at 1.3x the average and paid channels at 0.68x. Cost per lead means little until you join it to what those leads became.
What pipeline coverage ratio do you need, and is 3x right?
The pipeline coverage ratio you need is roughly one divided by your win rate, measured by value on pipeline due to close in the period. A 3x rule implies a win rate of about 33%. If Ebsta's 19% new-logo win rate held by value, the same arithmetic would point to about 5.3x, and its 45% expansion rate to about 2.2x.
Coverage needed ≈ 1 ÷ (win rate by value × share of pipeline that closes inside the period)
Three conditions make the formula hold. Win rate has to be measured by value, because coverage is a value ratio. The pipeline has to be due to close in the period, and the win rate has to be measured from the same stage your pipeline counts from.
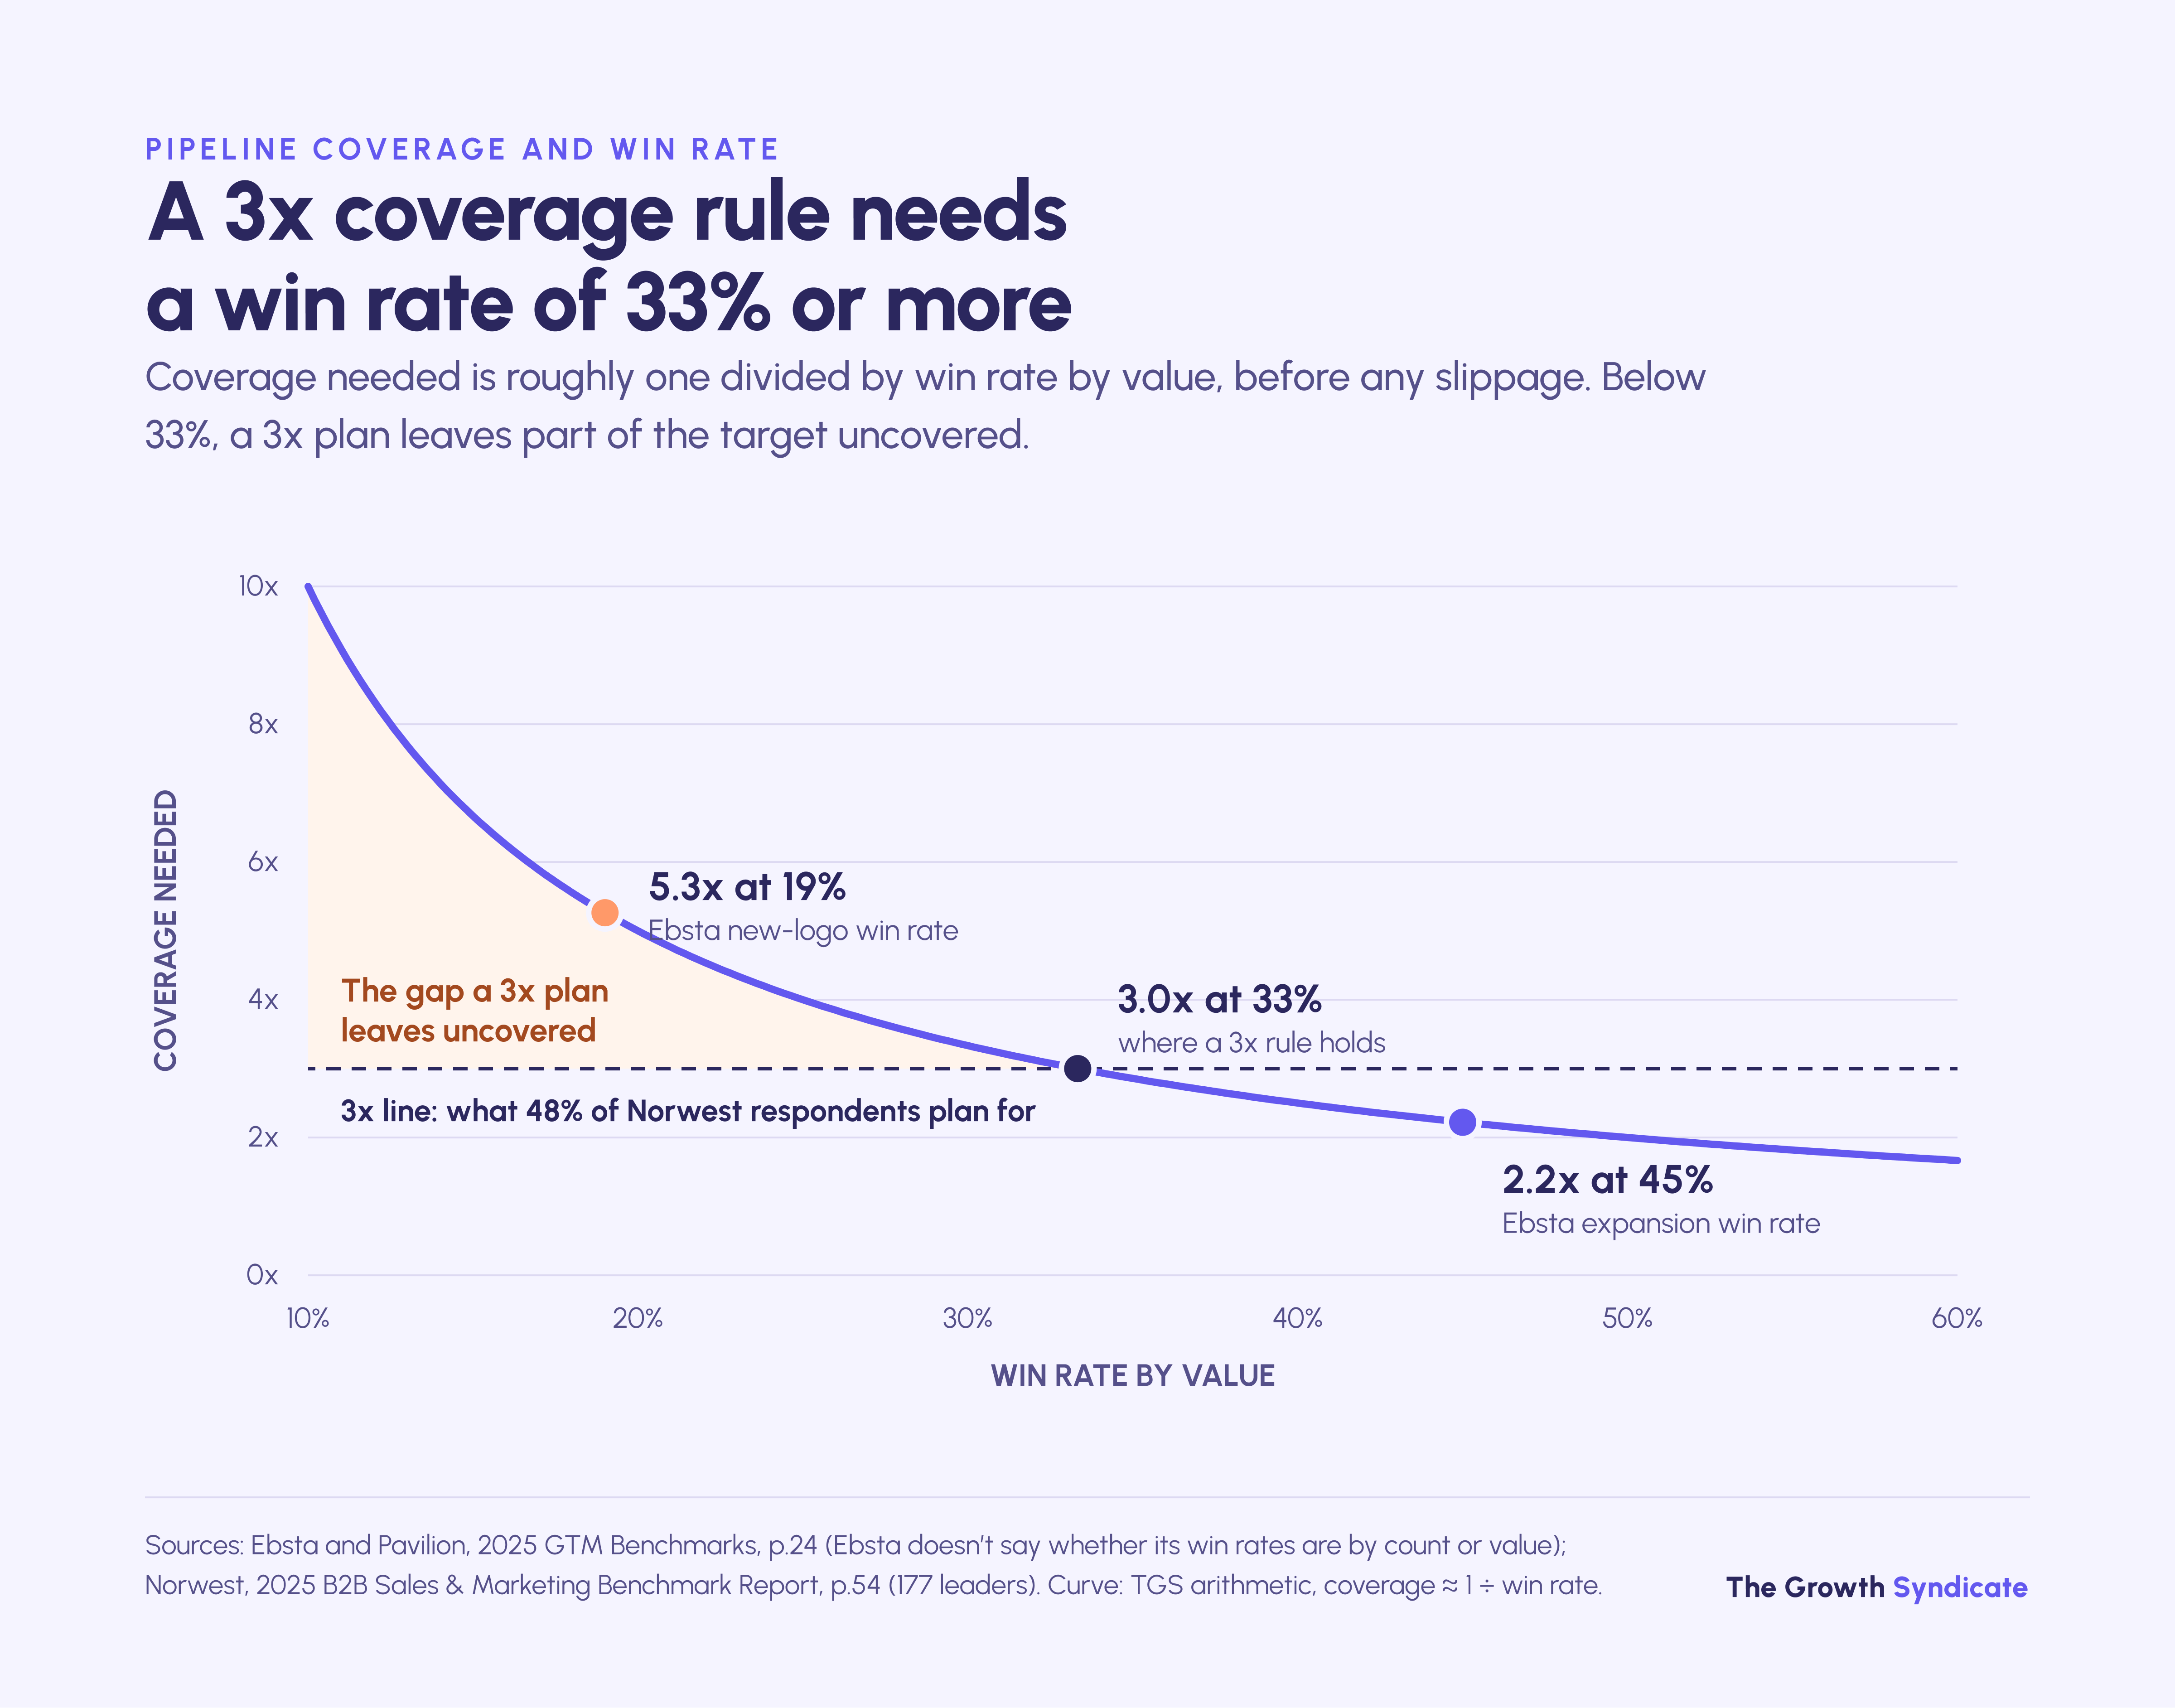
Most teams plan for 3x anyway. In Norwest's 2025 survey, 48% of respondents planned for 3x coverage, down from 54% in 2024, while 31% planned for 4x, 10% for 5x and 7% for 2x.
We could find no documented origin for 3x. Dave Kellogg, then CEO of Host Analytics, wrote in 2013 that he didn't know the history of the rule, and that once a coverage target is institutionalized the pipeline will show it, which says nothing about whether that pipeline converts. His verdict: "Its predictive value is now zero."
Slippage widens the gap. Ebsta's 2025 report found 36% of new-business deals slipped, down from 44% a year earlier, and a slipped deal is pipeline that counted toward this quarter's coverage and closes in a later quarter, if at all. The same report found 78% of sellers missed quota in 2024, up from 69% in 2023.
A worked example: a team with a $1M quarterly target and a 25% win rate by value needs about $4M of pipeline due to close that quarter. If a fifth of that pipeline usually slips into the next quarter, the team needs about $5M.
What should you track instead of MQL counts?
Track pipeline value first, split into what marketing sourced and what it supported, and pair it with cost per opportunity. Most companies already measure it: in Norwest's 2025 survey, 56% of respondents named pipeline value among their top three marketing KPIs, against 38% for MQLs and 16% for win rate.

MQL counts and click-through rates are easy to report and say little about revenue. A team that reports only those tends to lose credibility with the people who sign its budget, however good the numbers look.

Cost per opportunity survives definition changes better than cost per lead, because an opportunity is a CRM record with a value and a close date. At company level, Aleph and Benchmarkit's 2026 benchmarks, which cover 342 B2B SaaS and AI-native companies' 2025 results, put the new-customer CAC ratio at $1.63 of sales and marketing spend per $1 of new-customer ARR, about 19% better than the year before. The median blended ratio, which includes expansion, was $1.30.
For outbound teams, the Bridge Group's 2025 SDR research, drawn from 351 B2B companies, 83% of them SaaS, puts raw pipeline at $3.78M per SDR per year. Spend levels are a separate question from efficiency, and marketing budget benchmarks answer it on their own terms.
Field note, how we report pipeline: we report pipeline in two columns, sourced and supported, because the first tells you what marketing created and the second what it helped move forward. At LangWatch, an AI observability startup, the program influenced 42 deals and €325,250 of pipeline over nine months, about €7,700 per influenced deal by our arithmetic. At Nobel Recruitment, ABM and LinkedIn campaigns influenced €1M of pipeline alongside €1.5M generated inbound.
Is a low MQL to SQL rate a marketing or a sales problem?
In our experience, a low MQL to SQL rate is usually a shared problem that each team sees differently. In Norwest's 2025 survey, sales leaders named poor lead quality as a top challenge almost three times as often as marketing leaders did, 22% against 8%. Ebsta's 2025 data adds that 44% of the contacts sellers deal with never reach the CRM.
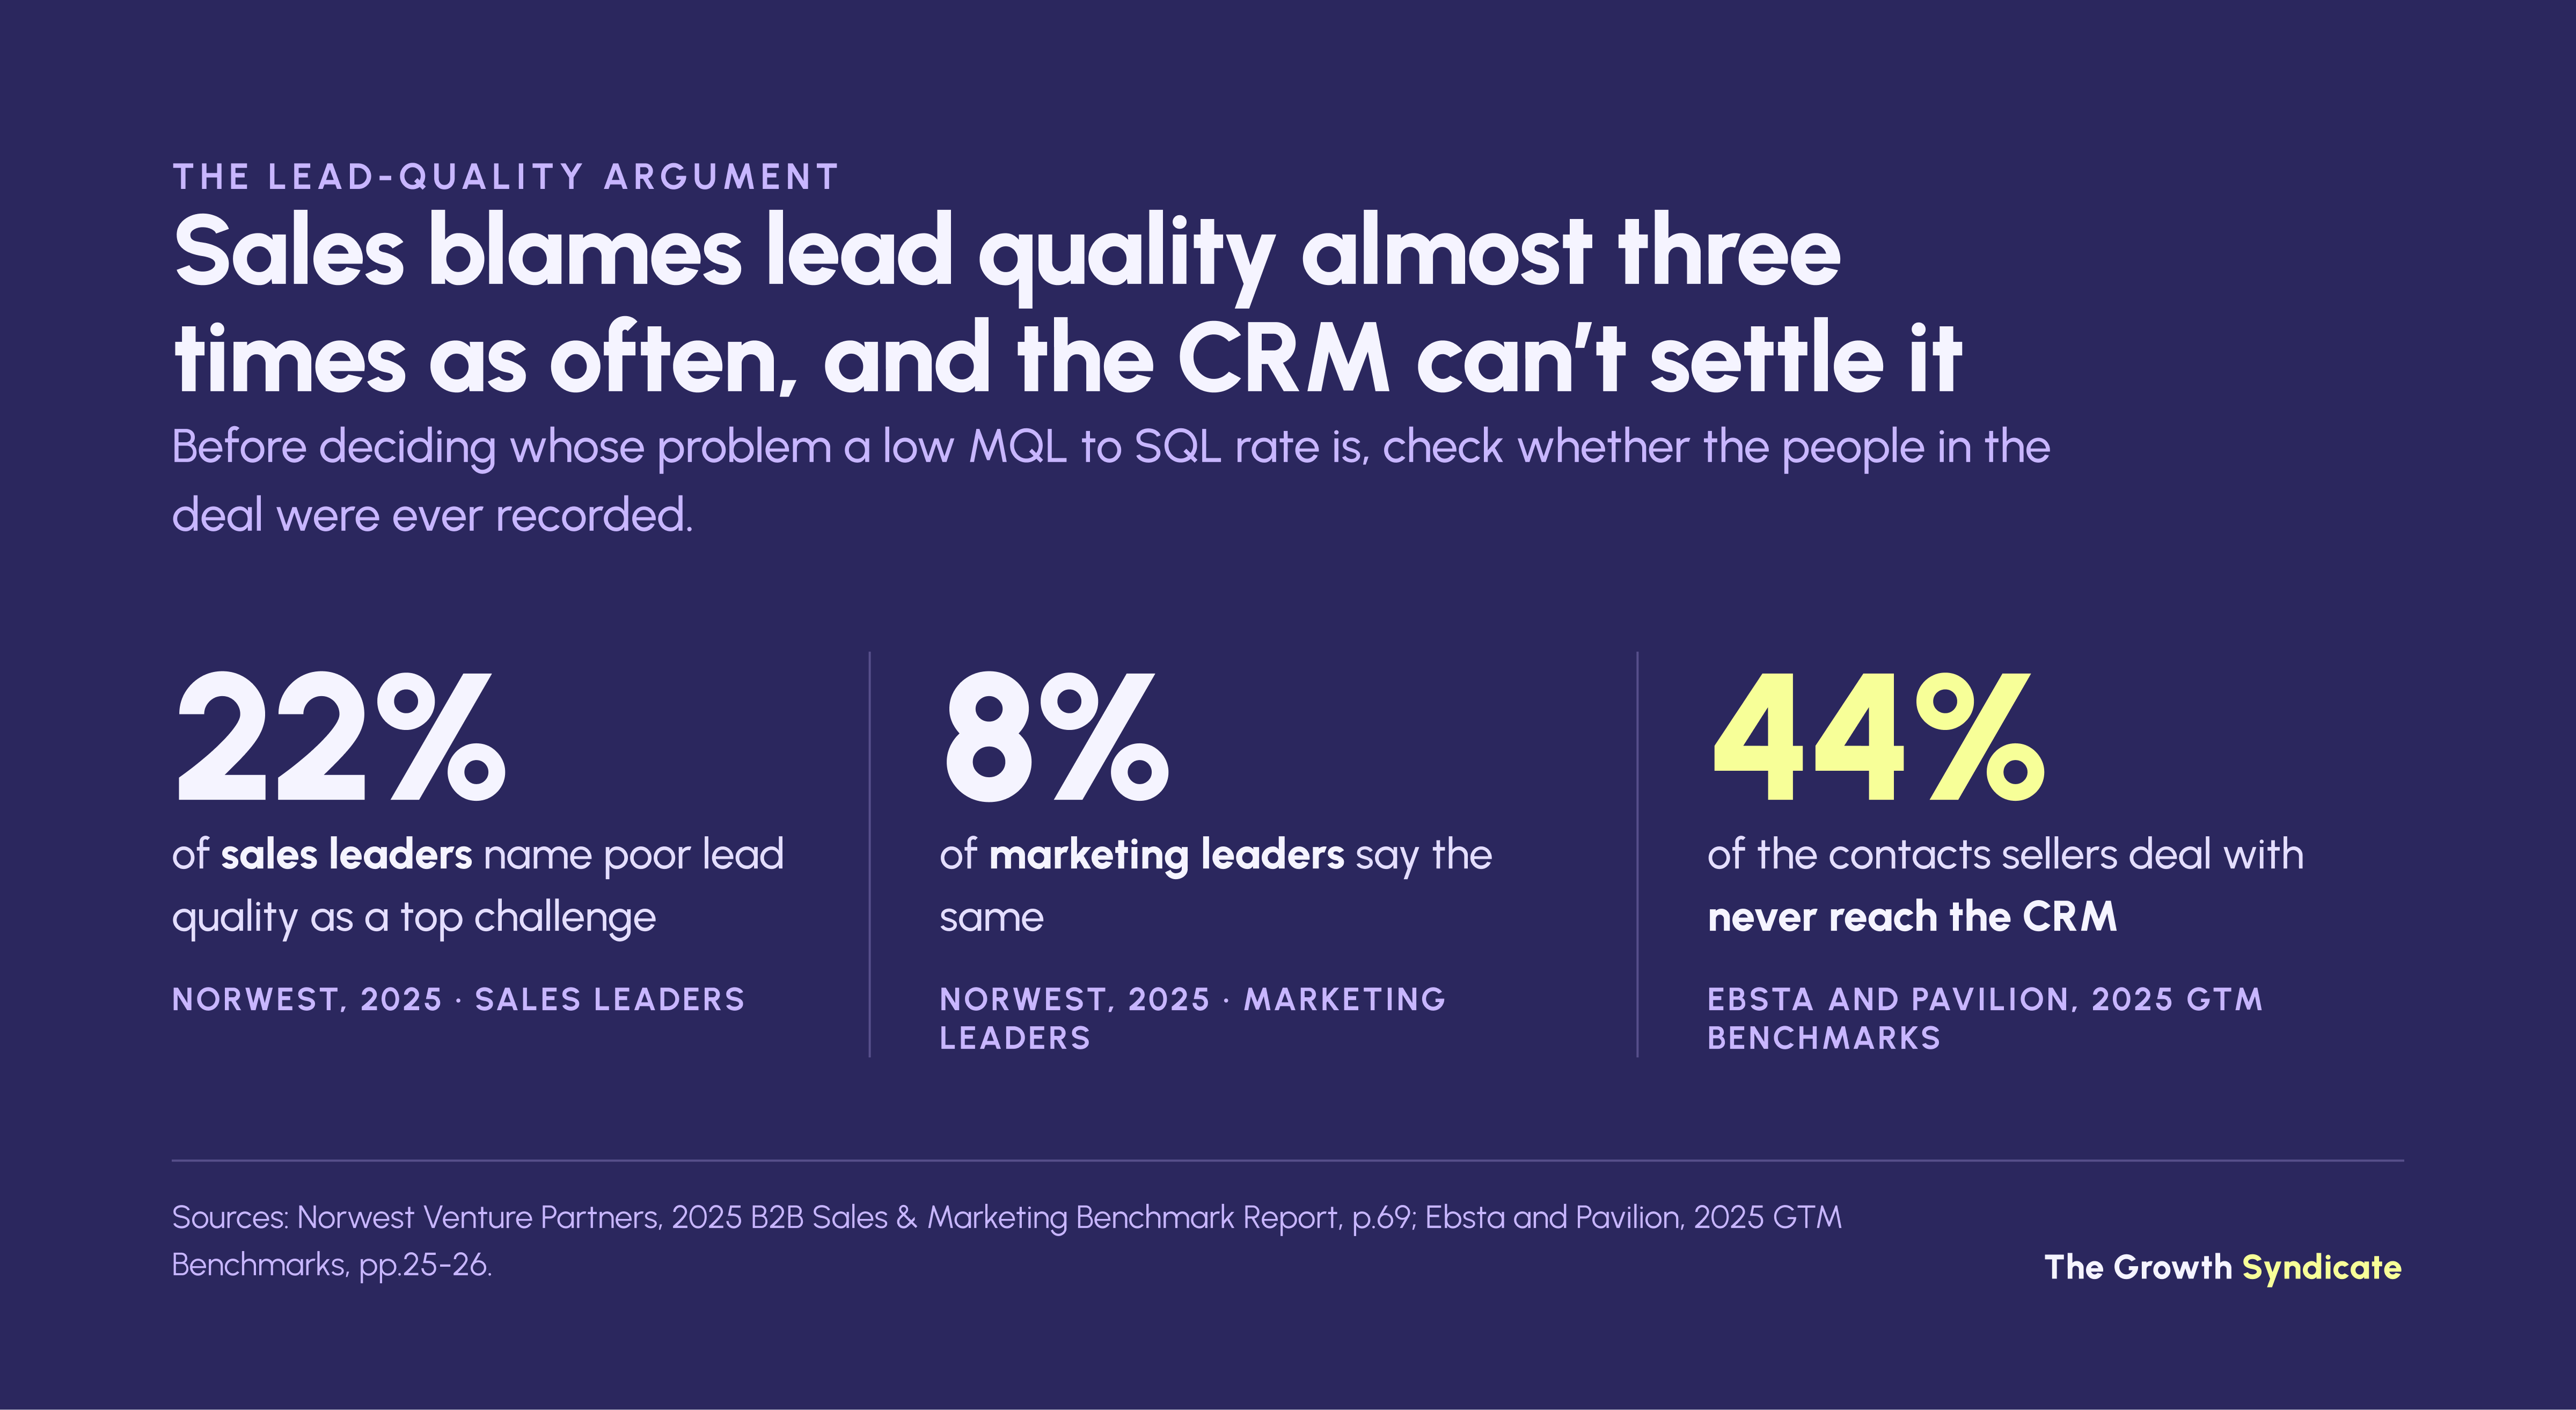
That last figure matters for benchmarking. If almost half the people in a deal never reach the CRM, and a quarter of the missing ones are senior decision makers by Ebsta's count, stage data on both sides of the handover is probably incomplete.
Check five things, in this order, before deciding whose problem it is:
- Definitions. Does the MQL rule match what sales accepts? If the two teams use different rules, the rate measures the gap between them.
- Tracking. Do conversions fire, and do they land in the CRM with a source and a stage?
- Follow-up. Does sales work every lead within an agreed time? When a whole sales team misses, the leads may be poor or mis-staged, but only if every lead was worked.
- Later stages. Where do opportunities die: discovery, proposal or negotiation? Losses that cluster late tend to point at the sales process rather than at the leads.
- Product and price. If deals stall at the same objection, the gap may be in the offer rather than in either team.
The lasting fix is usually organizational: shared targets and one definition of each stage, which is what sales and marketing alignment means in practice.

"Pipeline tells you whether the work actually works. You can run a lot of busy work and get traffic and soft metrics, but no pipeline means there's a gap somewhere, often in the product, pricing or user experience rather than marketing. Owning pipeline means finding that gap honestly instead of pointing fingers."
Field note, Cutr: at Cutr, a manufacturing marketplace, it took 9-12 cold calls on average to book a meeting when we started. After we ran LinkedIn ads and thought leadership at the same accounts sales was calling, that fell to 4-5 calls, with 40-50 qualified meetings a month by the case study's count. The case study credits the drop to that marketing-assisted outbound play, with the ads priming accounts before sales called.
How does your funnel compare?
Compare your funnel stage by stage, using trailing 12-month totals rather than one month's flow, and against a benchmark that counts the same thing. Divide each stage's output by its input over the same 12 months, then set each rate against the medians and middle-half ranges above, starting with the stage furthest below its range.
A spreadsheet with one row per stage does the same job: put each stage's rate next to its middle-half range from the first table on this page.
Use 12 months because monthly ratios mix cohorts. With a 91-day average new-business cycle, a typical deal closing this month was opened about a quarter earlier, so dividing this month's wins by this month's opportunities measures timing, not conversion.
Before trusting any comparison, check that the numbers going in are real. Benchmarking fails at the input when conversions aren't tracked or the CRM's lifecycle stages don't match what either team believes they mean. That is also where our RevOps and CRM work starts, because a benchmark is only as good as the stage data under it.

"On any new engagement, the first thing I check is operational, not creative. Is the website tracked, are conversions set up and connected to the paid channels, and where do they go once they fire? Only then the CRM, which is almost always a mess because nobody owns it."
Which funnel statistics are unreliable?
Some of the most quoted funnel statistics have the weakest sourcing. The oldest source we found for the "13% average MQL to SQL rate" is a 2014 lead-to-opportunity figure from Implisit, and the "84-day sales cycle" matches that same dataset's lead-to-opportunity time. We found no documented origin for the "3x pipeline coverage" rule.
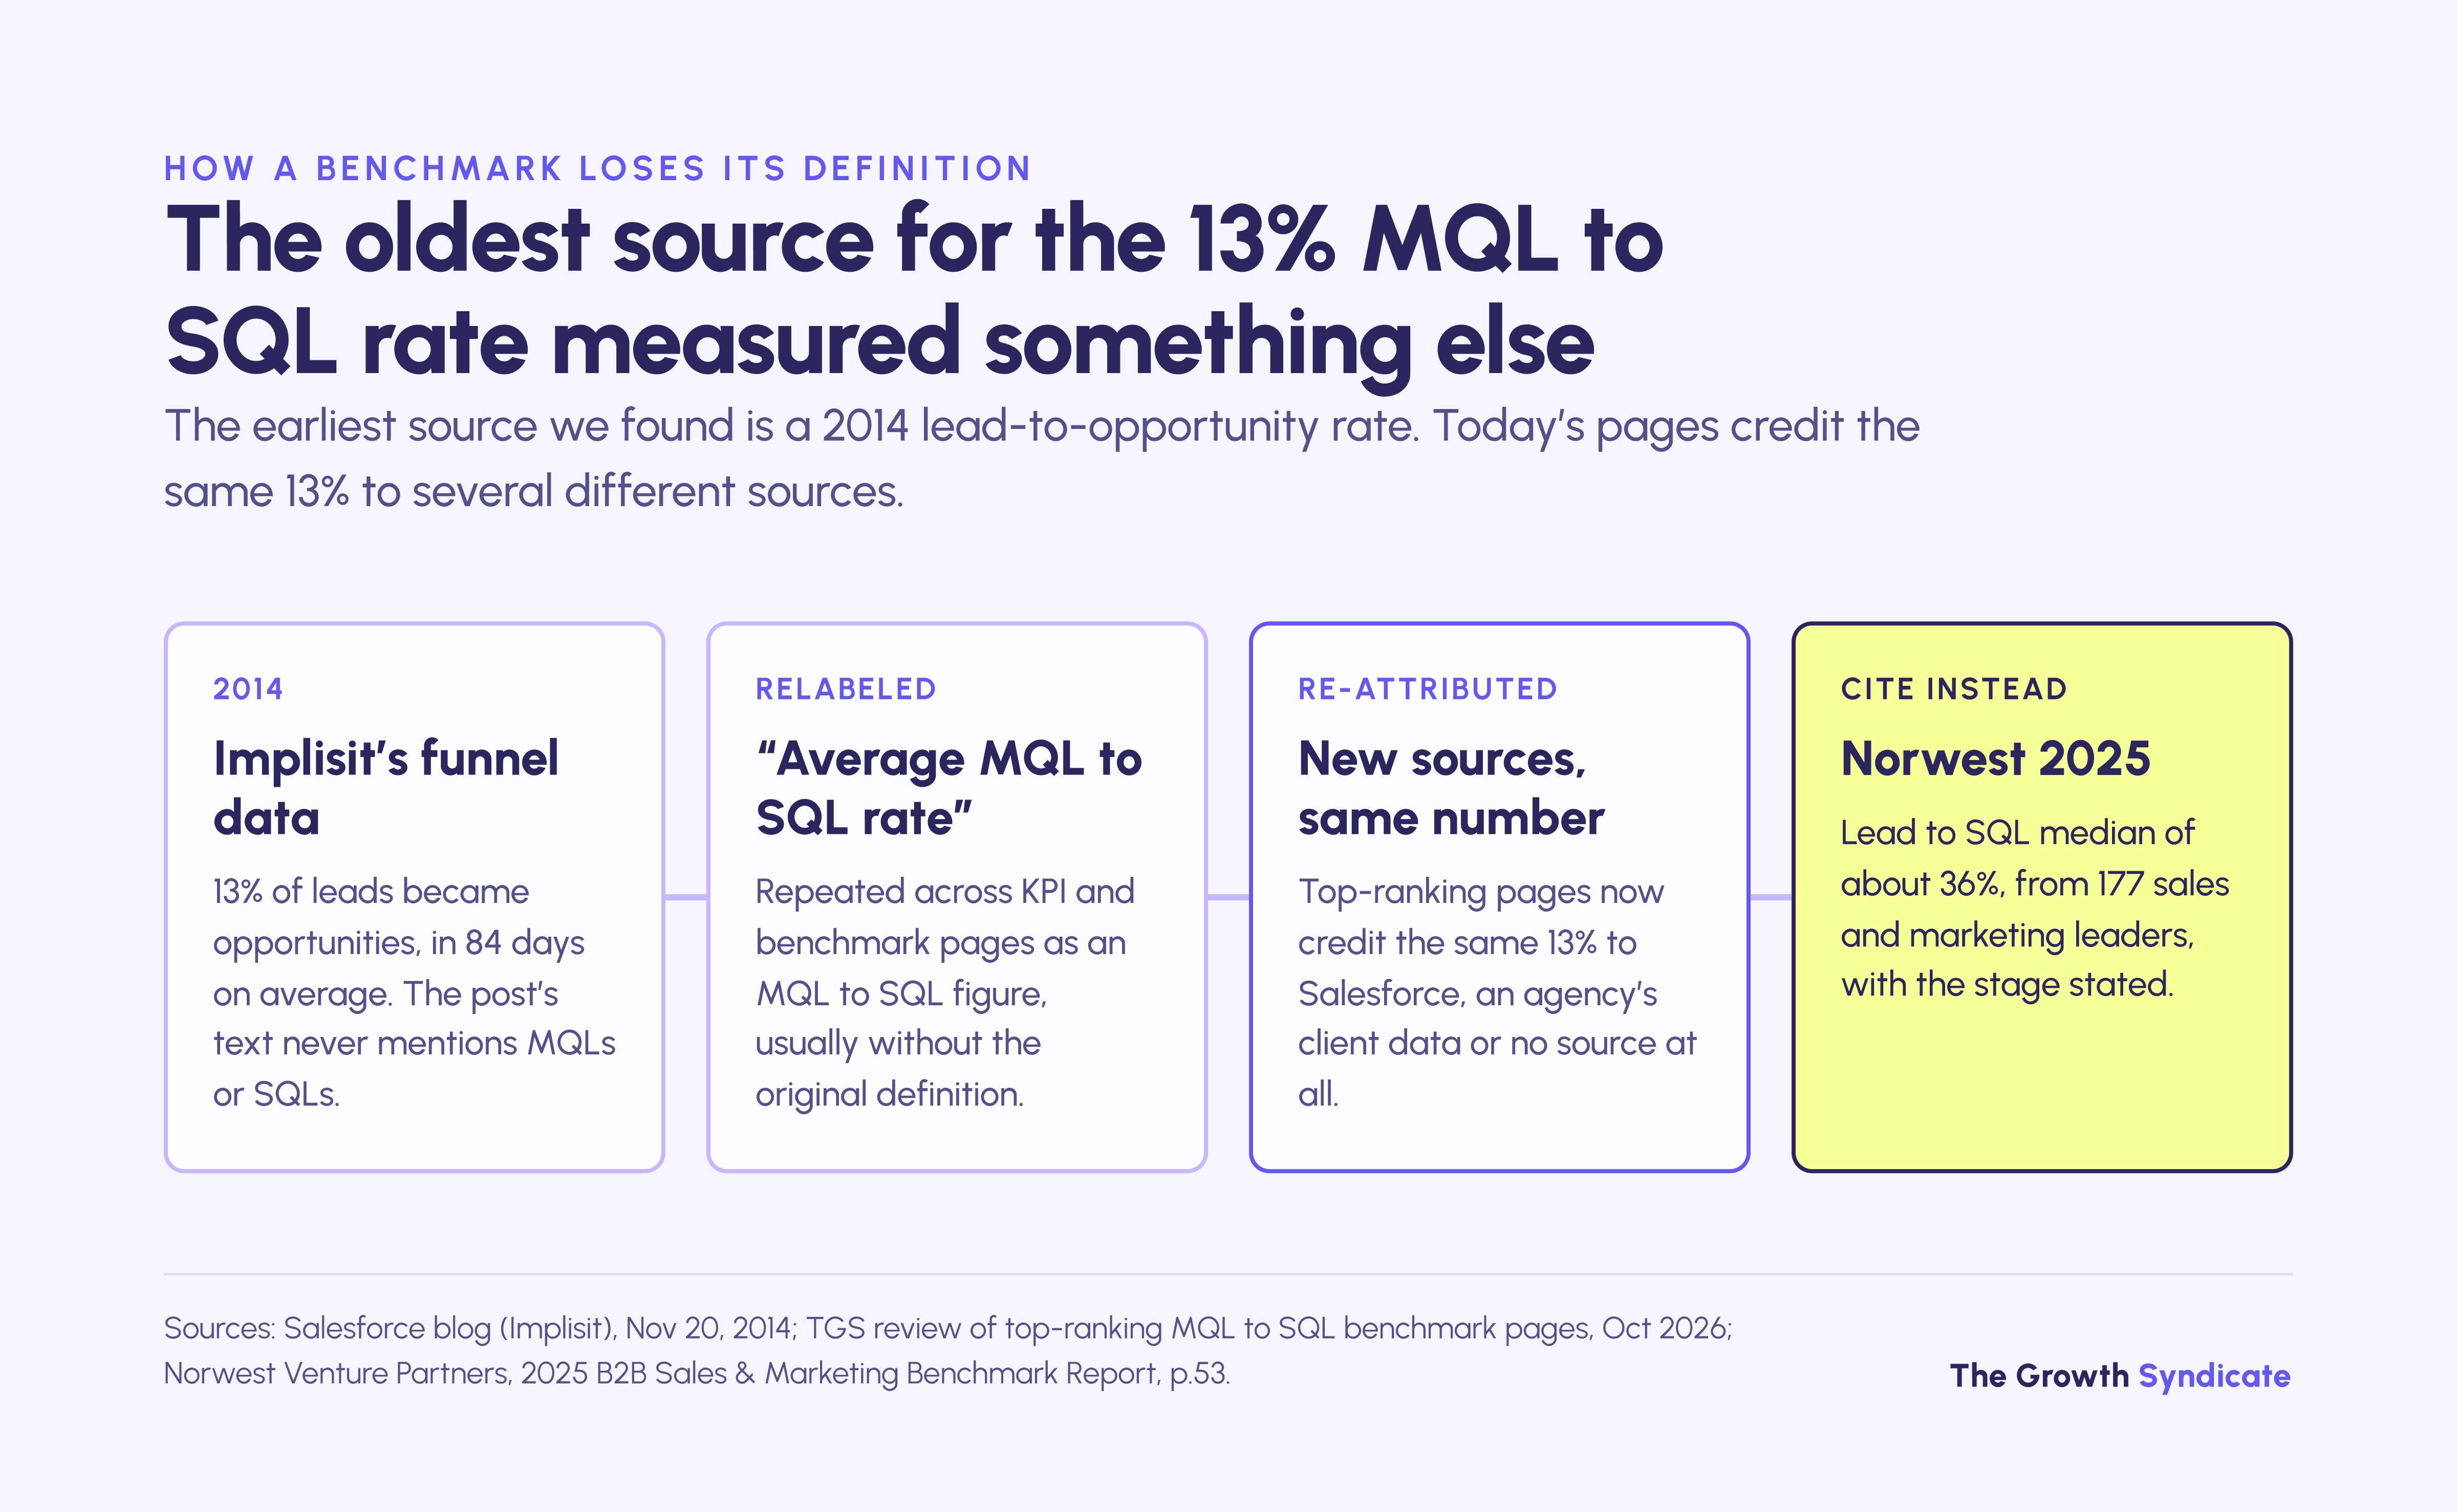
Implisit's figures appeared in a Salesforce blog post in November 2014, based on anonymous lead data from "hundreds of companies". The post reported that 13% of leads became opportunities, taking 84 days on average, and that 6% of opportunities became deals. Its text never mentions MQLs or SQLs, yet 13% is still the headline figure on most of the top-ranking "MQL to SQL" benchmark pages we checked in October 2026, credited to Salesforce, First Page Sage or no source at all.
Each of these figures may once have described something real. The trouble starts when a number loses its definition on the way to a slide, and then gets used to judge a funnel that counts something else.
Where these benchmarks break down
These benchmarks mostly describe venture- and PE-backed B2B companies in North America and Israel, UK and US tech firms, and vendors' own customer bases, measured through surveys or one vendor's data. None of them reports European mid-market firms or services businesses separately, and none can tell you whether your own numbers are measured correctly in the first place.
- No defined cross-company MQL to SQL rate, and no cost per opportunity. None of the primary sources we found publishes either; Ebsta shows an MQL-to-SQL figure without defining it, so lead to SQL stands in as the nearest proxy.
- No European breakdown. Norwest surveys North America and Israel, Ebsta's own summary describes UK and US tech firms, and Dreamdata doesn't break out regions.
- Self-reported numbers. Norwest's figures are what leaders reported; the middle-half ranges are our reading of its buckets.
- Vendor datasets. Ebsta's figures describe pipeline data Ebsta analyzed, without saying how the companies were chosen, and Dreamdata's and Metadata's describe their own customers.
- Motion matters. High-volume, trial-led funnels convert very differently from sales-led enterprise ones, and a median blends them.
- Single-company results. Our case-study figures show what moved at one company each, which proves a number can move but sets no benchmark.
What to do next with your funnel numbers
Start with the stage furthest below its range, and check how that stage is defined and tracked before you change a campaign or a target. Fixing a measurement is usually faster and cheaper than changing a campaign, so that check comes first. The five situations below cover the most common readings.
- If your MQL to SQL rate looks low, compare the MQL rule with what sales actually accepts before you touch campaigns.
- If your win rate sits near 20%, plan coverage closer to 5x than 3x, or work on win rate before buying more pipeline.
- If your cycle looks long, measure it from opportunity creation before you compare it with anyone's benchmark.
- If you can't report cost per lead, start with cost per opportunity. Of the companies in Norwest's survey, 41% couldn't report cost per lead either.
- If two teams report different numbers for the same stage, fix the lifecycle stages in the CRM first.
Frequently asked questions
How do you calculate MQL to SQL conversion rate?
Divide the number of SQLs by the number of MQLs from the same period, then multiply by 100. Use trailing 12-month totals, or follow one month's MQLs until they convert or age out, because a single month's ratio mixes leads created at different times. Report the MQL definition next to the rate, so others know what it counts.
What is a good lead-to-customer conversion rate?
At Norwest's 2025 median stage rates, about 2.7% of leads become customers, or roughly one in 37. That figure is our multiplication of four medians, so treat it as an order of magnitude. Companies that count only high-intent leads, such as demo requests, tend to convert well above it, and companies that count every contact tend to sit below.
How can you shorten a B2B sales cycle?
You can't pull a buyer's need forward, but you can work on the stretch after a deal reaches sales. Dreamdata's 2026 report shows the two moving apart: in 2025 the full journey grew to 272 days while time in the sales pipeline fell to 52. In Ebsta's 2025 data, top performers, who don't discount, cut negotiation time by 24%.
What is the difference between an MQL and an SQL?
An MQL is a lead marketing flags as worth sales' attention, and an SQL is one sales has accepted as a real sales conversation. The difference is who decides. Because companies define MQLs in at least four different ways, the conversion rate between the two stages varies widely from company to company.
Is MQL better than SQL?
Neither is better, because they measure different things. An SQL carries more weight as a pipeline signal because sales has accepted it, and in Norwest's 2025 survey pipeline value outranks MQLs as a marketing KPI, 56% to 38%. In high-volume, trial-led motions, an MQL count can still be a useful early signal of demand.
Is a 2.5% or 12% conversion rate good?
It depends which rate: as a lead-to-customer rate, 2.5% sits close to the roughly 2.7% that Norwest's 2025 medians imply, and 12% would be far above it. As an MQL-to-SQL rate, 2.5% falls in Norwest's lowest lead-to-SQL bucket and often means the MQL rule counts almost every contact. Website conversion is a different measure and needs its own benchmark.
Why does cost per lead vary so much?
Cost per lead varies with deal size and with what counts as a lead. Norwest's 2025 survey shows leads for deals above $100K ACV costing more than ten times those under $50K. An average of survey answers also rarely matches a figure from a single ad platform, because the two count leads differently.
Are B2B sales cycles getting longer?
It depends which part you measure. Dreamdata's 2026 report shows the full journey from first touch to closed revenue growing from 211 days in 2024 to 272 in 2025, while time in the sales pipeline fell from 62 to 52 days. Norwest's 2025 survey found average cycles by deal size shorter than in 2024, which it reads as a return to 2023 patterns.
How often should you re-benchmark your funnel?
Recalculate your own stage rates every quarter on trailing 12-month totals, and check them against external benchmarks once a year, when the main reports refresh. Norwest and Dreamdata report annually, and Fullcast, which acquired Ebsta in 2025, also put out a mid-year update. A rate that moves right after a definition change is not a trend, so log definition changes next to the numbers.
How we verified these benchmarks
Every figure on this page comes from a source we opened and read, graded by how it was produced. Primary reports with a disclosed sample and method from the last 24 months rank highest, vendor datasets carry a customer-base caveat, and agency client data appears only as an example of disagreement, never as a benchmark.
Context figures from 6sense, Gartner, Forrester and HubSpot, and Dave Kellogg's 2013 post, are linked where they appear. We grade sources A to C, plus H: A for a primary, current source with sample and method disclosed, B for a primary source with a gap such as a vendor's own customer base, C for unconfirmed or agency client data cited only with a caveat, and H for historical sources used only to trace a figure.
Norwest's survey covers North America and Israel, and Ebsta describes its data as UK and US tech firms, so none of the headline figures here describes European companies specifically. Ebsta's benchmarks, now published by Fullcast, have since had a mid-2025 update and a 2026 edition; both are gated and we haven't read them, so the Ebsta figures here come from the 2025 report. We refresh this page when the main reports publish new editions, and each update is logged below.
Changelog: October 2026, first published.