


A good B2B cost per lead in 2026 sits anywhere from $67 to $524, depending on whose dataset you read and what it counts as a lead, which makes cost per lead a poor yardstick for paid media. On published paid-search funnel rates, about 3.6% of leads become sales opportunities, so a $150 lead costs roughly $4,200 per opportunity. Whether that pays depends on your deal size.
Key takeaways
- Published 2026 figures put B2B cost per lead between $66.69 (LocaliQ, median across all US industries) and $524 (Metadata.io, spend-weighted across B2B advertisers on Google Ads), a 7.9x spread between datasets that define a lead, count costs and sample advertisers differently.
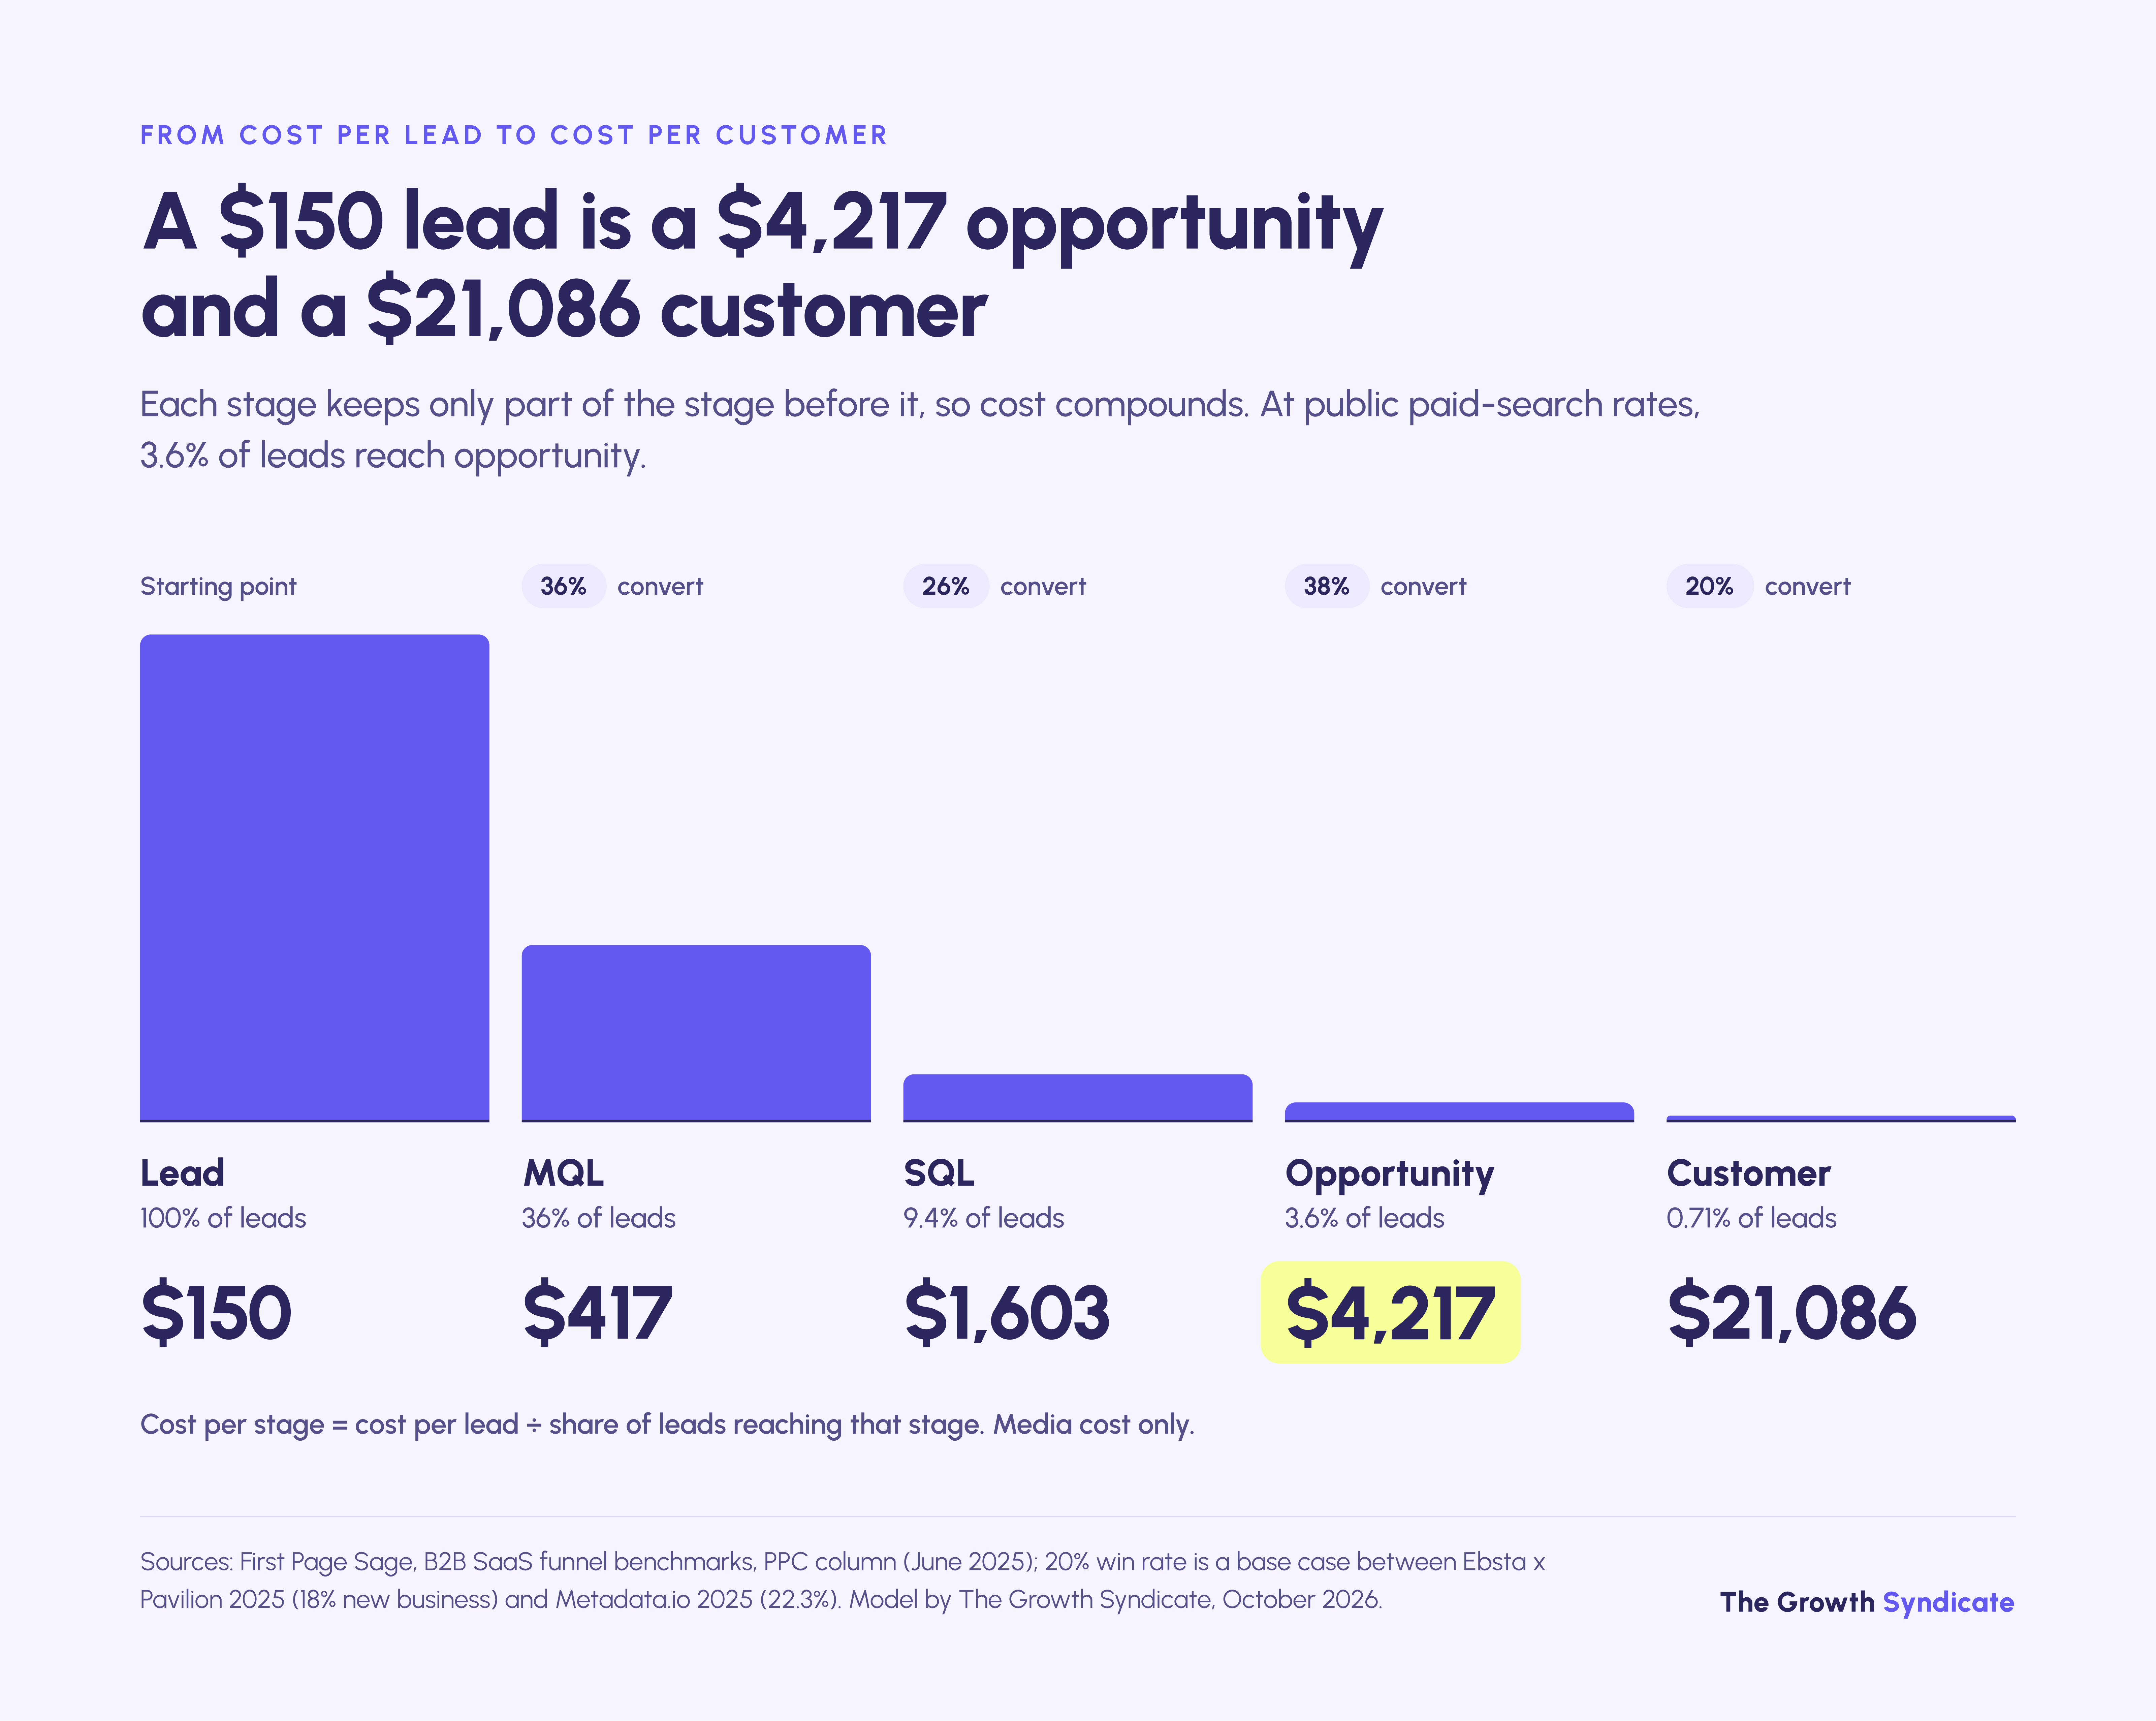
- At public paid-search stage rates (36% of leads to MQL, 26% of MQLs to SQL, 38% of SQLs to opportunity), a lead reaches opportunity 3.6% of the time, so cost per opportunity runs about 28x cost per lead.
- For a 12-month payback at 75% gross margin and a 20% win rate, a paid-search lead can cost at most about $53 at a $10,000 ACV, $267 at $50,000 and $1,334 at $250,000.
- Size the budget from the opportunities your sales team can work each month, then check it clears Google's Target ROAS floor of 15 conversions in 30 days, which costs $7,860 a month at a $524 lead.
Where these numbers come from. The article combines six vendor and agency datasets published in 2025 and 2026 with Google's own bidding documentation and findings from two TGS research reports. Each figure names its dataset, year and sample, and most come from vendors reporting on their own customers, so they show direction more reliably than precise values.
The cost-per-opportunity model is our arithmetic on those published rates, and you should replace every borrowed rate with your own CRM data once you have it.
General funnel figures for email, organic search and sales cycles sit in our B2B marketing benchmarks for 2026, which keeps this page to paid media.
What is a good B2B cost per lead in 2026?
A good B2B cost per lead is one your deal economics can carry, and public 2026 data puts the going rate anywhere between $67 and $524. LocaliQ's median across all its search advertisers sits at the low end. Metadata.io's spend-weighted figure for B2B advertisers on Google Ads sits at the high end.
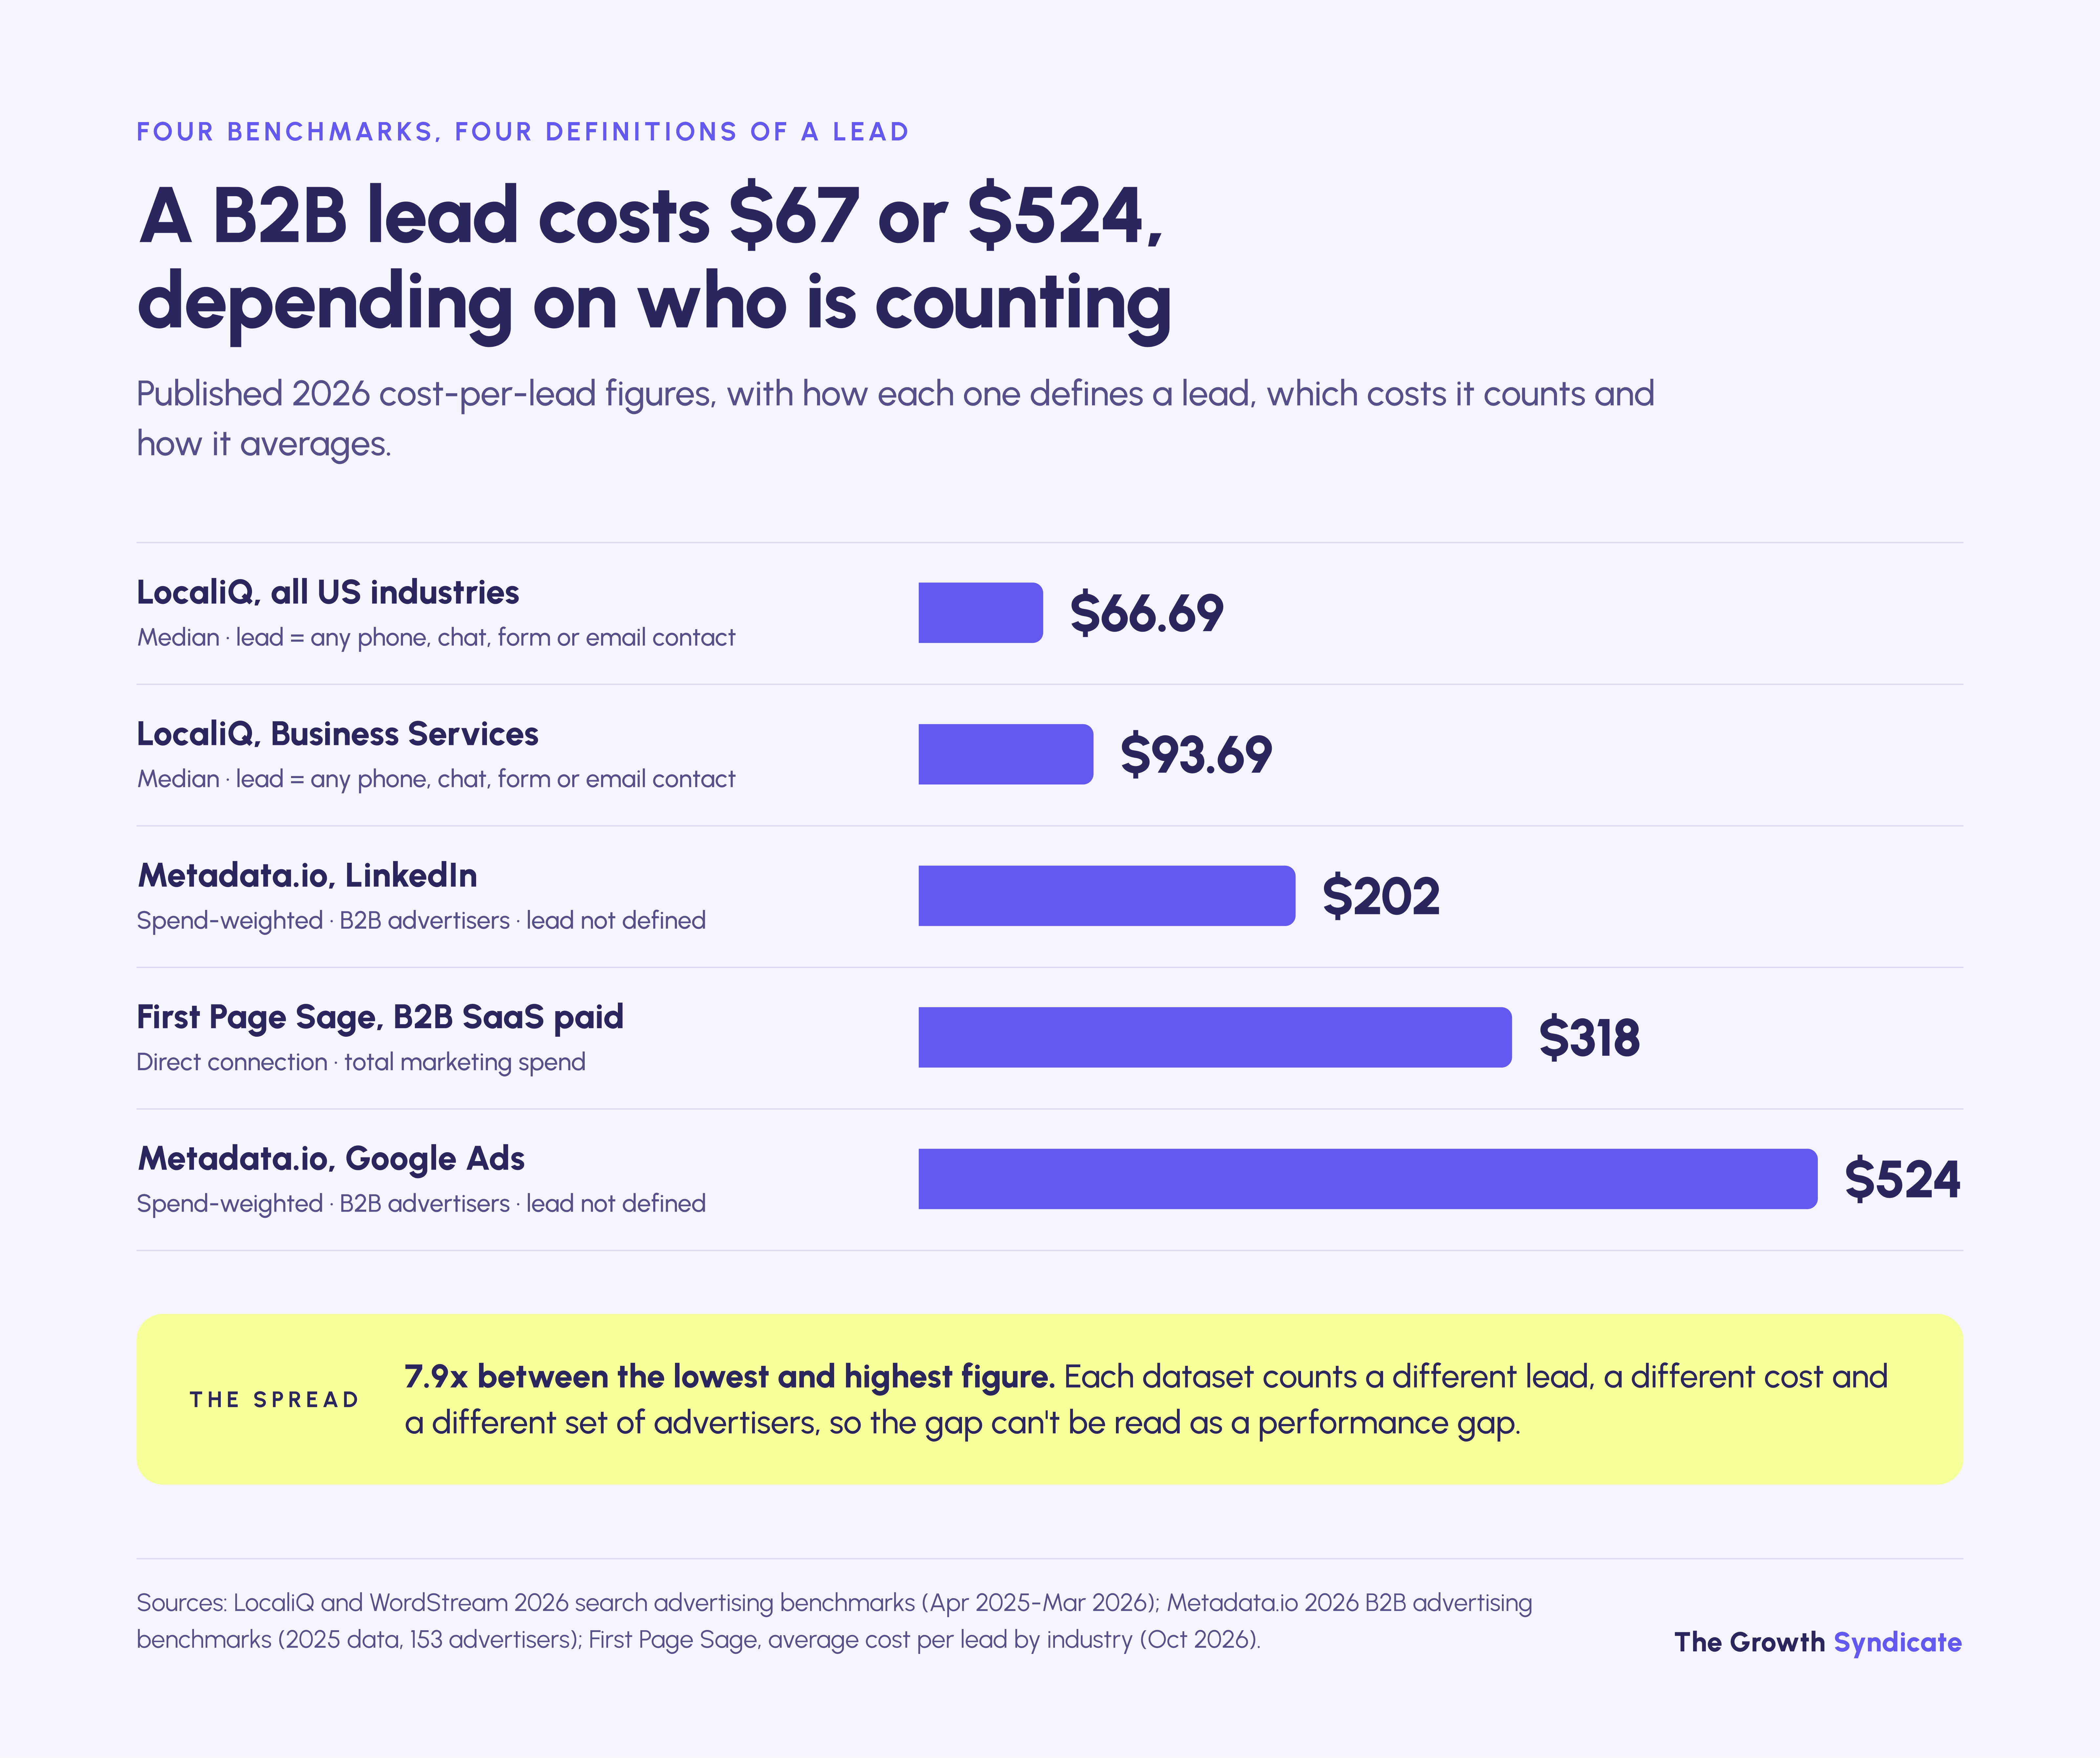
Four published figures show how wide the range is. LocaliQ's 2026 search benchmarks put the median all-industry cost per lead at $66.69 and the Business Services median at $93.69, and LocaliQ defines a lead as any contact by phone, chat, form or email. First Page Sage's October 2026 report puts paid cost per lead for B2B SaaS at $318, calculated as total marketing spend divided by new leads, without saying which paid channels or costs that spend includes.
At the top, Metadata.io's 2026 benchmark of 153 B2B advertisers and $57.6M of 2025 spend puts a spend-weighted Google Ads lead at $524. All four can be correct at once, because they answer four different questions.
The practical answer to "is my CPL good?" therefore starts with a second question: good compared with which definition of a lead? A $150 demo request and a $150 ebook download carry the same label and very different odds of becoming revenue. The rest of this article converts cost per lead into the number that settles the question, which is what each sales opportunity costs.

What does a B2B click and lead cost by channel?
On spend-weighted 2025 data from 153 B2B advertisers, a Google Ads lead cost $524 and a LinkedIn lead $202, with Facebook at $145 and Instagram at $138. Clicks tell a different story. Google and LinkedIn both cost close to $10 a click, but LinkedIn turned 5.9% of clicks into leads against 1.9% on Google.
The two Google rows disagree by 7.9x, and both are right. LocaliQ and WordStream's 2026 benchmarks cover 13,474 US search campaigns run between April 2025 and March 2026 across 23 industry categories, report medians, and define a lead as any contact by phone, chat, form or email. Metadata describes all 56 of its Google advertisers as B2B, and it weights its channel figures by spend.
Retargeting is not automatically the cheap end of a program. On LinkedIn, Metadata.io measured $234 per retargeting lead against $194 for prospecting, while Facebook ran the other way at $120 against $166.
We found no published B2B cost-per-lead benchmark for ChatGPT Ads. In the campaigns we ran for B2B clients, click-through rates landed between 0.62% and 1.63% across manufacturing, healthcare and SaaS, with zero clicks for fintech. Those tests, and what they taught us about running ChatGPT Ads for B2B, are too young to produce a cost per lead anyone should budget against.
YouTube and display are missing from the table for a similar reason: no 2025 or 2026 primary B2B dataset we could verify publishes a cost per lead for them, and consumer averages would mislead.
Why do published B2B CPL averages mislead?
Published B2B CPL averages mislead because they count leads at first contact, before sales has qualified anyone. Two datasets can both be accurate and differ by 7.9x while saying nothing about what a lead your sales team would accept costs. Four distortions sit between a published benchmark and your own numbers.
"Lead" means four different things
Each public dataset draws the line in a different place, and two of them count different costs as well. First Page Sage, for example, divides total marketing spend by new leads, while LocaliQ and Metadata.io report ad spend.
Metadata.io publishes how it calculates cost per lead but not what counts as a lead. Where a company sets the line between a lead, an MQL and an SQL decides how flattering its cost per lead looks, which is why B2B lead qualification has to be settled before any benchmark comparison means anything.
Averages hide the typical advertiser
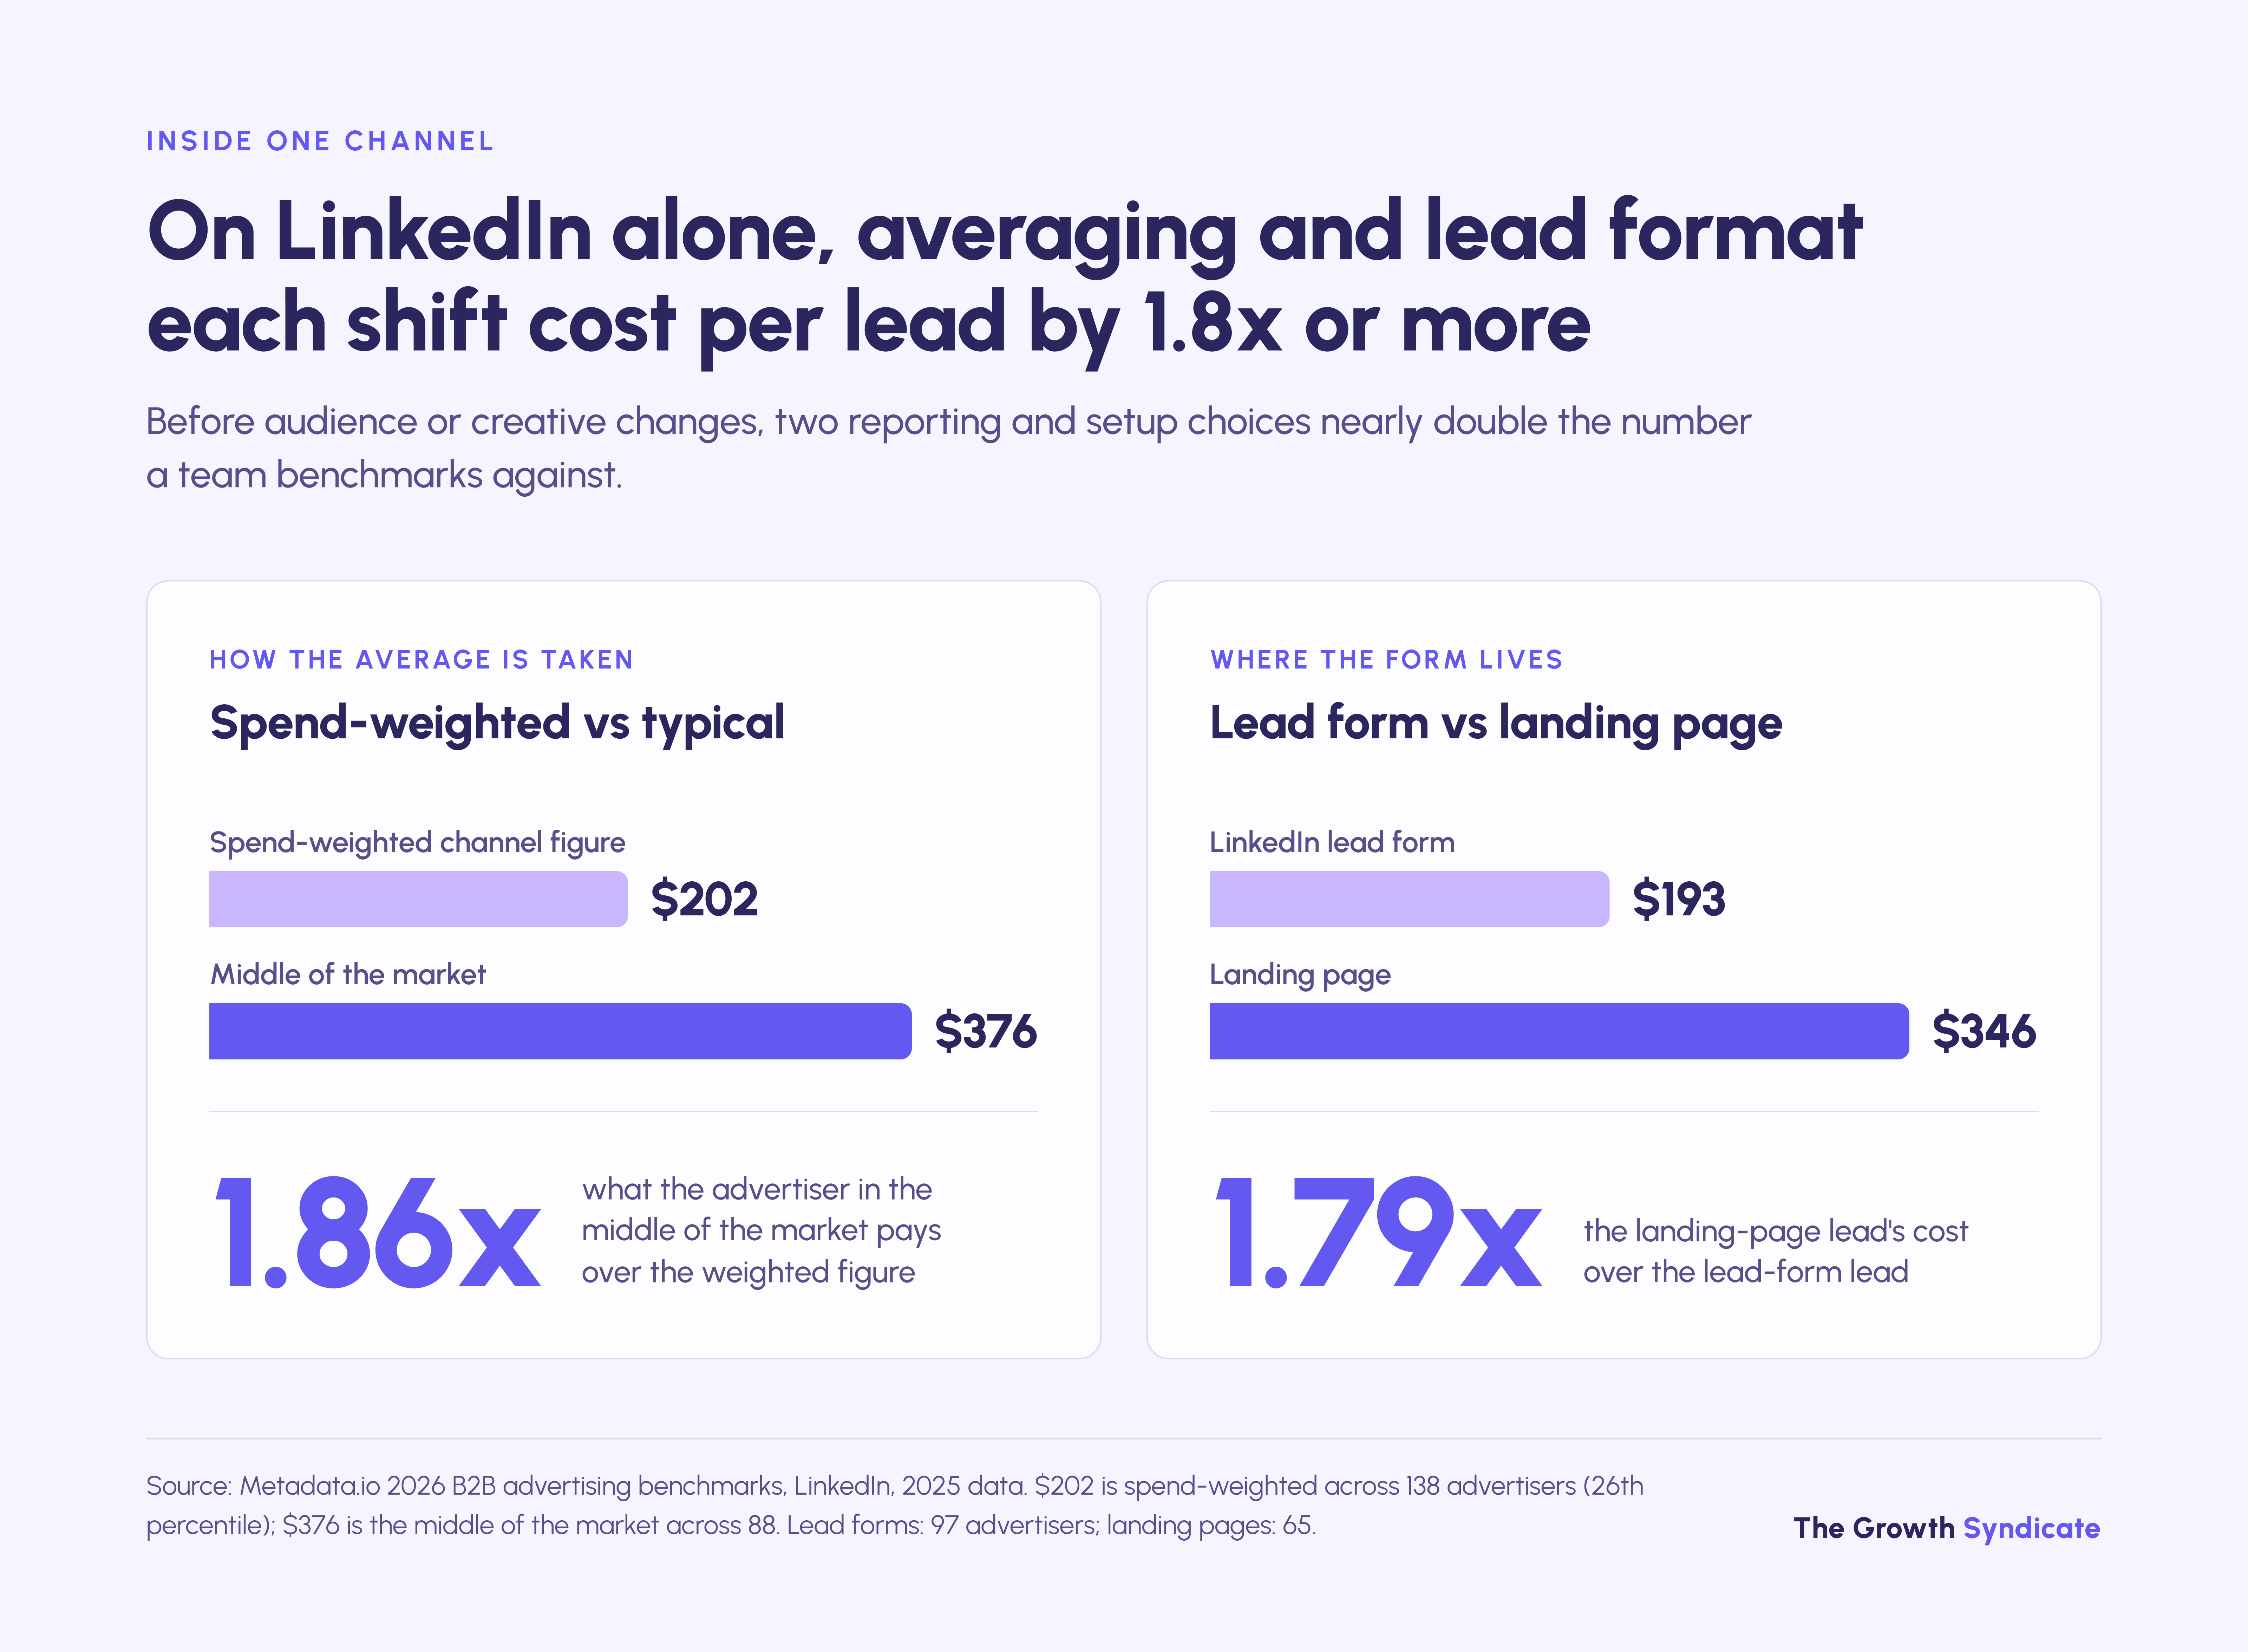
Metadata.io's LinkedIn figure of $202 per lead is weighted by spend and sits at the 26th percentile of advertisers; the advertiser in the middle of the market pays $376. Google Ads shows the same gap, at $524 weighted against $920 for the middle of the market, so most advertisers sit above the headline numbers and can mistake typical results for underperformance.
Form type alone can move cost per lead by 1.8x
Within LinkedIn alone, a lead form lead cost $193 and a landing page lead $346, a 1.8x gap inside one platform. A gated PDF, a newsletter sign-up and a demo request can each count as one lead, though only one of them signals a buying decision.
Vendors report on their own customers
Every benchmark dataset in this article comes from a vendor or an agency, most of them describing their own customers or clients, and none is independent research. First Page Sage, an SEO agency, states no sample size for its cost-per-lead figures, and Ebsta and Pavilion's report has no methodology section. Attribution adds another layer, because the same lead can be credited to paid search under last click and to LinkedIn under a multi-touch model, so how a team attributes marketing to revenue changes which channel's benchmark it should compare itself to.

"You need to measure not quantity but quality. Always. If you have a very limited budget, I can bring you millions of traffic. But the problem is we are not interested in any people. We are interested in people who will eventually become the final customer."
The fix is to stop judging paid media at the lead and judge it at the stage sales accepts. Volume metrics are easy to buy. Opportunities are not.
How do you convert cost per lead into cost per opportunity?
Divide cost per lead by the share of leads that become opportunities. On First Page Sage's paid-search funnel for B2B SaaS, 36% of leads become MQLs, 26% of MQLs become SQLs and 38% of SQLs become opportunities. That puts 3.6% of leads at opportunity, so a $150 lead costs $4,217 per opportunity.
The stage rates come from more than 50 B2B SaaS clients, mostly companies with $10M to $100M in revenue, collected over about a decade. They are the most complete published set we found that splits every stage by channel. First Page Sage defines an opportunity as an MQL with a contract in hand, which is late in most sales processes and helps explain why its own 35% opportunity-to-close rate for PPC runs well above the 18% to 22% in other datasets.
The win rate in the model is therefore a lower base case of 20%. Ebsta and Pavilion's 2025 GTM benchmarks, which analyzed 655,000 opportunities, put the new-business win rate at 18%. Across 90 advertisers with connected CRMs, Metadata.io found that 22.3% of closed ad-sourced deals were won.
Real-world cost per customer lands inside the model's range. Metadata.io's CRM-connected advertisers spent $31,939 of lead-generation media per customer won in 2025, between the model's $21,086 at a $150 lead and $73,662 at a $524 lead. Media cost is only part of acquisition cost, so add agency fees, sales time and tools before comparing the result with a full CAC target.
The model is most useful once your own rates replace the borrowed ones. If your CRM shows 10% of paid leads becoming opportunities, the same $150 lead costs $1,500 per opportunity and $7,500 per customer at a 20% win rate, a 2.8x improvement that comes entirely from lead quality.
What cost per lead can a $10k, $50k and $250k deal support?
At a 20% win rate and 75% gross margin, a 12-month payback caps paid-search cost per lead at about $53 for a $10,000 annual contract, $267 for $50,000 and $1,334 for $250,000. The same $150 lead pays back in 34 months on the smallest deal and in about six weeks on the largest one.
Read across the rows and the benchmark question answers itself. A $10,000 product cannot buy Google Ads leads at the $524 B2B rate or even at LinkedIn's $202. It needs leads under $53, cheaper than even LocaliQ's all-advertiser medians of $67 to $94, or a much higher conversion rate than the public funnel.
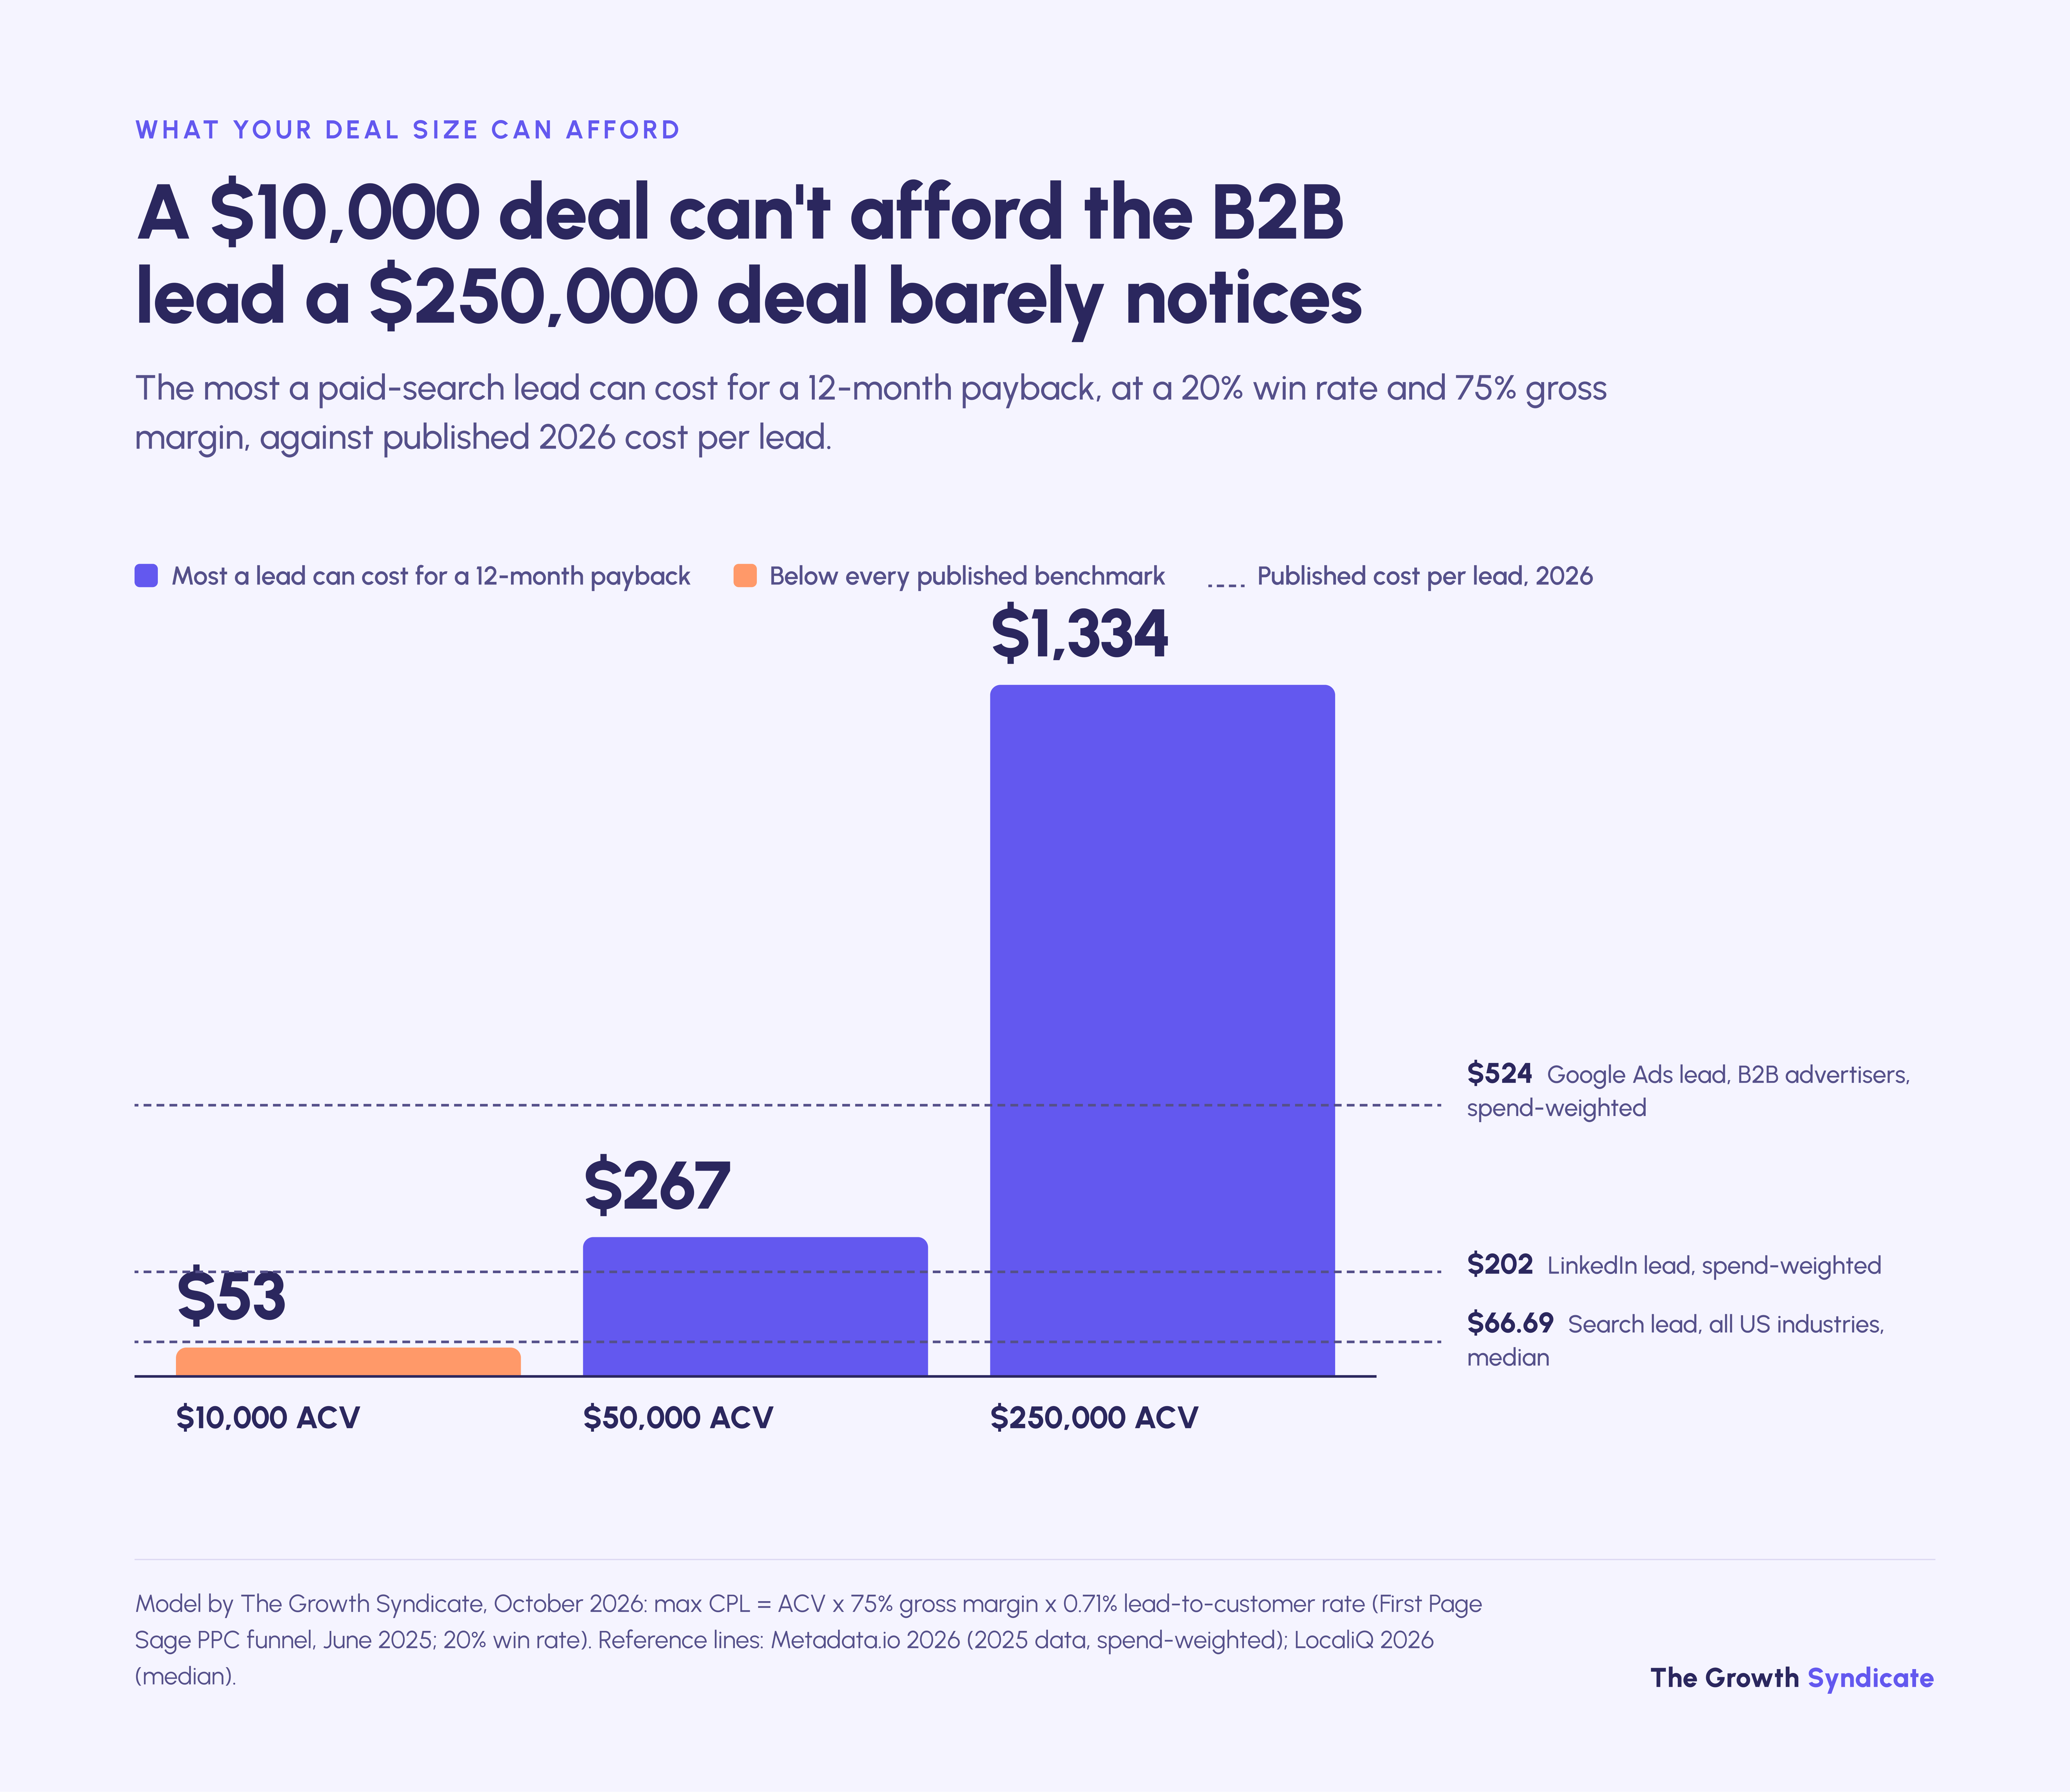
At $250,000, cost per lead barely registers, and the constraint becomes how many qualified buyers exist at all.
The table applies one funnel to all three deal sizes, which is its main simplification. No public dataset we found splits paid stage rates by contract value. Ebsta and Pavilion put the average new-business cycle at 91 days, while deals above $100,000 in our client work often take a year to close, so the $250,000 row flatters paid media more than it should.
Channel choice follows the same split. Smaller contracts can rely on search volume, while large ones need fewer, deeper relationships with named accounts, which is where account-based programs take over from cost-per-lead buying.

How much should you budget for B2B PPC?
Budget B2B PPC backward from sales capacity. Take the number of new opportunities your team can work each month and multiply it by cost per opportunity, then check the total against the conversion volume Google's automated bidding needs. A team that can take eight paid-sourced opportunities a month at $4,217 each needs about $33,700 in monthly media.
The method runs in four steps:
- Set the opportunity target from sales capacity. Count how many new paid-sourced opportunities your account executives can work properly each month, including follow-up within the week a lead arrives.
- Take cost per opportunity from the model. Use your own stage rates where you have them, or the public PPC funnel above where you don't.
- Multiply. Eight opportunities at $4,217 each is $33,736 a month; at 3.6% lead-to-opportunity, that also means about 225 leads for sales and SDRs to process.
- Check the bidding floor. If the budget can't produce enough conversions for automated bidding, fix the conversion event or the bid strategy before adding spend.
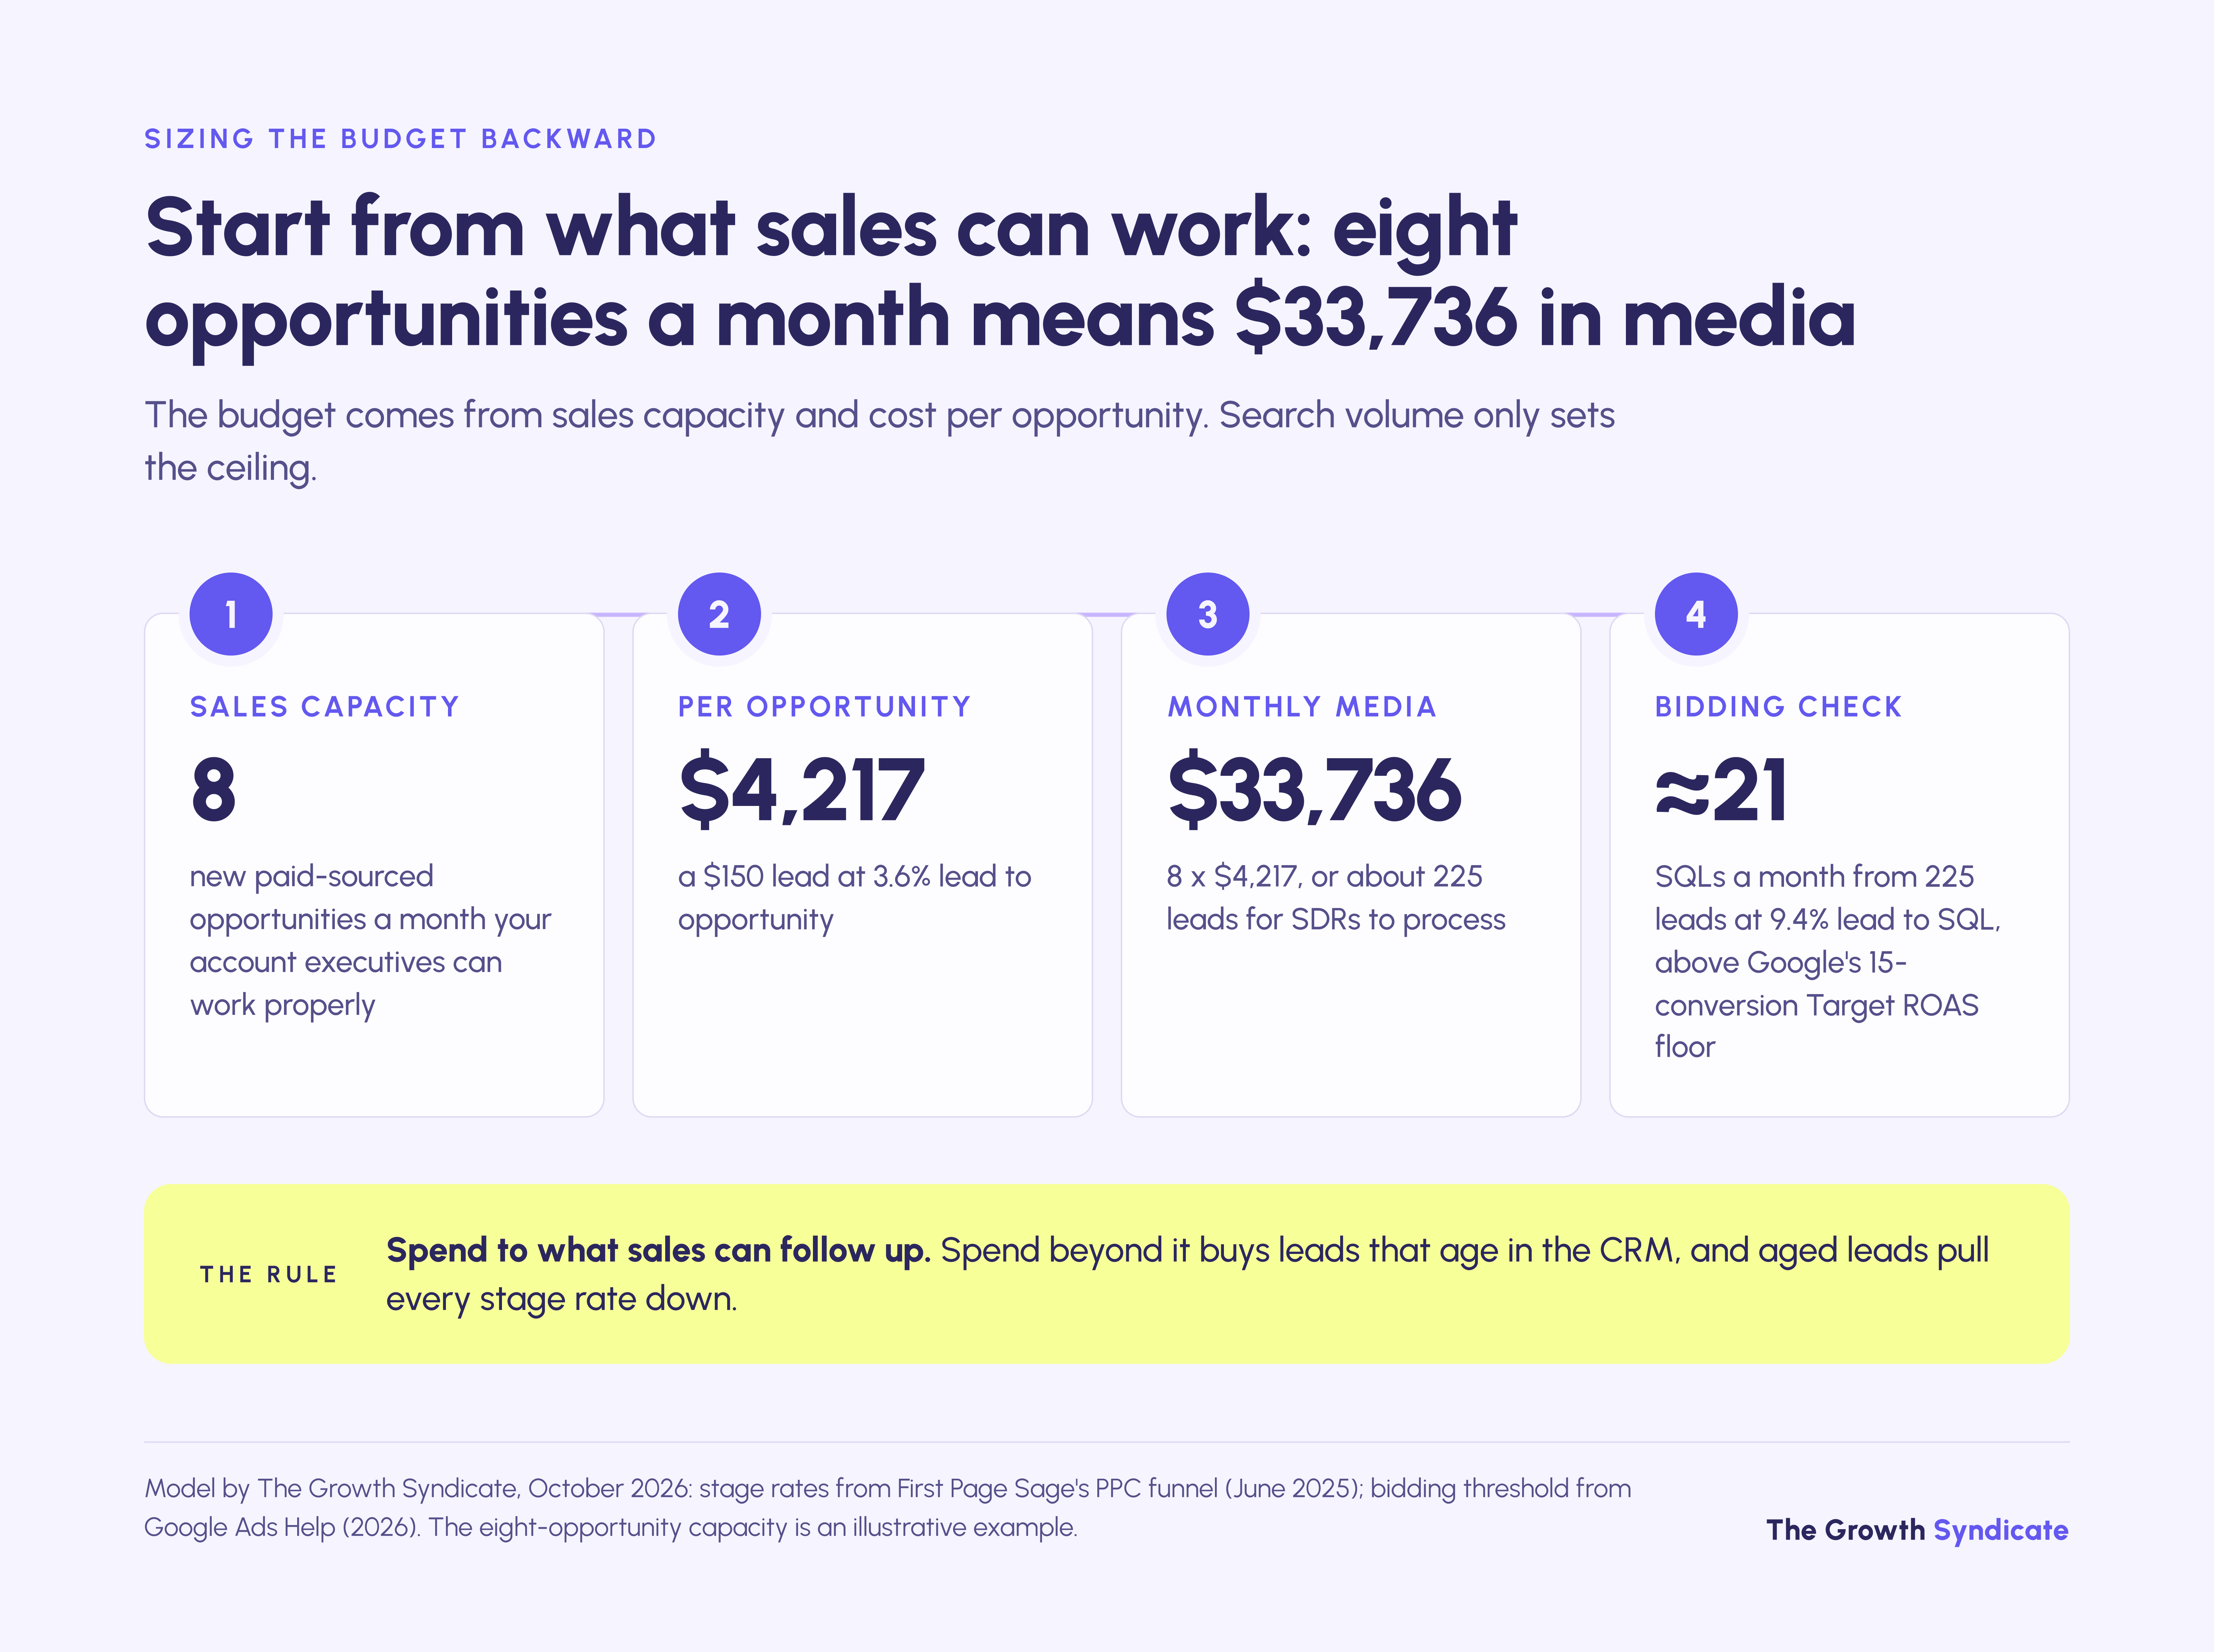
Sizing spend to what sales can follow up, rather than to the search volume available, is the core of a B2B PPC strategy built for long sales cycles. Spend beyond sales capacity buys leads that age in the CRM, and aged leads drag every stage rate down.
The floor comes from Google's own requirements. Google's Target ROAS documentation asks for at least 15 conversions in the past 30 days, counted at the conversion-tracking level, before it runs on Search campaigns. Target CPA can start with no conversion history, but Google recommends evaluating it over the last 30 days with at least 30 conversions.
Bidding on a deeper event raises the floor. Feeding SQLs back as the conversion improves the signal, but at the model's $1,603 per SQL, 15 SQLs a month costs $24,045 in media, and the eight-opportunity budget above clears it with roughly 21 SQLs from its 225 leads.
Accounts below that level can bid on a qualified form fill and import SQLs as a secondary conversion until volume allows the switch.
Before raising a budget, check how much of the current one reaches buyers at all. In TGS account audits, broad match keywords and loose audience targeting are the first place budget leaks, and the search terms report shows how much.
"The most important thing is the structure. We see a lot of accounts that were created without the proper knowledge of performance, or with knowledge but without structure. It happens that everything is right, but the structural hacks that allow you to reduce budget are missing."
How should a B2B PPC budget split across channels?
No universal ratio holds, but 2025 vendor data shows where B2B budgets go. Of the $57.6M that Metadata.io's 153 advertisers spent, 37% went to cold prospecting, 20% to retargeting, 21% to other lead-generation audiences and 22% to traffic and awareness.
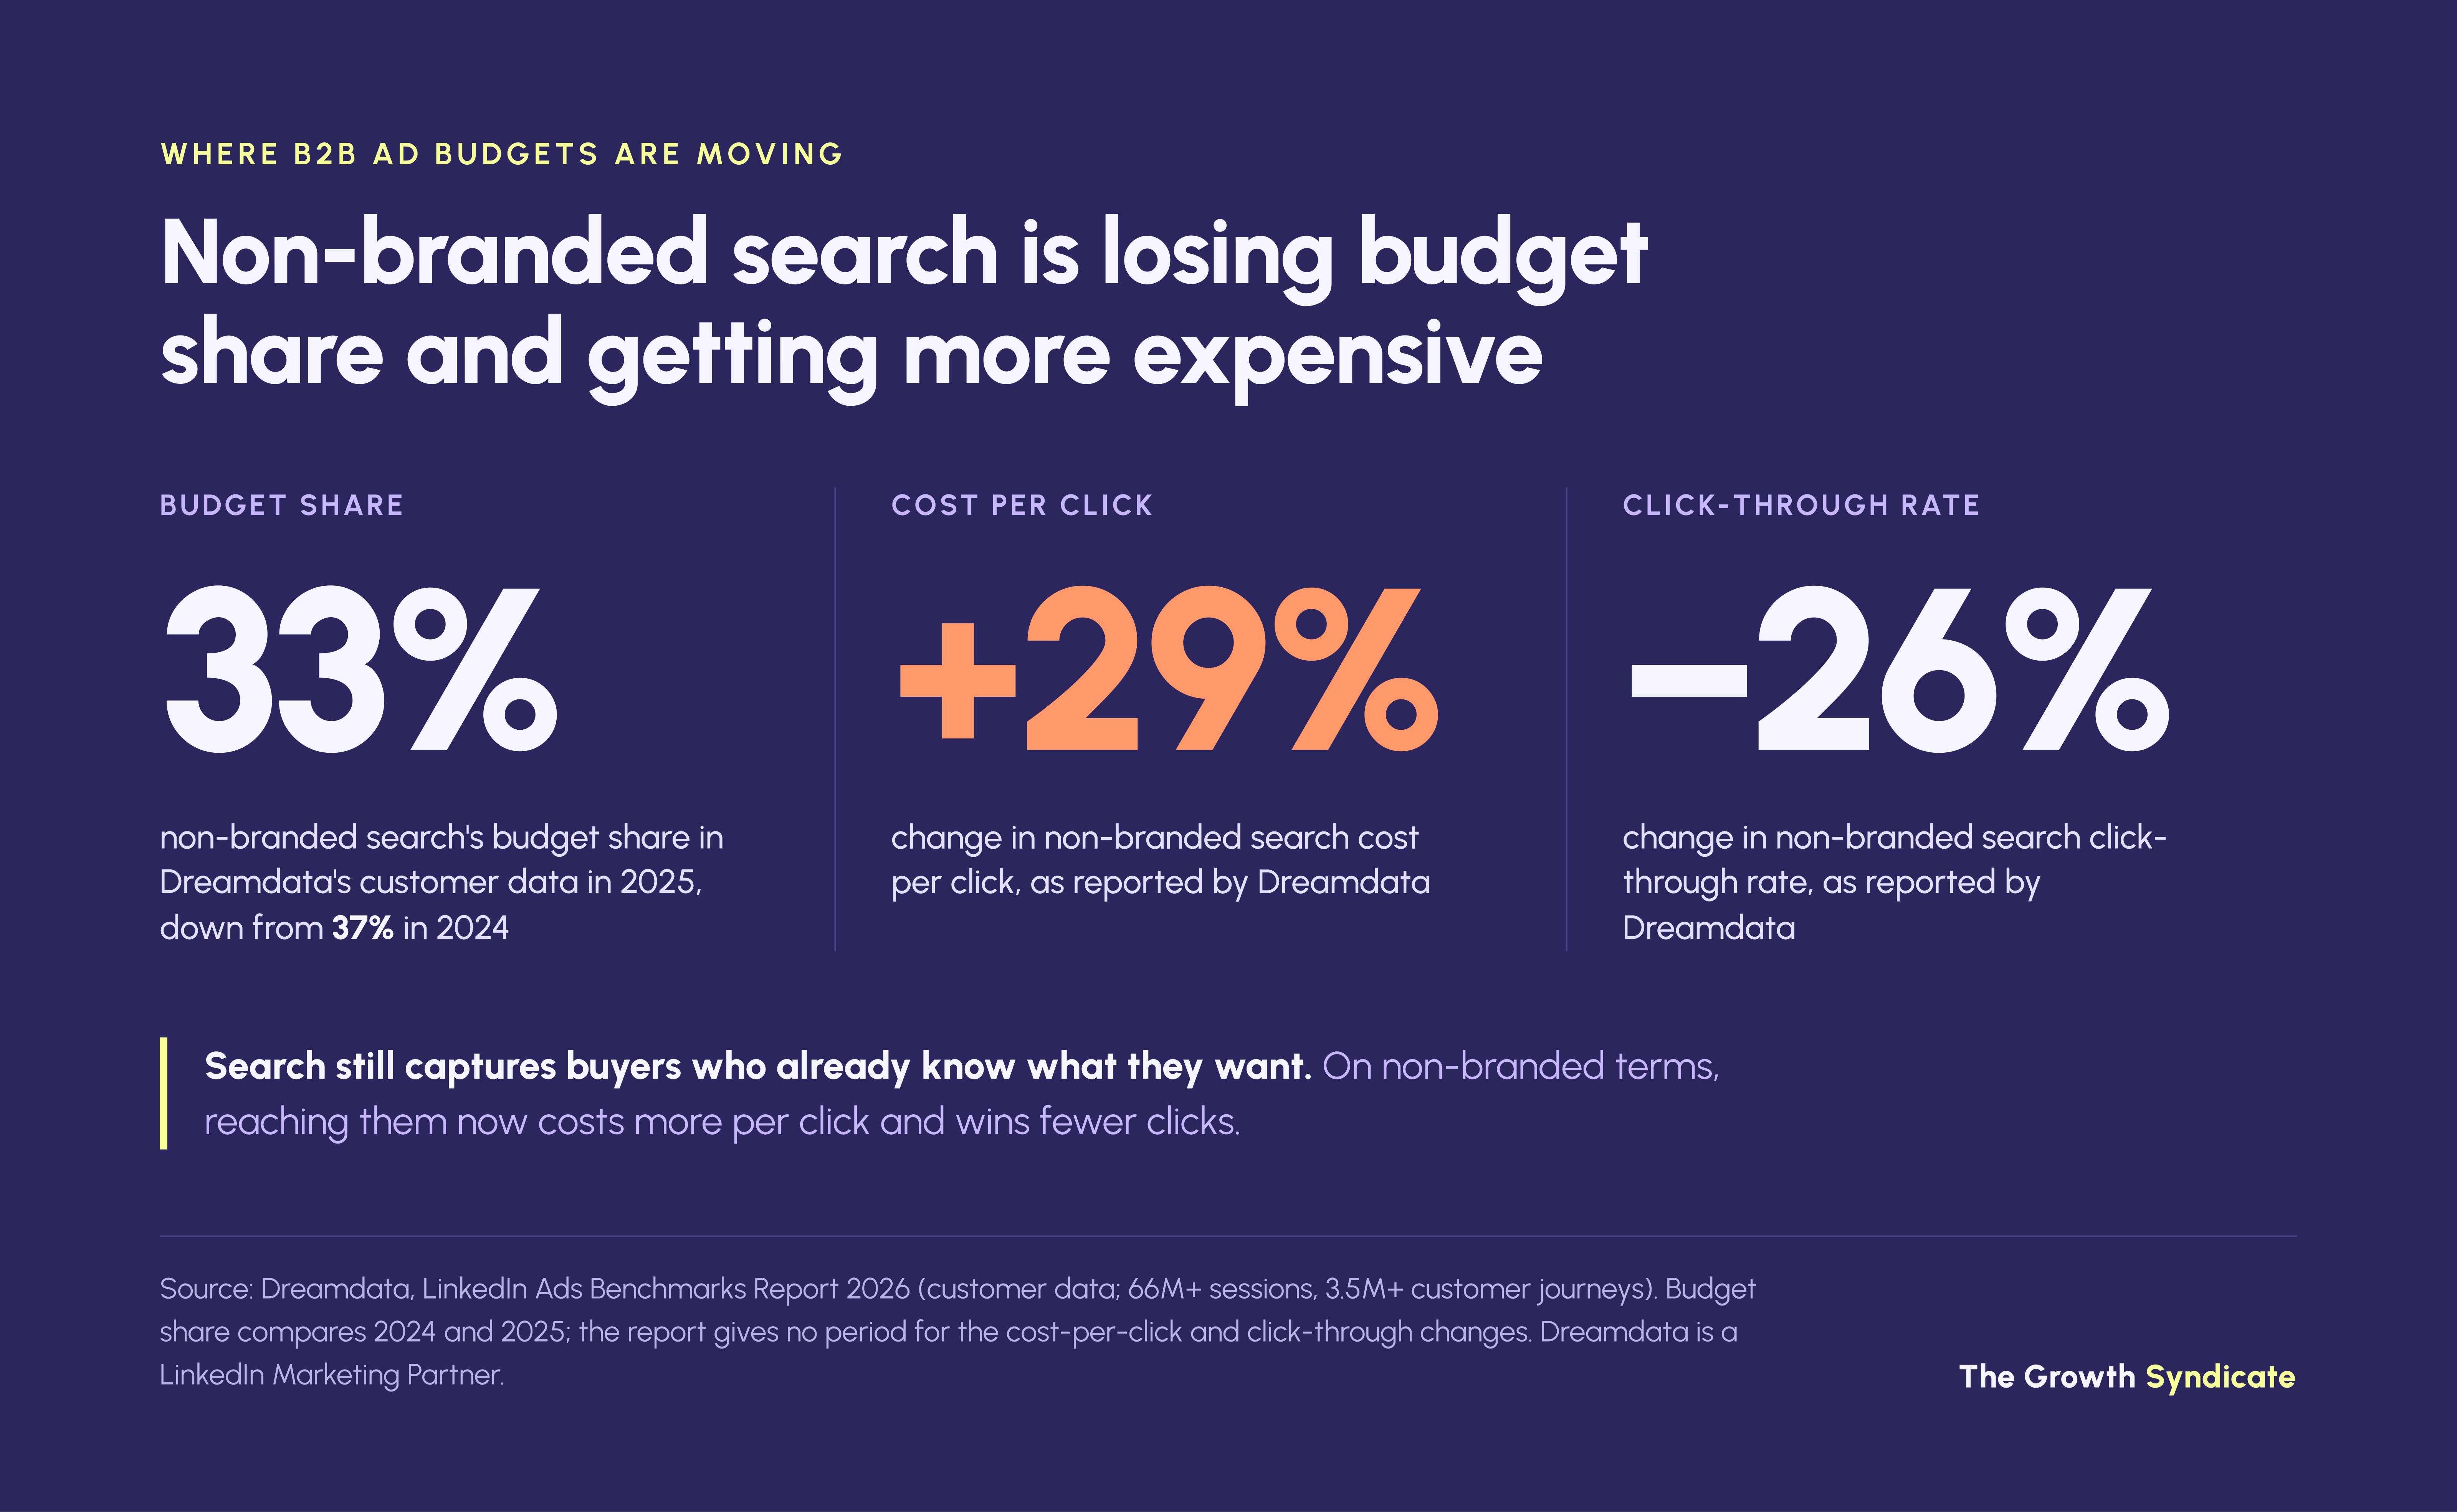
Non-branded search is losing share and getting more expensive. Dreamdata's 2026 LinkedIn Ads benchmarks, built on its customers' data (more than 66 million sessions and 3.5 million customer journeys), report non-branded search budgets falling from 37% in 2024 to 33% in 2025. The same report puts non-branded cost per click up 29% and click-through rate down 26%, without stating the period for those two changes.
The pipeline data points the same way. Among advertisers with connected CRMs, Metadata.io measured $10.20 of sourced pipeline per lead-generation dollar on LinkedIn against $7.97 across all channels. Dreamdata, a LinkedIn Marketing Partner, reports attributed return on ad spend of 121% for LinkedIn, 67% for Google Search and 51% for Meta, from its own attribution model on closed-won deals.
Both are vendors reporting on their own customers, so treat the direction as more reliable than the multiples.
Split the budget by the job each channel does. Search captures buyers who already know what they want, while LinkedIn reaches the buying committee before anyone searches. Retargeting then keeps both groups in view through a cycle that runs for months.
Within Google itself, brand, competitor and category campaigns attract leads of very different intent, so account structure for B2B Google Ads deserves its own plan.
LinkedIn's lead quality also changes the arithmetic. On First Page Sage's funnel, 4.7% of LinkedIn leads reach opportunity against 3.6% for paid search, so a LinkedIn lead at Metadata's $202 costs about $4,322 per opportunity, close to the $4,217 of a $150 search lead.
How do B2B PPC benchmarks differ by industry?
Paid cost per lead roughly doubles from B2B SaaS to manufacturing and financial services. First Page Sage's October 2026 report puts paid cost per lead at $318 for B2B SaaS, $363 for healthcare, $494 for fintech, $657 for manufacturing and $731 for financial services, measured as total marketing spend per lead on data collected from January 2022 to August 2026.
The two sources measure different things, and the gaps show it. LocaliQ doesn't define its categories, and each row covers all of its advertisers in that industry rather than B2B companies alone, which likely explains much of the gap between a $75 search lead and First Page Sage's $657.
The First Page Sage figure also counts total marketing spend across paid channels it describes only by example, such as PPC and trade shows. Read the First Page Sage columns for B2B budgeting and the LocaliQ figures only as a rough lower bound for what search costs.
Manufacturing shows why click benchmarks alone are thin evidence. In interviews published in our 2026 manufacturing marketing report, Steve Patti, a 7x VP/CMO and advisor to manufacturing companies, spoke with 12 of a manufacturer's top target accounts. Only one said they had ever clicked a paid or sponsored ad in a Google search, while the company was spending well over $1M a year on paid media.
Health tech adds a measurement problem on top of cost. Our health tech marketing report puts hospital sales cycles at 8 to 18 months, and it flags tracking pixels on pages with health-condition context as a legal exposure. A benchmark CPL from an account that tracks freely won't transfer to one that can't.
What does a B2B PPC agency cost?
B2B PPC agencies charge in four ways: a flat monthly retainer, a percentage of ad spend, a hybrid of the two, or a performance fee tied to leads or pipeline. We found no independent survey of B2B fee levels, and published ranges come from agencies describing their own pricing, so compare the structure before comparing the number.
Each structure carries an incentive, and the cost-per-opportunity model shows where it bites. A percentage-of-spend fee grows when the budget grows, whether or not opportunities do, and a fee per lead rewards volume at whatever quality the lead definition allows. A fee tied to SQLs or opportunities aligns best, provided both sides agree the definition before the first invoice.
The most useful question for any agency, including us, is what it reports past the lead. TGS's B2B PPC team bills transparent hourly rates with no percentage of spend and reports paid media on qualified opportunities, and that reporting needs CRM access from the first week.
How long until B2B PPC pays back?
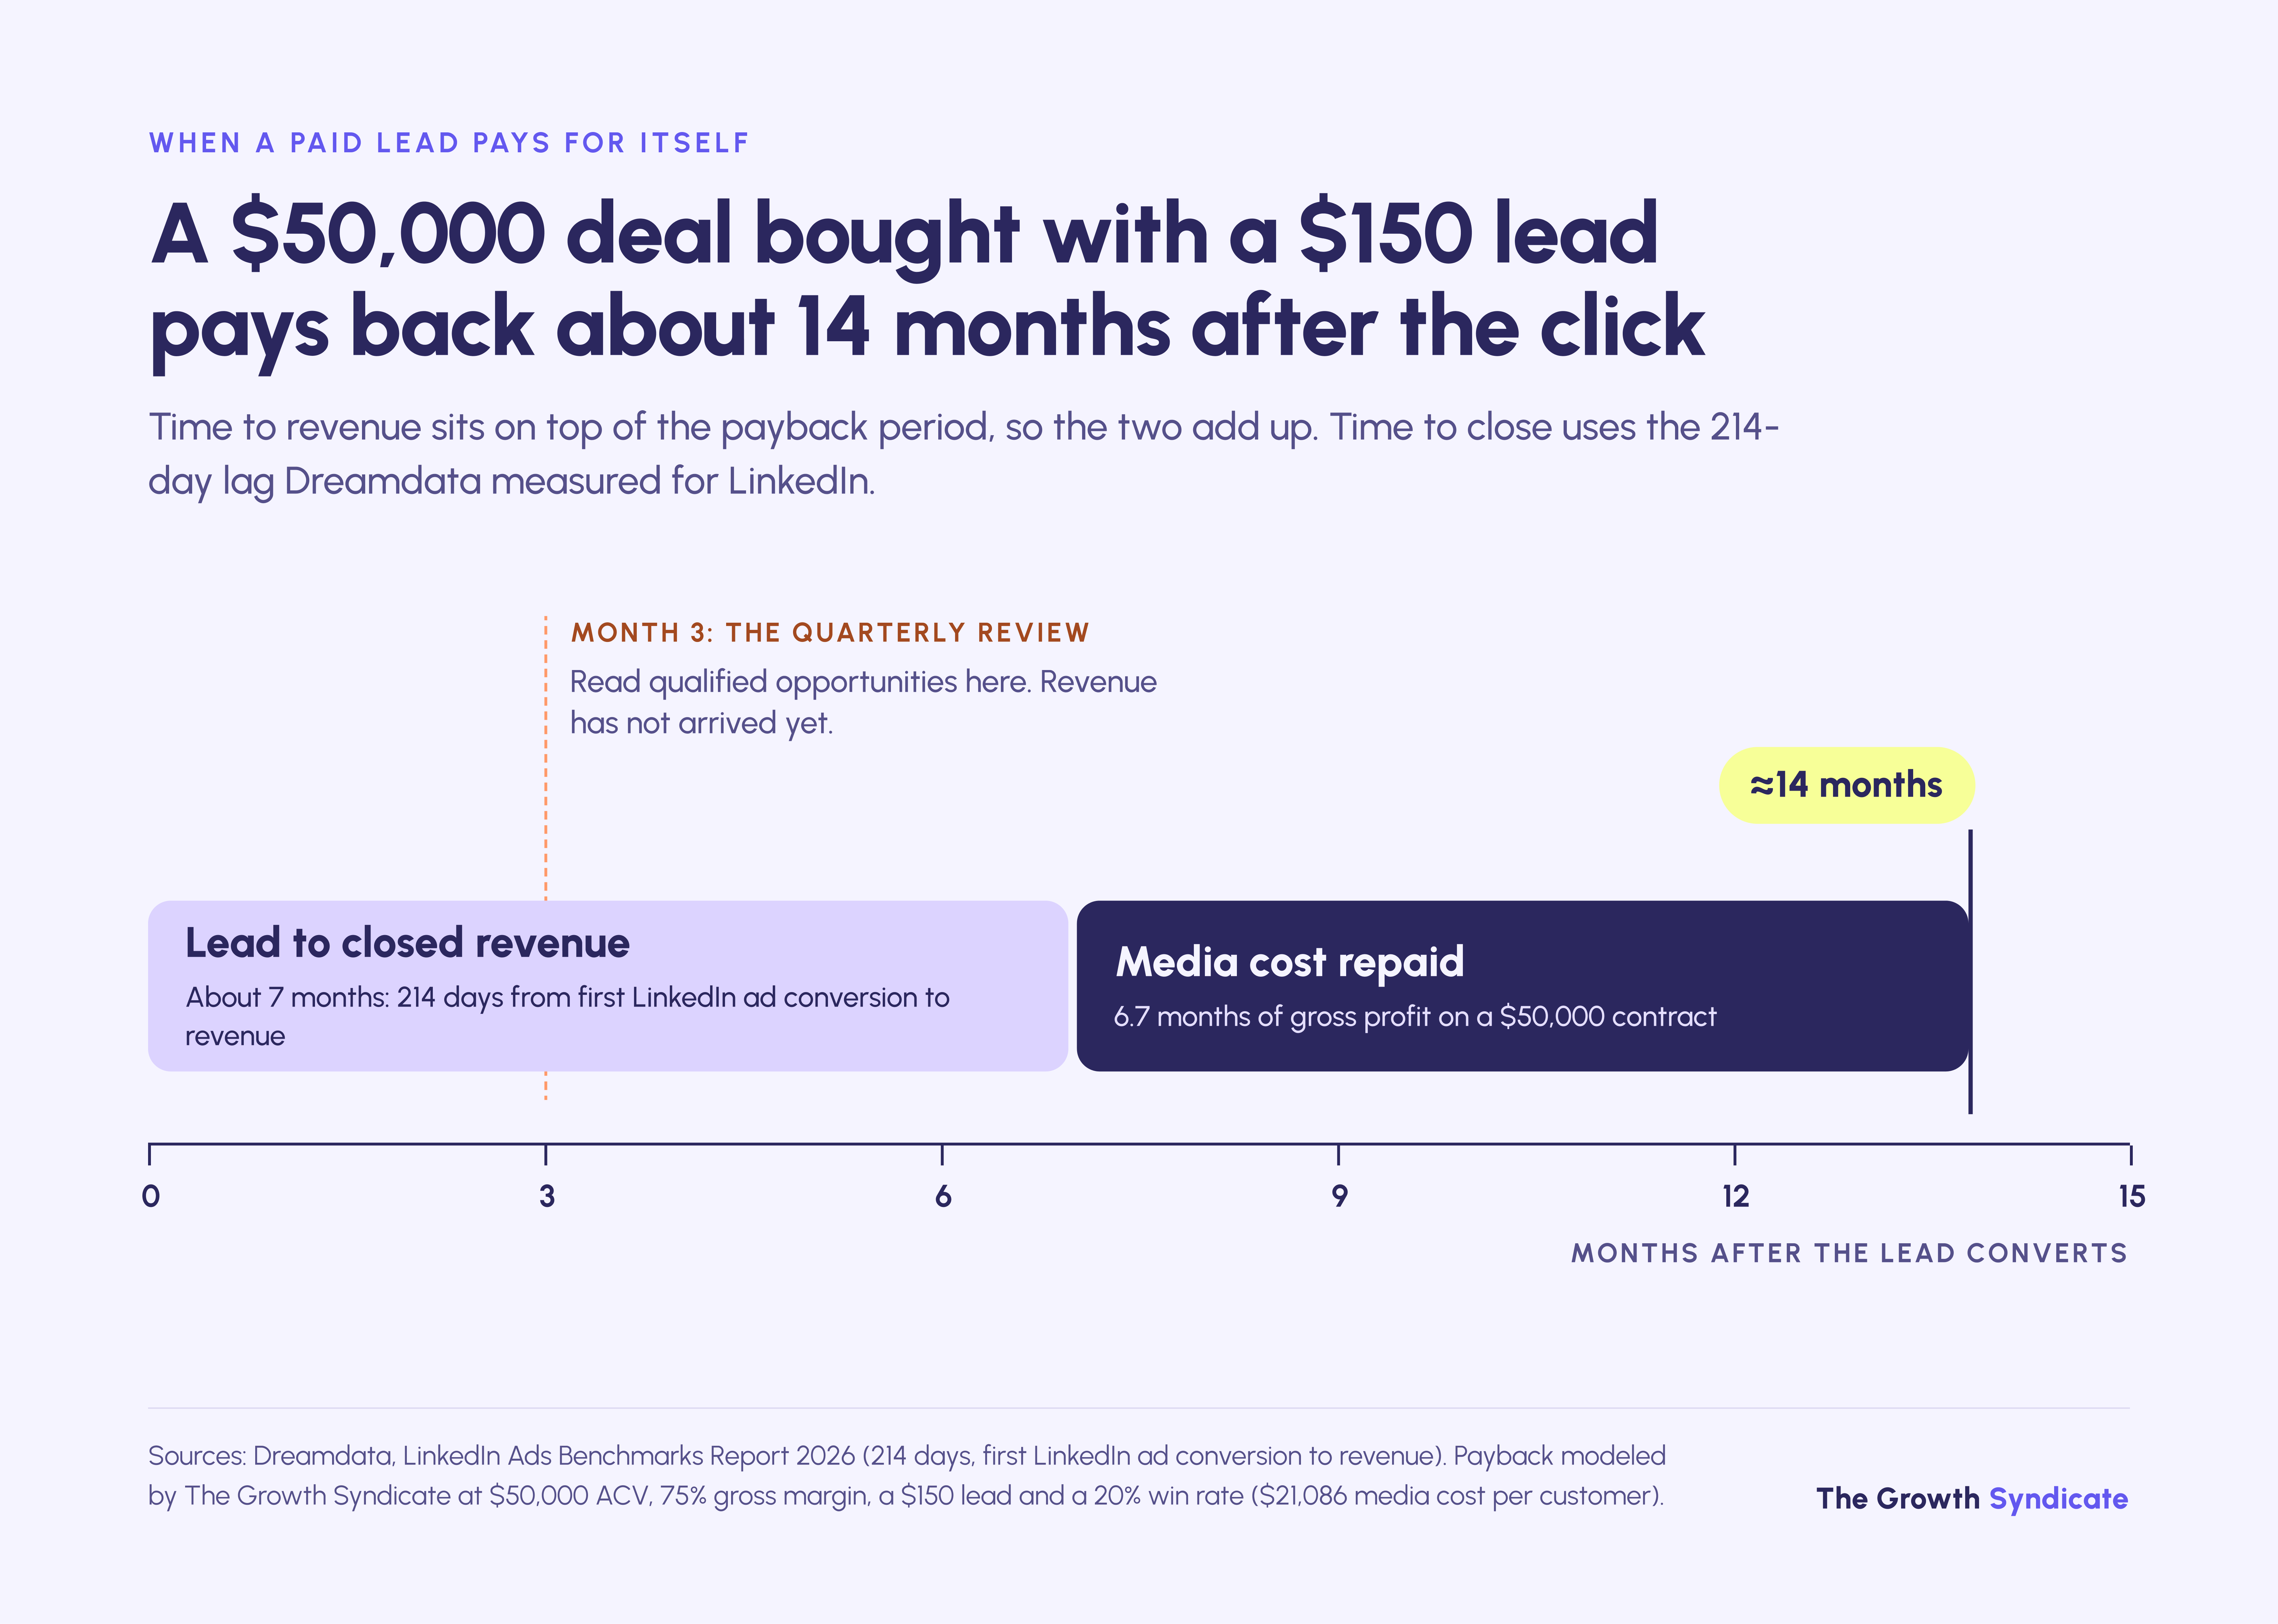
Judge paid media on opportunities within about one sales cycle and on revenue months later, because a 30-day CPL review cuts campaigns before they can pay back. Dreamdata's 2026 data puts an average of 214 days between a first LinkedIn ad conversion and revenue, and Ebsta and Pavilion's 2025 benchmarks put the average new-business cycle at 91 days.
Time to revenue sits on top of the payback period, so the two add up. A $50,000 contract bought with a $150 lead pays back its media cost 6.7 months after the deal closes, and if the deal follows the 214-day lag Dreamdata measured for LinkedIn, it closes about seven months after the lead converts. Cash payback on that lead lands around 14 months after the click, well past a quarterly budget review.
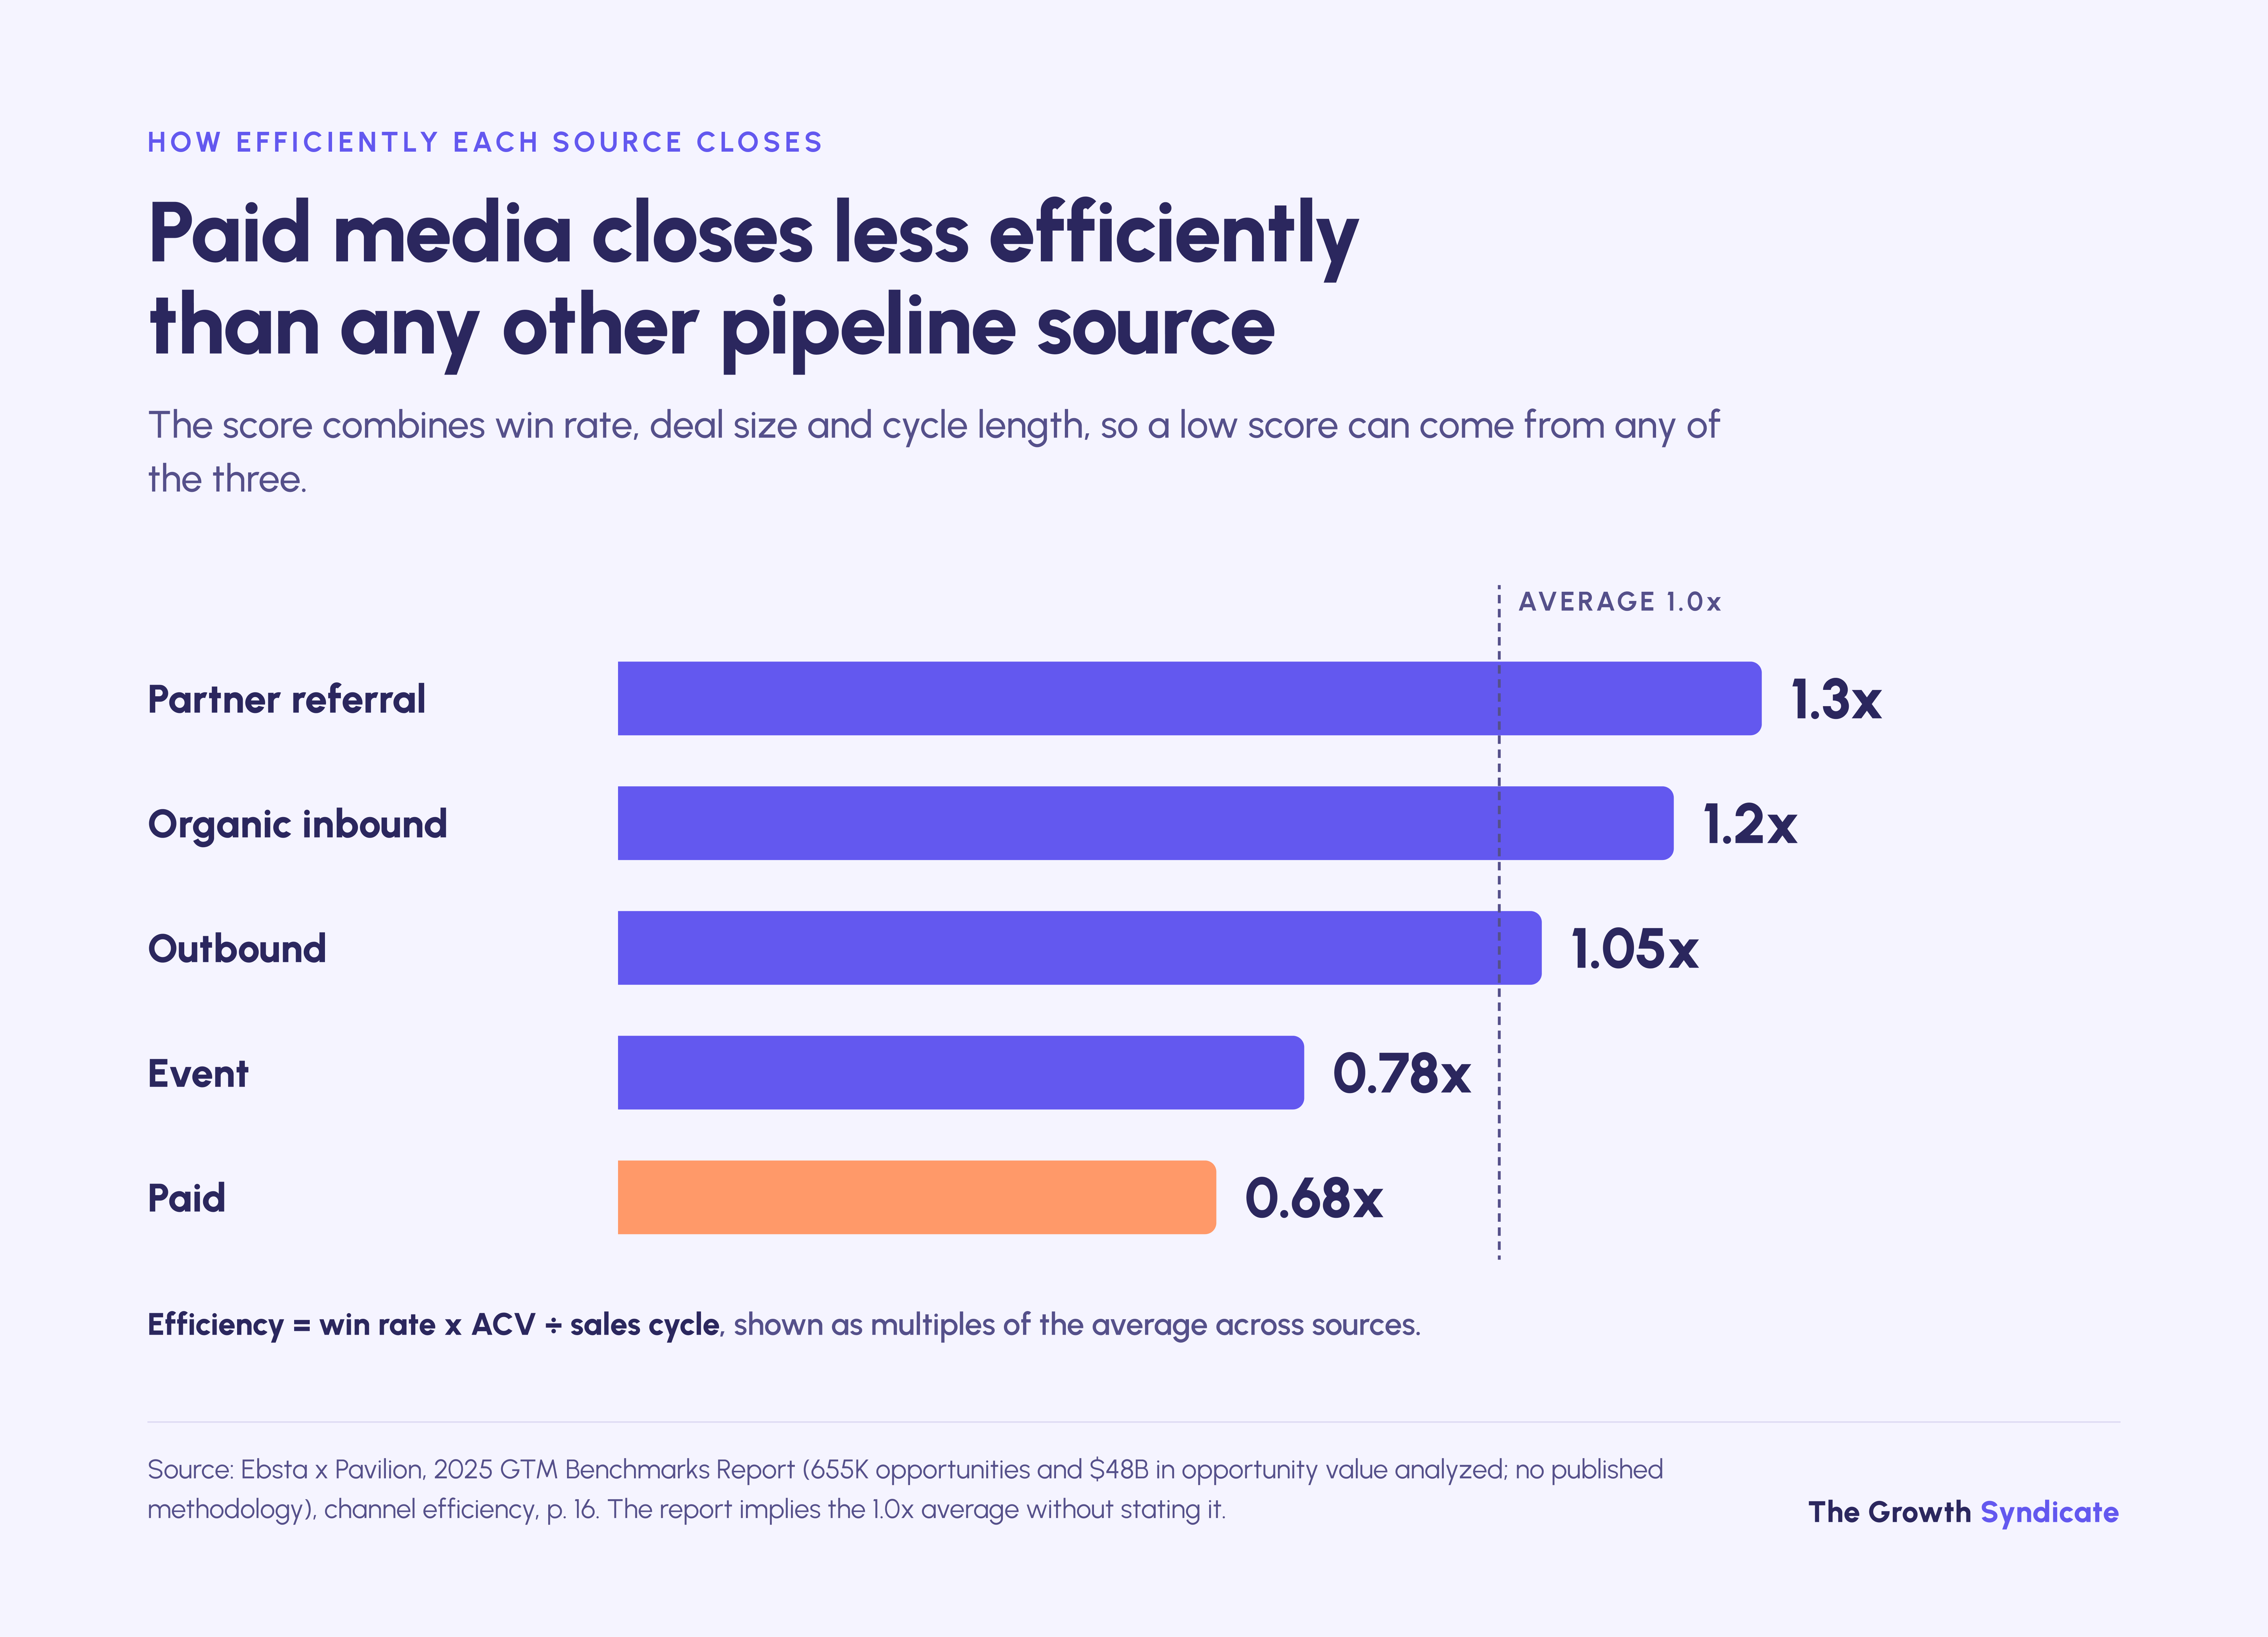
Paid media also closes less efficiently than other sources. Ebsta and Pavilion score channel efficiency as win rate times ACV divided by sales cycle, shown as multiples of the cross-source average, and paid lands lowest at 0.68x, against 0.78x for events, 1.05x for outbound, 1.2x for organic inbound and 1.3x for partner referrals.
That pattern argues for three checkpoints rather than a monthly CPL review. Read paid media on qualified opportunities at around 90 days, on pipeline value at one full sales cycle, and on revenue at seven to nine months, which is roughly where Dreamdata's 214-day lag lands.
Where this breaks down
The model and the benchmarks hold only where conversion volume is high enough to measure stage rates and where the borrowed rates resemble your own funnel. Six limits come up most often, and each one changes how much weight a single benchmark should carry:
- Low volume turns rates into noise. Below about 15 paid conversions a month, a single month's stage rates mean little; read them on rolling 90-day windows.
- The stage rates are borrowed. First Page Sage's funnel comes from one agency's B2B SaaS clients. Replace each rate with your own after two quarters of clean CRM data.
- One funnel does not fit every deal size. No public source splits paid stage rates by contract value, so the $250,000 row is optimistic.
- Media-only CAC flatters paid. Agency fees, SDR time and tools sit outside the model.
- Channels that influence rather than convert score badly. Awareness campaigns rarely produce a last-click lead, so judging them on cost per lead cuts them early.
- Benchmarks age fast. Dreamdata reports non-branded search cost per click up 29%, so check any CPL target against the latest edition of its source.
What to do next
Replace every borrowed rate in the model with your own CRM data, then let the result set your CPL ceiling and your budget. Until two quarters of clean data exist, treat the public rates as a starting assumption and use the decision rules below.
If your average contract is around $10,000, generic B2B search will rarely clear a $53 lead, so put spend into high-intent and branded terms and lead forms, and measure every campaign at opportunity.
If your average contract is $50,000 or more, conversion volume matters more than cost per lead, so make sure the budget clears the bidding floor and sales can work every opportunity it buys.
If cost per lead looks healthy but pipeline is thin, audit lead definitions before touching bids. A cheap lead that never reaches SQL is the most expensive lead you buy.
If you can't reach 15 conversions a month, bid on a qualified form fill and import SQLs as a secondary conversion.
If an agency quotes a percentage of spend, ask for cost per qualified opportunity in the monthly report, with the opportunity defined before the contract starts.
If you are adding LinkedIn, judge it on pipeline per dollar over two sales cycles, because its effect shows in opportunities more than in last-click leads.
Frequently asked questions
Is a 2% conversion rate good for B2B PPC?
A 2% click-to-lead rate is in line with B2B Google Ads benchmarks. Metadata.io's 2025 data from 56 B2B advertisers shows 1.9%, while LocaliQ's 2026 Business Services median is 4.85% on a lead definition that includes calls and chats. Judge the rate with lead quality, since a higher rate built on low-intent forms can produce a worse cost per opportunity.
What cost per lead should a $50,000 ACV product accept?
At a 20% win rate, 75% gross margin and published paid-search funnel rates, a $50,000 annual contract supports about $267 per lead for a 12-month payback and about $534 for a 24-month payback. Your own stage rates will move that ceiling, so recalculate it once you have two quarters of CRM data.
Are LinkedIn leads worth 3x a Google lead?
No published dataset supports 3x. First Page Sage's funnel shows LinkedIn leads reaching opportunity about 1.3x as often as paid-search leads, Metadata.io shows LinkedIn returning 1.3x the all-channel average in pipeline per dollar, and Dreamdata's attributed return on ad spend for LinkedIn is 1.8x Google Search's. Treat 1.3x to 1.8x as the evidenced range.
How many conversions does Google's smart bidding need?
Google asks for at least 15 conversions in the past 30 days before Target ROAS can run on Search campaigns. Target CPA can start with no conversion history, but Google recommends evaluating it over 30 days with at least 30 conversions. At a $524 B2B lead, 15 conversions a month costs $7,860 in media.
What is a good cost per SQL in B2B?
On published paid-search funnel rates, 9.4% of leads become SQLs, so cost per SQL runs about 10.7x cost per lead. A $150 lead implies roughly $1,603 per SQL and a $318 lead about $3,397. Whether that is good depends on deal size: at a $50,000 contract, an SQL near $1,600 leaves room for a healthy payback.
Are ChatGPT Ads cheaper than Google Ads for B2B?
We found no published B2B cost-per-lead benchmark for ChatGPT Ads, so the comparison can't be made on published data. In campaigns TGS ran for B2B clients in 2026, click-through rates ran from 0.62% to 1.63% across manufacturing, healthcare and SaaS campaigns, with zero clicks for fintech. Budget ChatGPT Ads as a test until a cost-per-lead benchmark exists.
Do Google Ads or LinkedIn produce cheaper B2B leads?
In Metadata.io's 2025 data from B2B advertisers, LinkedIn produced cheaper leads than Google Ads: $202 against $524 spend-weighted, and $376 against $920 for the middle-of-market advertiser. LinkedIn converted 5.9% of clicks into leads against 1.9% on Google at similar click prices. Across all US industries, LocaliQ's median search lead costs far less, at $66.69.