
Last verified October 2026. Nearly 80% of organizations in Demand Gen Report's 2026 benchmark survey say they run account-based marketing, and Momentum ITSMA's 2023 study of 320 practitioners put ABM at 30% of the marketing budget. Most other ABM statistics, including the famous ROI figures, are what marketers report about their own programs, so this page labels each number as measured, self-reported or untraceable, and shows which ABM tier your deal size supports.
Key takeaways
- Adoption depends on the definition: nearly 80% of organizations in Demand Gen Report's 2026 survey run ABM, while the Content Marketing Institute's 2026 study of 1,015 B2B marketers puts ABM use, alone or alongside ABX, at 49%.
- In Momentum ITSMA's 2023 benchmark, 52% of 208 respondents said their company measures ABM ROI, and 81% of the 115 who rated it said ABM beats their other marketing on ROI.
- The 171% lift in annual contract value and the claim that 97% see higher ROI from ABM trace to no study we could check, and three other well-known figures trace to findings about sales and marketing alignment.
- The measured evidence points at buying groups: won deals had 9 contacts engaged at the solution-presented stage against 2 for lost deals, in an analysis of 4.2 million opportunities (Ebsta and Pavilion, 2024).
- TGS's working rule, from co-founder Clément Dumont, is that one-to-one ABM pays only at about €300K in annual contract value or more; below that line, one-to-few and one-to-many programs, which typically covered 20-200 and 500-2,500 accounts in Momentum ITSMA's 2023 data, fit better.
- One failed launch proves little. More than half of the programs BCG identified in 2020 failed at first before most strategic and scaled programs succeeded, and Ysabel Camus recalls needing two or three versions of her best campaign.
How to read this page. The Growth Syndicate (TGS), a B2B marketing agency that runs ABM programs, checked every third-party figure here at its primary source, or at a named secondary report where the primary is paywalled or offline, and labeled the headline figures twice: measured or self-reported, and a source grade explained in the method section. Of the 28 groups of figures we graded, 25 are self-reported answers from surveys or interviews.
This page is by Ysabel Camus, who led TGS's ABM program for Nobel Recruitment, with TGS's co-founders adding their views where they bear on a number. Definitions and the step-by-step method sit in TGS's account-based marketing strategy guide, so this page sticks to the numbers.
Account-based marketing statistics at a glance
Account-based marketing statistics fall into two groups. Most are survey answers, such as the share of organizations that say they run ABM or the share of practitioners who say it beats other marketing on ROI. A few are measured, mainly from sales-pipeline data on how buying groups behave, and the table below labels each headline figure.
Seven of the eight headline figures are self-reported, and the one measured figure describes buying groups in general rather than ABM programs. Grades run from A, a recent primary with its sample and fieldwork dates stated, to C, a figure we could not confirm or that its own data contradicts, and TGS's B2B marketing benchmarks page covers the wider funnel numbers.
How many B2B companies use ABM?
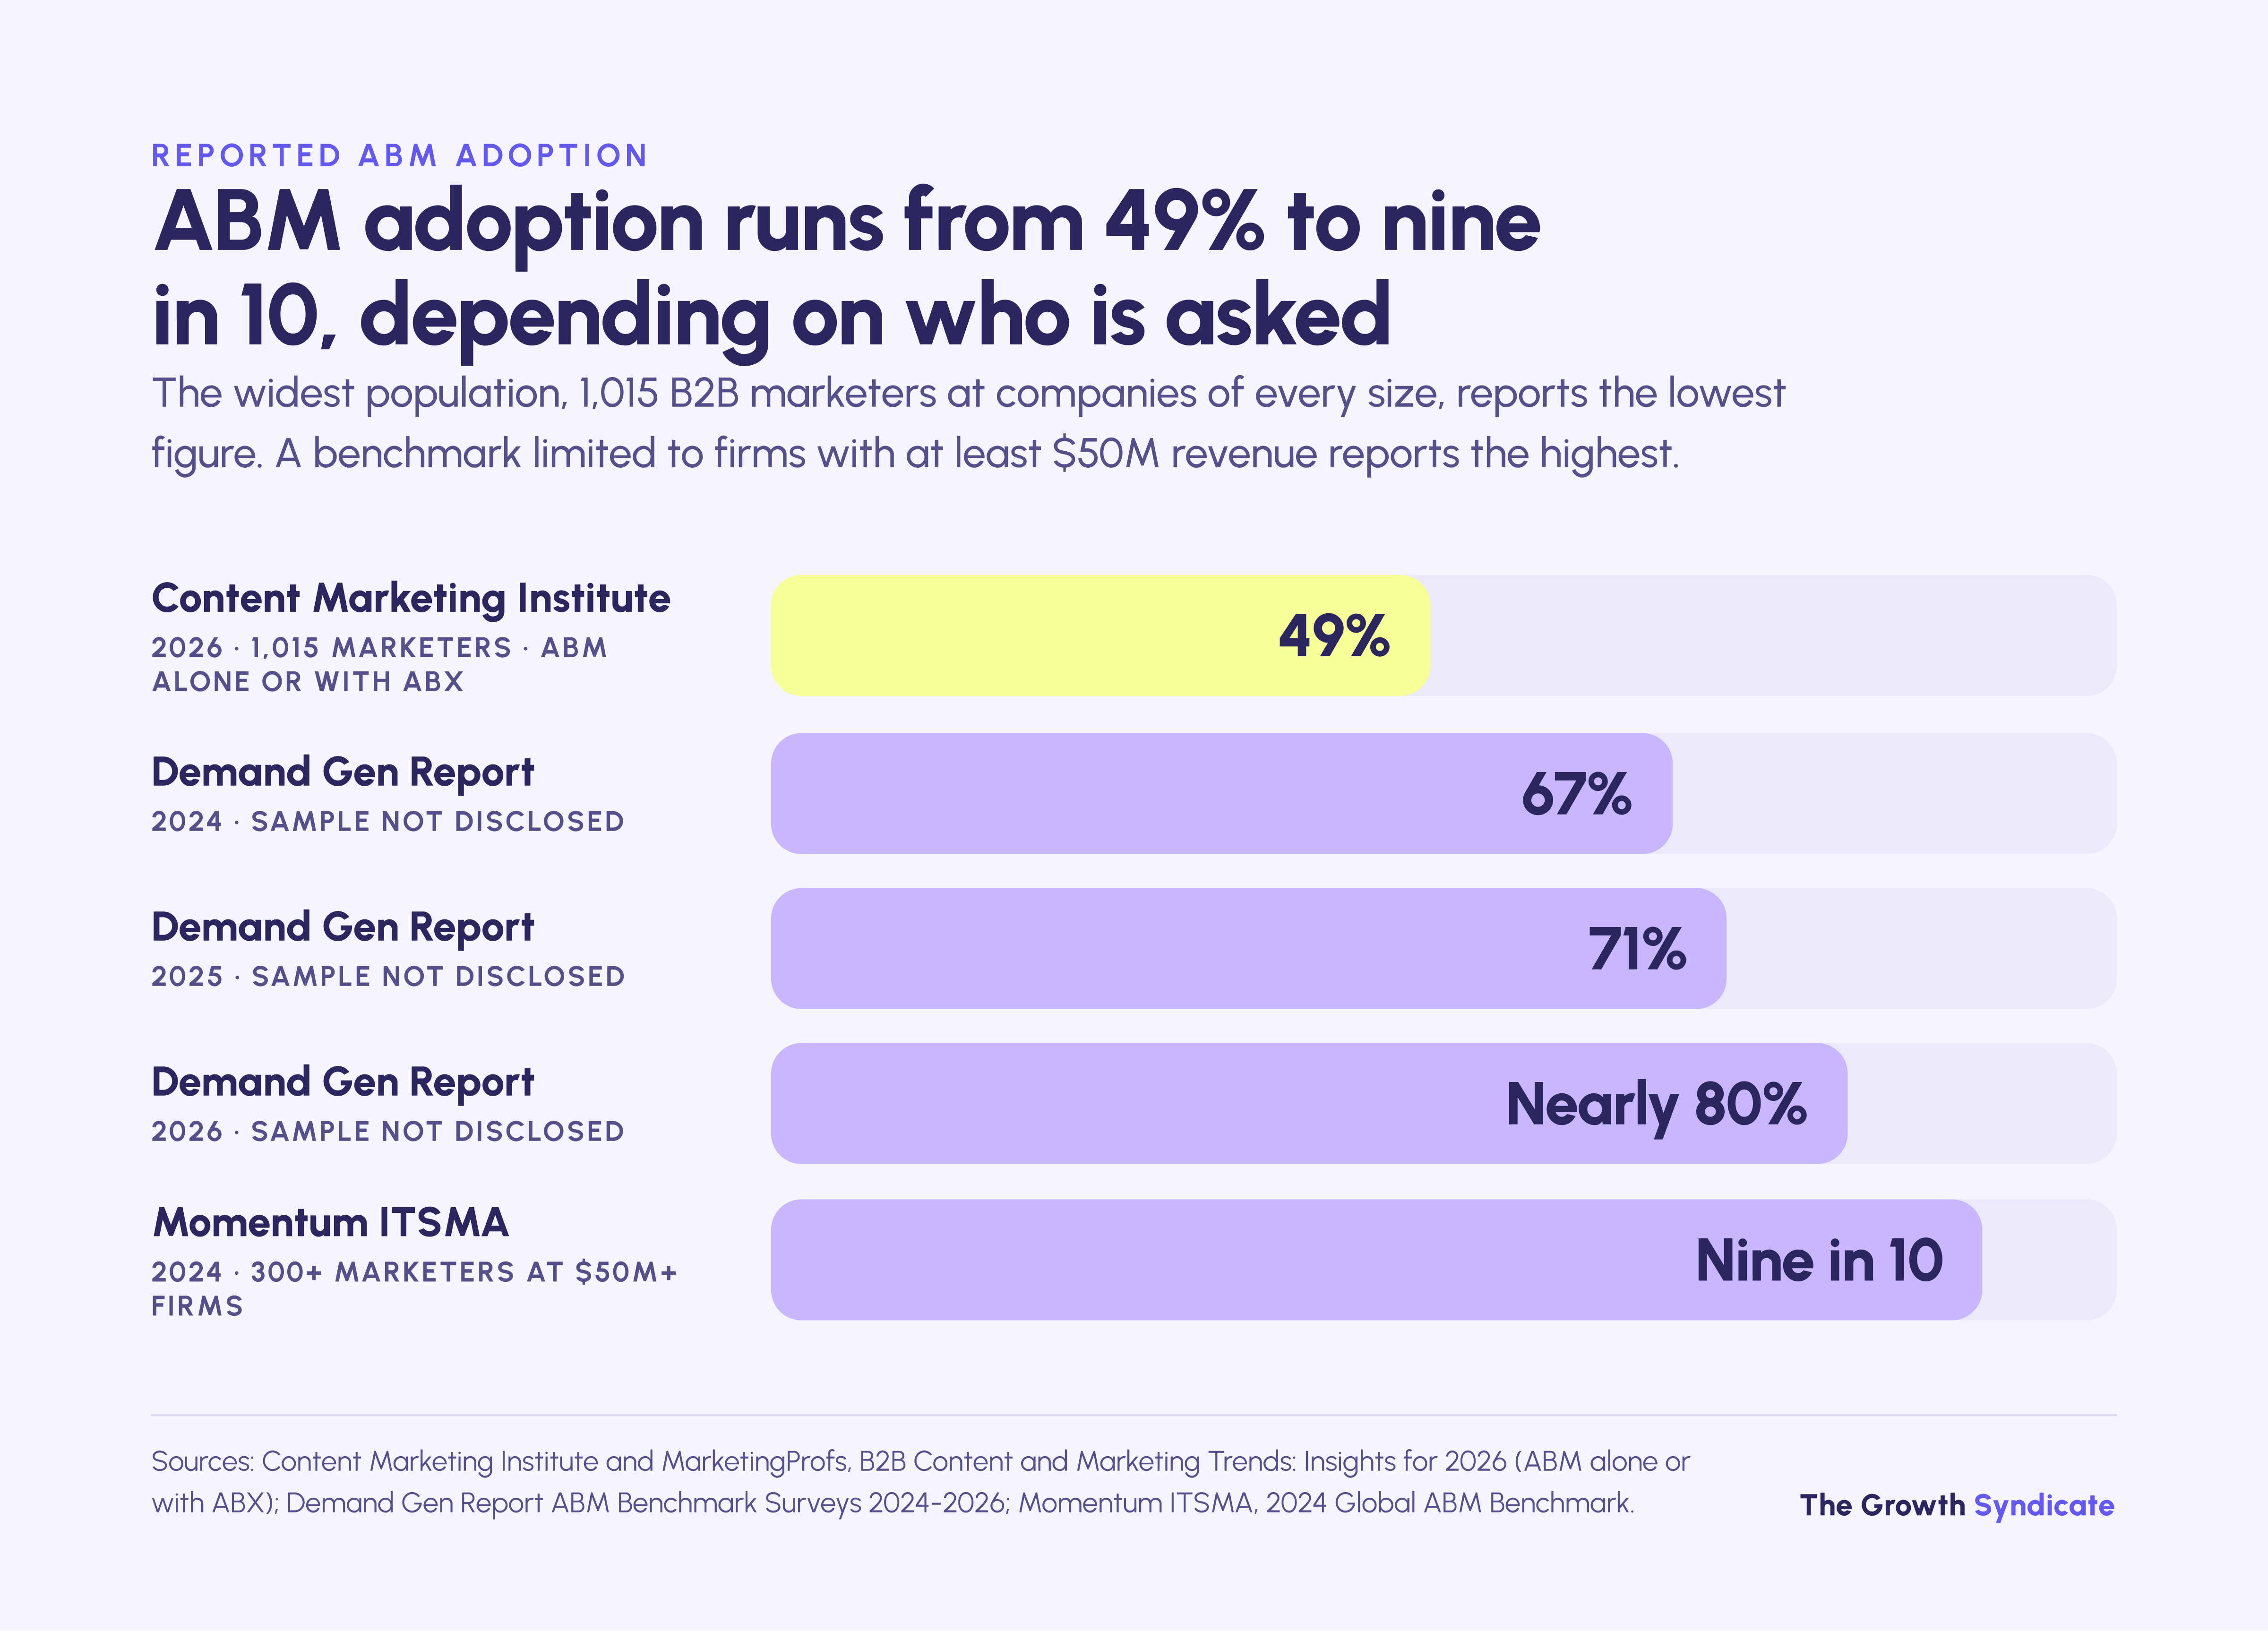
Surveys put ABM use at between about half and nine in 10 of respondents, and the spread most likely reflects who is asked and how ABM is defined. The Content Marketing Institute's 2026 study of 1,015 B2B marketers found 49%. Momentum ITSMA's 2024 benchmark, limited to firms with at least $50M revenue, found nine in 10.
Demand Gen Report's adoption figure held at 67% in 2023 and 2024, then rose. Its 2024 survey found 67% of practitioners using an ABM strategy, with another 26% planning one, and the figure reached 71% in 2025 and "nearly 80%" in its 2026 ABM Benchmark Survey. We found no public page for any of these editions that discloses its sample size or method, and the full 2026 report sits behind a form.
The Content Marketing Institute's 2026 B2B research, fielded from June to August 2025, gives the lower bound: 49% of B2B marketers use ABM, 30% on its own and 19% alongside ABX. Its base spans companies of every size, while Momentum ITSMA's 2024 benchmark surveyed more than 300 senior B2B marketers at firms with at least $50M revenue. Demand Gen Report describes its respondents only as practitioners across a wide range of industries.
Definitions drift too. Forrester's State of ABM survey for 2024 found that nearly 20% of firms have yet to define what ABM means, as reported by CRM Magazine in March 2025. A survey that counts a 400-account advertising list as ABM will report higher adoption than one that counts only named-account programs with sales attached.
Practitioners can draw the line differently again; for Ysabel Camus, it disappears altogether.

"If you are in B2B marketing, there's actually no other way to do marketing than this. For me, it's just B2B marketing: if you're not starting from the target list that sales is working on, I don't really see a lot of the value in marketing in a B2B context."
How much of the marketing budget goes to ABM?
ABM takes roughly a fifth to nearly a third of the marketing budget at companies that run it. Momentum ITSMA's 2023 study of 320 practitioners put the share at 30%, and Inflexion Group's 2026 study of 40 large enterprises at nearly 20%. Gartner's 2024 survey found 21% of the programs budget at tech firms with $100M or more in revenue.
The two ITSMA figures and Inflexion's come from people who already run ABM, so they describe marketing budgets at companies with ABM programs. Gartner's 2024 Tech Marketing Benchmarks Survey uses a different base, the programs budget rather than the whole marketing budget, and its public abstract does not say whether the average includes firms without ABM, so its 21% is not directly comparable. Inflexion Group's 2026 study adds that ABM took 14% of marketing headcount in its sample.
Spending intent pointed up in the 2023 study, the latest edition whose budget figures we could find. In the 2023 Momentum ITSMA and ABM Leadership Alliance benchmark, 66% planned to increase ABM spending in 2024. The 2024 edition, sponsored by Demandbase, is public as a short online summary with no budget figures we could find, and we found no 2025 or 2026 edition.
What is the ROI of ABM, and what do the surveys measure?
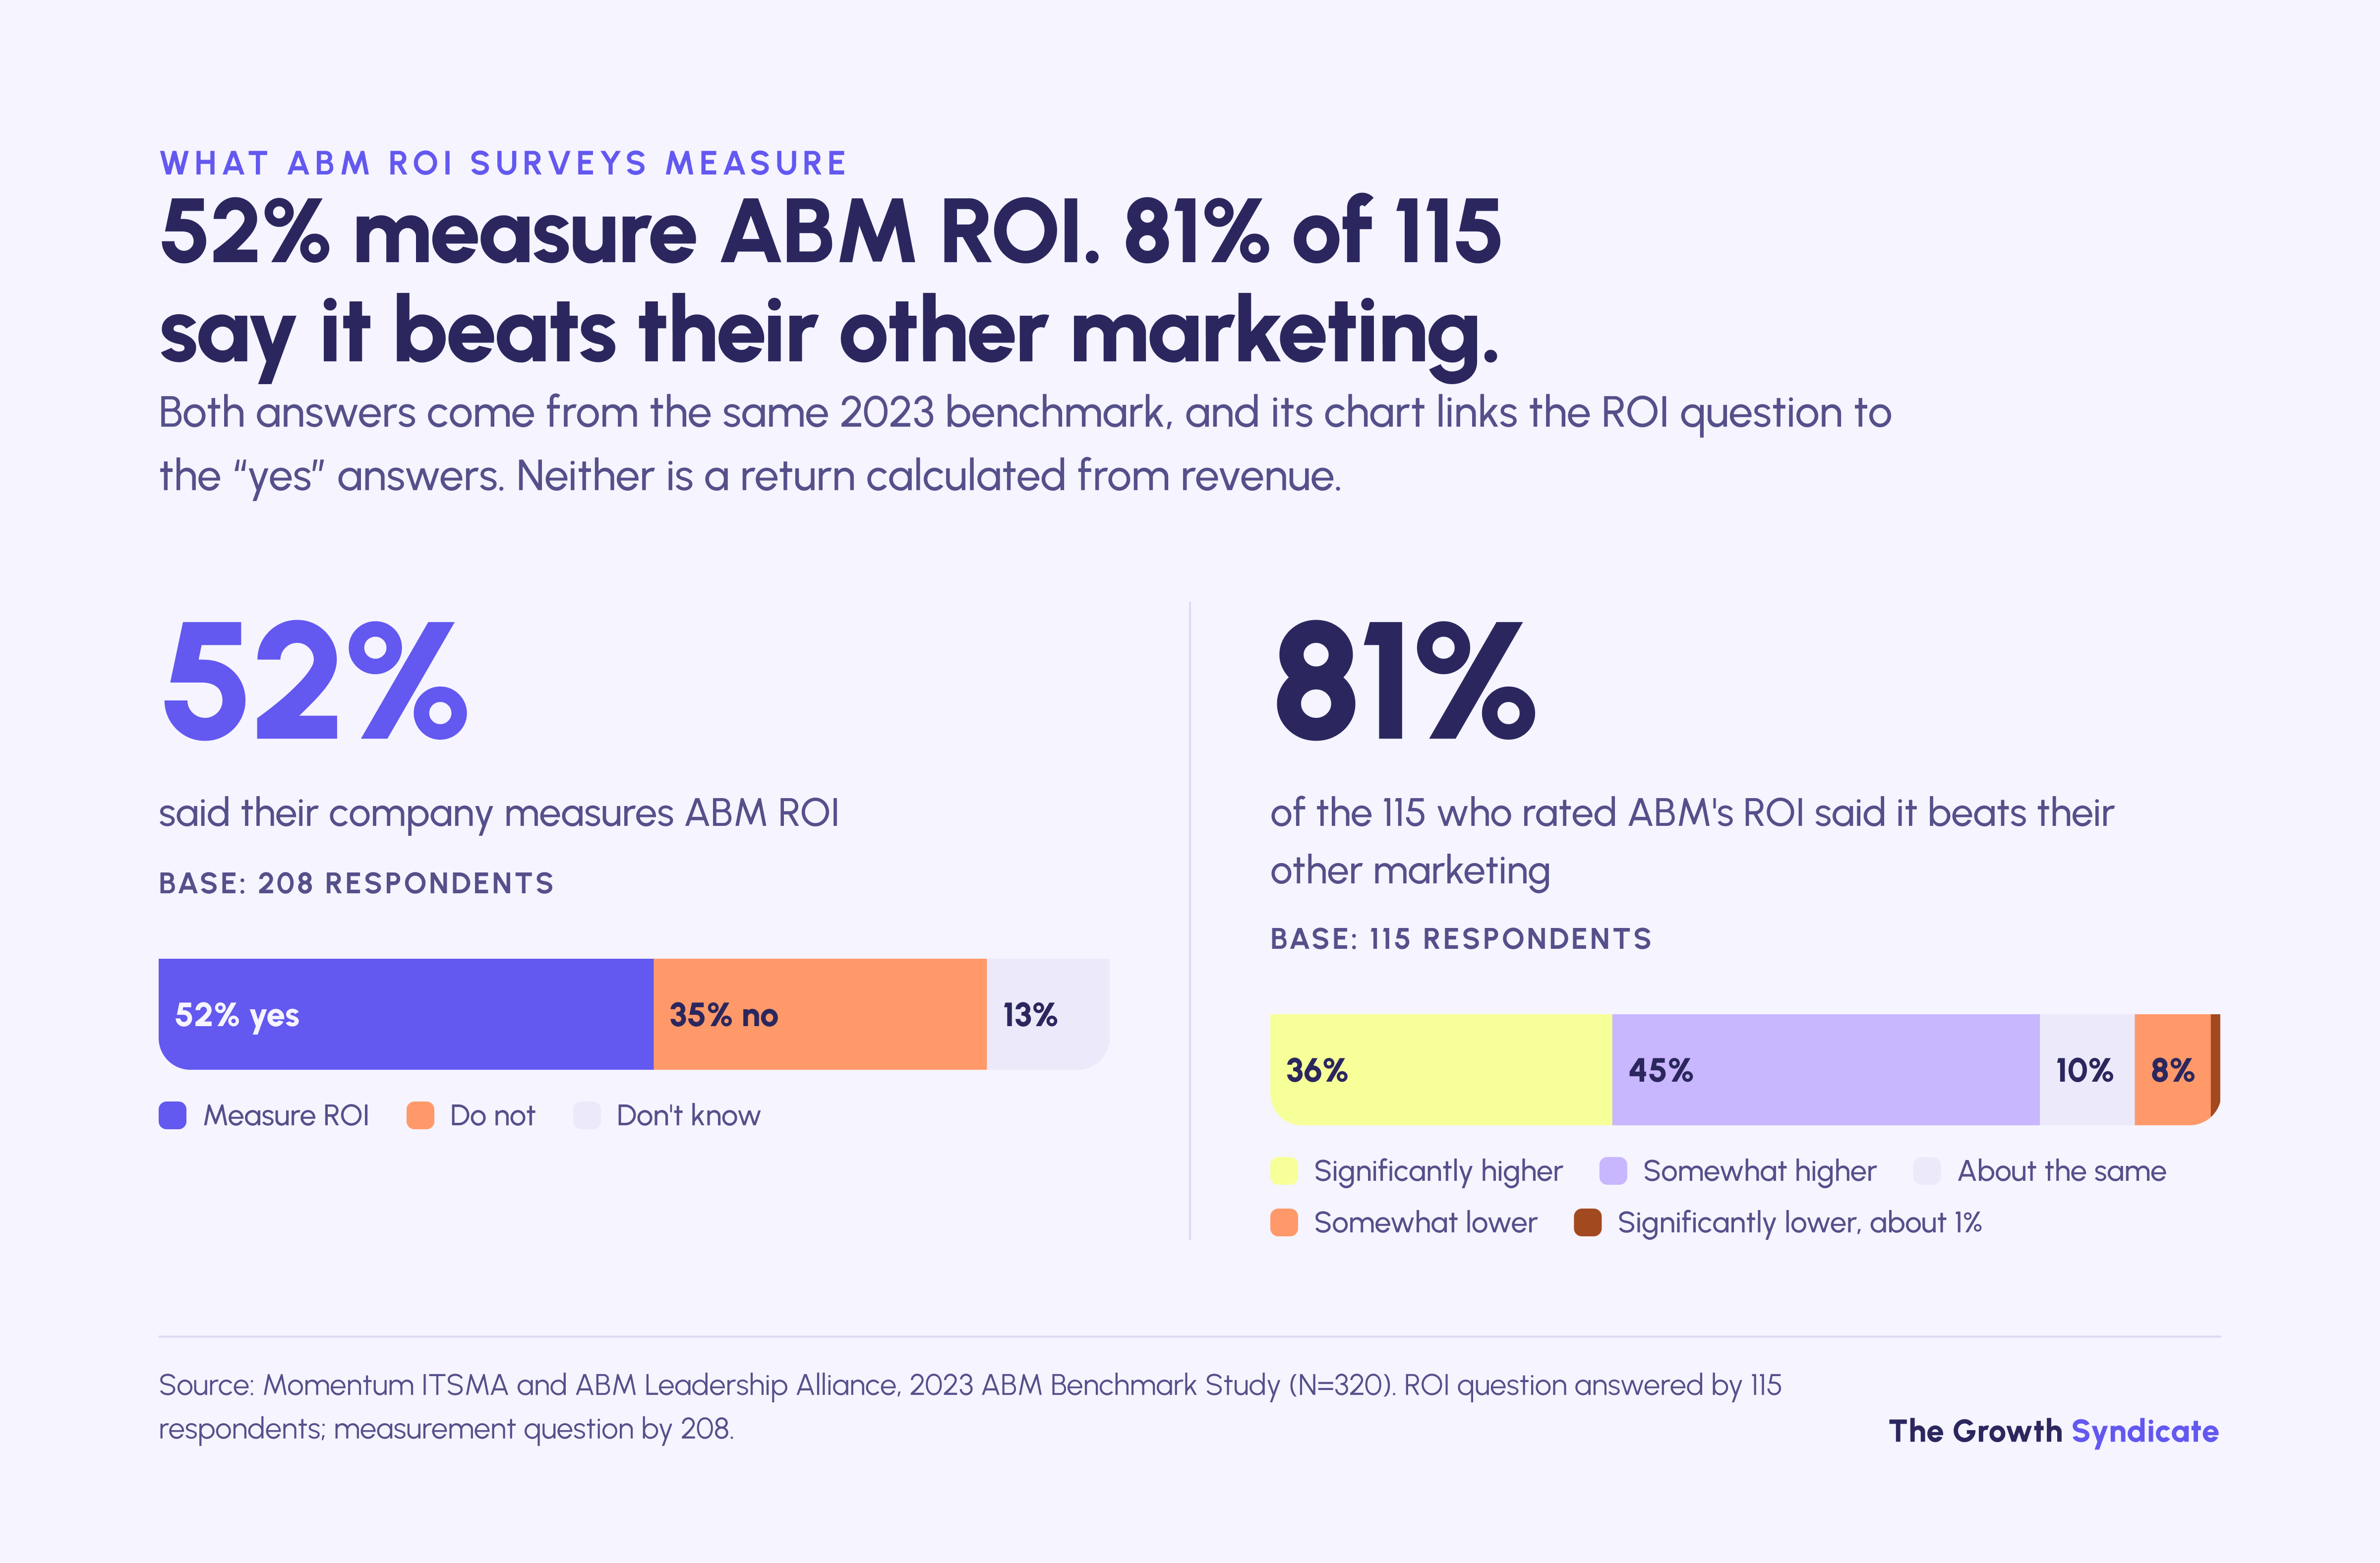
We found no public study that measures ABM's return on investment across companies. Most of the evidence is surveys asking practitioners whether ABM returns more than their other marketing. In Momentum ITSMA's 2023 benchmark, 52% of 208 respondents said their company measures ABM ROI, and 81% of the 115 who rated it said ABM returns more.
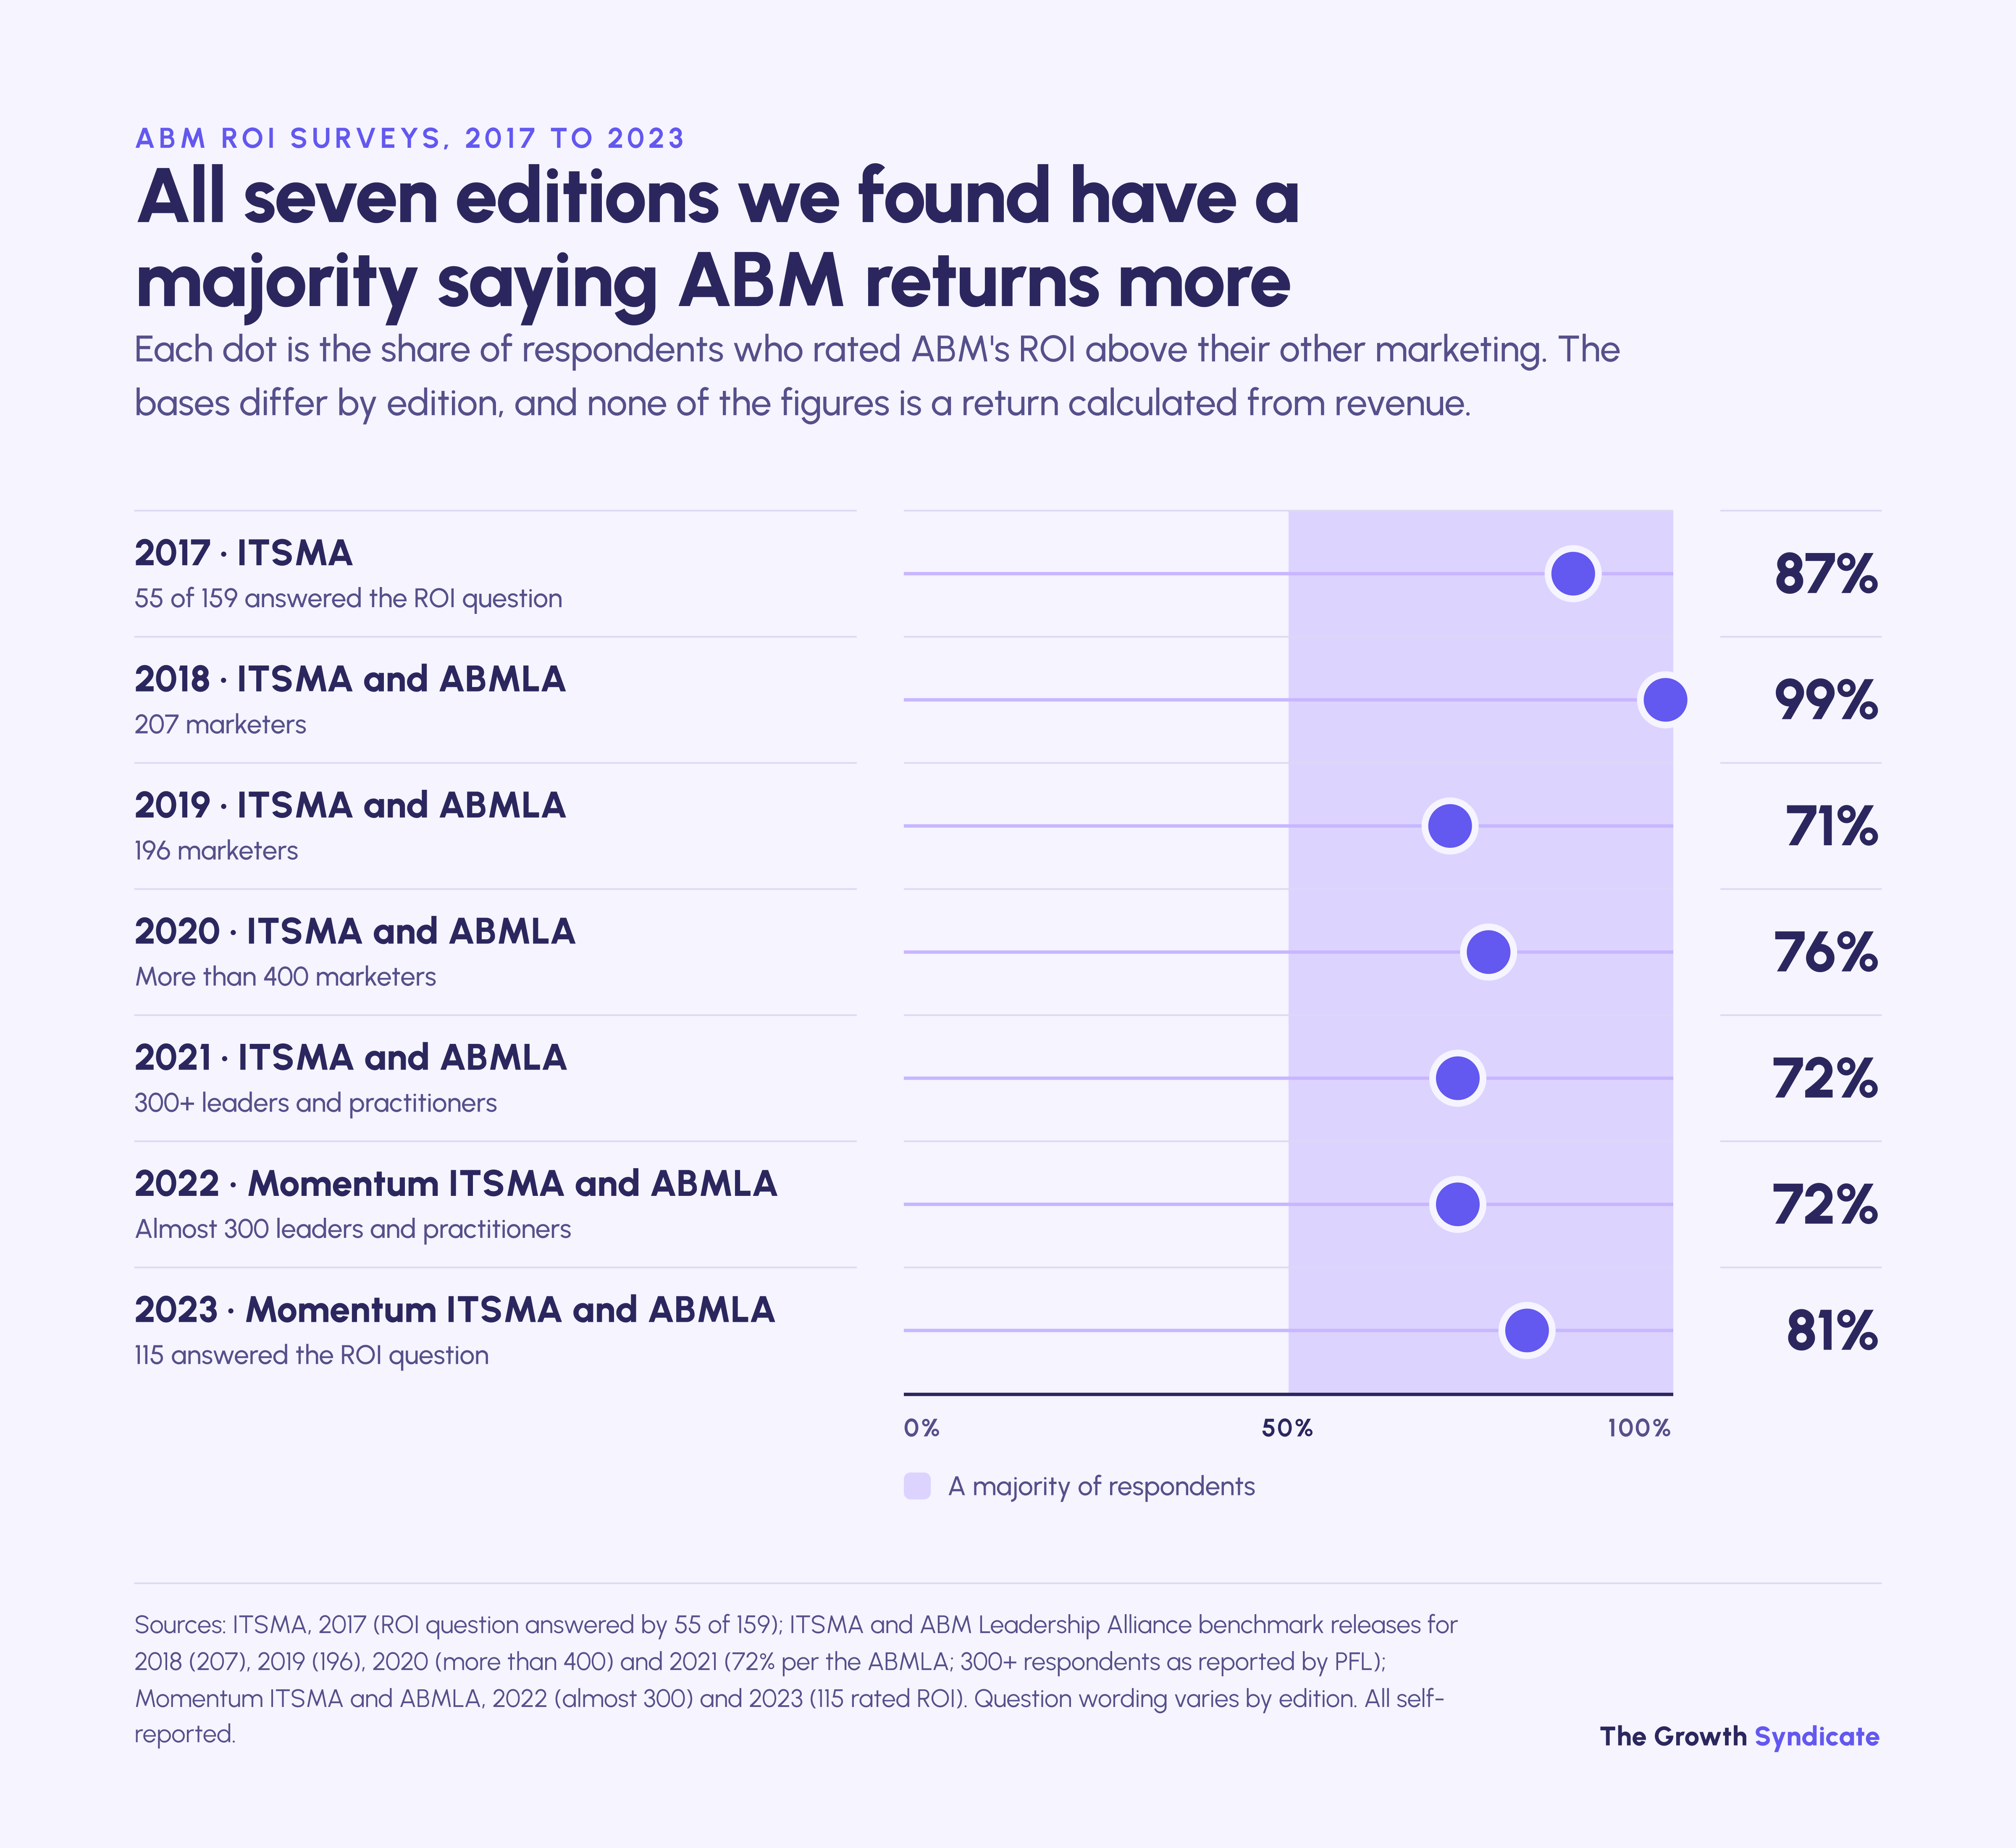
The perception series runs back to 2017, and every edition we found reports a clear majority. ITSMA's 2017 study found 87% of 55 respondents reporting higher ROI from ABM than from other marketing, and later editions ranged from 71% in 2019 to 99% in 2018. Each of those figures is an answer to a survey question, and none is a return calculated from revenue.
The 2023 chart is worth reading in full. Of the 115 respondents, 45% said ABM's ROI was somewhat higher than their other marketing and 36% significantly higher, while 10% said it was about the same, 8% somewhat lower and about 1% significantly lower. An arrow on the chart runs from the 52% of 208 who said their company measures ABM ROI to the ROI question, which suggests the 115 were mostly people who measure it, although the report does not say so.
Forrester reports the same kind of evidence in bands. Its December 2024 data snapshot on ABM ROI says the most common response among ABM decision-makers was a 21% to 50% higher ROI than non-ABM marketing, with 23% reporting 51% to 200%. The sample is not public, and the figures are what respondents reported rather than returns Forrester measured.
Vendor-commissioned Forrester Total Economic Impact studies model one platform's ROI from a few customer interviews, four in the case of Demandbase's 2022 study. They describe a tool at a handful of customers, so we leave them out of the ABM evidence.
Ferdinand Goetzen, a TGS co-founder, puts the excuse for never measuring like this:

Some performance claims are hard to square with their own data. 6sense's 2024 ABM benchmark describes a "statistically reliable" 6% difference in financial performance between respondents with and without an ABM practice, yet the measure is self-rated against expectations, and the appendix pairs a p-value of .216 and an effect size of 0.058 with a t-statistic of -6.533 that does not fit them. If you need an ROI figure for a business case, build it from your own deals, with the same caveats any B2B marketing attribution model carries.
Which ABM statistics should you stop quoting?
Nine widely repeated ABM statistics trace either to no study anyone can check or to a finding that says something else. The best known, a "171% increase" in annual contract value, is credited to a 2017 TOPO study for the ABM Leadership Alliance that we could not find. Three others trace to findings about sales and marketing alignment.
The first five have no study behind them that we could open.
The 171% figure is the one most worth retiring with care, because a real study probably sits behind it. MarTech Series' 2017 roundup credits it to TOPO and links only to two homepages, while the ABM Leadership Alliance's own blog describes the report as a comparison of pre- and post-ABM periods. We found no public copy of the study, and a before-and-after comparison would show which accounts companies chose to target as much as any lift from ABM.
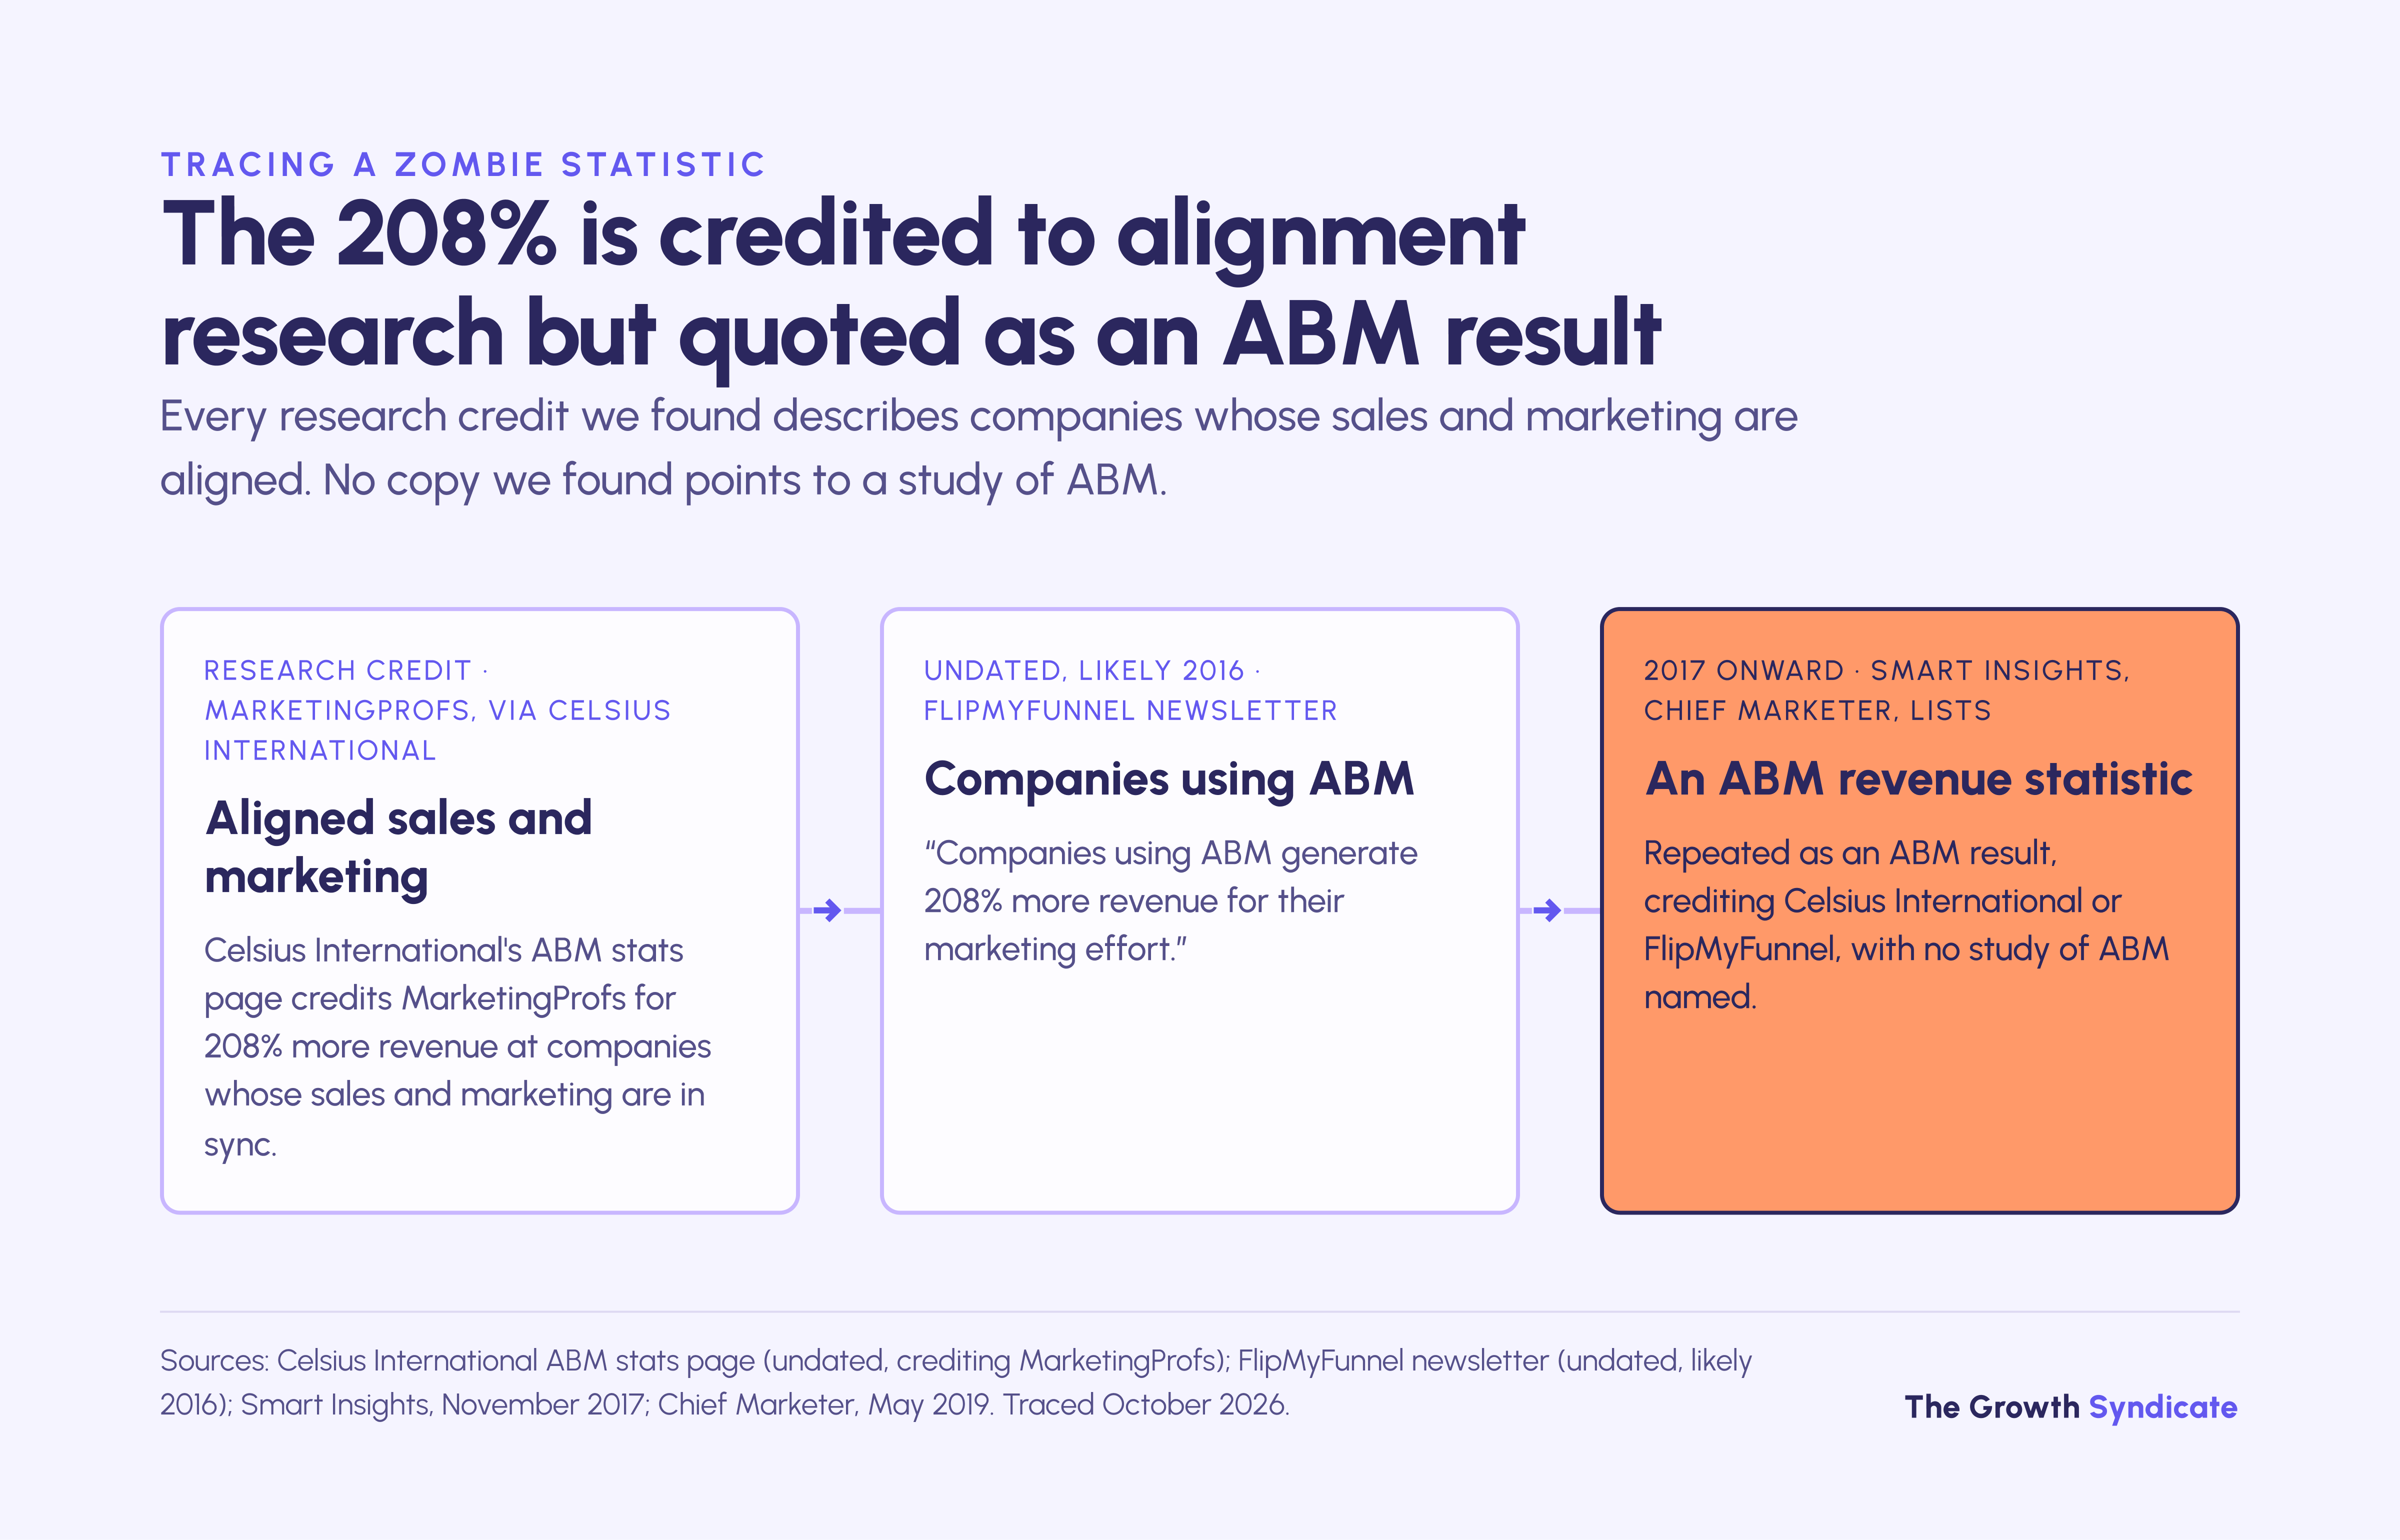
The next four figures are real, but they say something other than what gets quoted.
ITSMA's 87% belongs in a separate bin: the figure is real and comes from a 2017 study of 159 marketers, but it rests on the 55 respondents who answered the ROI question, and it is nine years old. Quote the 2022 and 2023 editions instead, with their samples.
What measured ABM outcomes exist?
Measured ABM outcomes are scarce, and we found none from a controlled study. The strongest public data measures buying groups rather than ABM itself: Ebsta and Pavilion's 2024 analysis of 4.2 million opportunities found won deals had 9 contacts engaged at the solution-presented stage, against 2 for lost deals. Demandbase's 2026 customer data adds correlations.
Ebsta and Pavilion's 2024 benchmarks cover 530 companies and mostly 2023 data.

The other measured figures we found come from Ebsta and Pavilion's 2025 GTM Benchmarks, built on 655,000 opportunities, and Demandbase's State of ABM 2026 report, drawn from 1,452 Demandbase tenants, its term for a Demandbase instance. Each carries a limit worth quoting with it.
None of these comes from a controlled study. Companies that buy more of a platform may also run more mature programs, and vendor ABM measurement often rests on engagement scores built from intent data, which can show an account is active without showing that ABM caused the deal.
ABM results from four TGS programs
Four TGS programs have published ABM results, and each figure below is taken from the client's live case study. They range from 10+ enterprise deals influenced or driven by ABM at Rapid Circle to €325,250 in influenced pipeline at LangWatch. Four programs are evidence, but too few to make a benchmark.
At Frends, a European integration platform, the case study also reports 26 current opportunities and about €75K in monthly recurring revenue in Sweden. At LangWatch, ABM moved an AI observability company upmarket, with the 42 deals and €325,250 counted as ABM-influenced. Nobel Recruitment reports pipeline influenced by ABM and LinkedIn, while Rapid Circle counts deals influenced or driven by ABM without splitting the two.
"Influenced" is an attribution choice. Three of the four case studies count influenced pipeline or deals, while Frends counts direct opportunities attributable to ABM and paid. In our reporting, a deal counts as influenced when its account engaged with the program before or during the opportunity, a looser test than "sourced", where the program created the opportunity.
Field note: Nobel
Nobel had no dedicated marketing function, and one of the program's ideas used an asset the firm already had: a CRM with thousands of contacts, many of whom had worked with Nobel before. Ysabel Camus, who ran the program, turned those contacts into the audience for LinkedIn ads and thought leadership under a new positioning around hires that change a company's growth trajectory, and the case study records thought leadership drawing the strongest response. Her reasoning was that people in SaaS typically stay in a job for two or three years, so a recruiter's past contacts keep turning up in roles where they hire.
"People they had worked with in the past couple of years started seeing their ads and their thought leadership posts on LinkedIn. Most of the time, those people would send them a DM: 'Hey, I saw your post. It reminded me I'm actually hiring somebody right now.'"
Field note: Frends
The change at Frends was focus on the right industries and accounts, plus a weekly engagement file that sales reviewed and marked account by account as useful or not. That weekly review is the part of the program we would copy first, because it is where engagement data becomes a sales list instead of a marketing report.
Field note: LangWatch
At LangWatch, outbound ran alongside the ABM program that LinkedIn carried. Across 1,085 contacts the outbound reply rate was 11.1%, and the sequences with LinkedIn remarketing running alongside them consistently outperformed the sequences that ran alone. We read that as an argument for running the channels together rather than buying them separately.
Why do ABM programs fail?
The self-rated ABM success rates we found run from 26% to 93%, so the failure rate depends on who is asked and how success is defined. N.Rich's 2025 survey of 107 B2B go-to-market leaders found 26% rating their program successful and 31% unsuccessful. Foundry's 2023 survey of 500 tech marketers had 93% rating their ABM very or extremely successful.
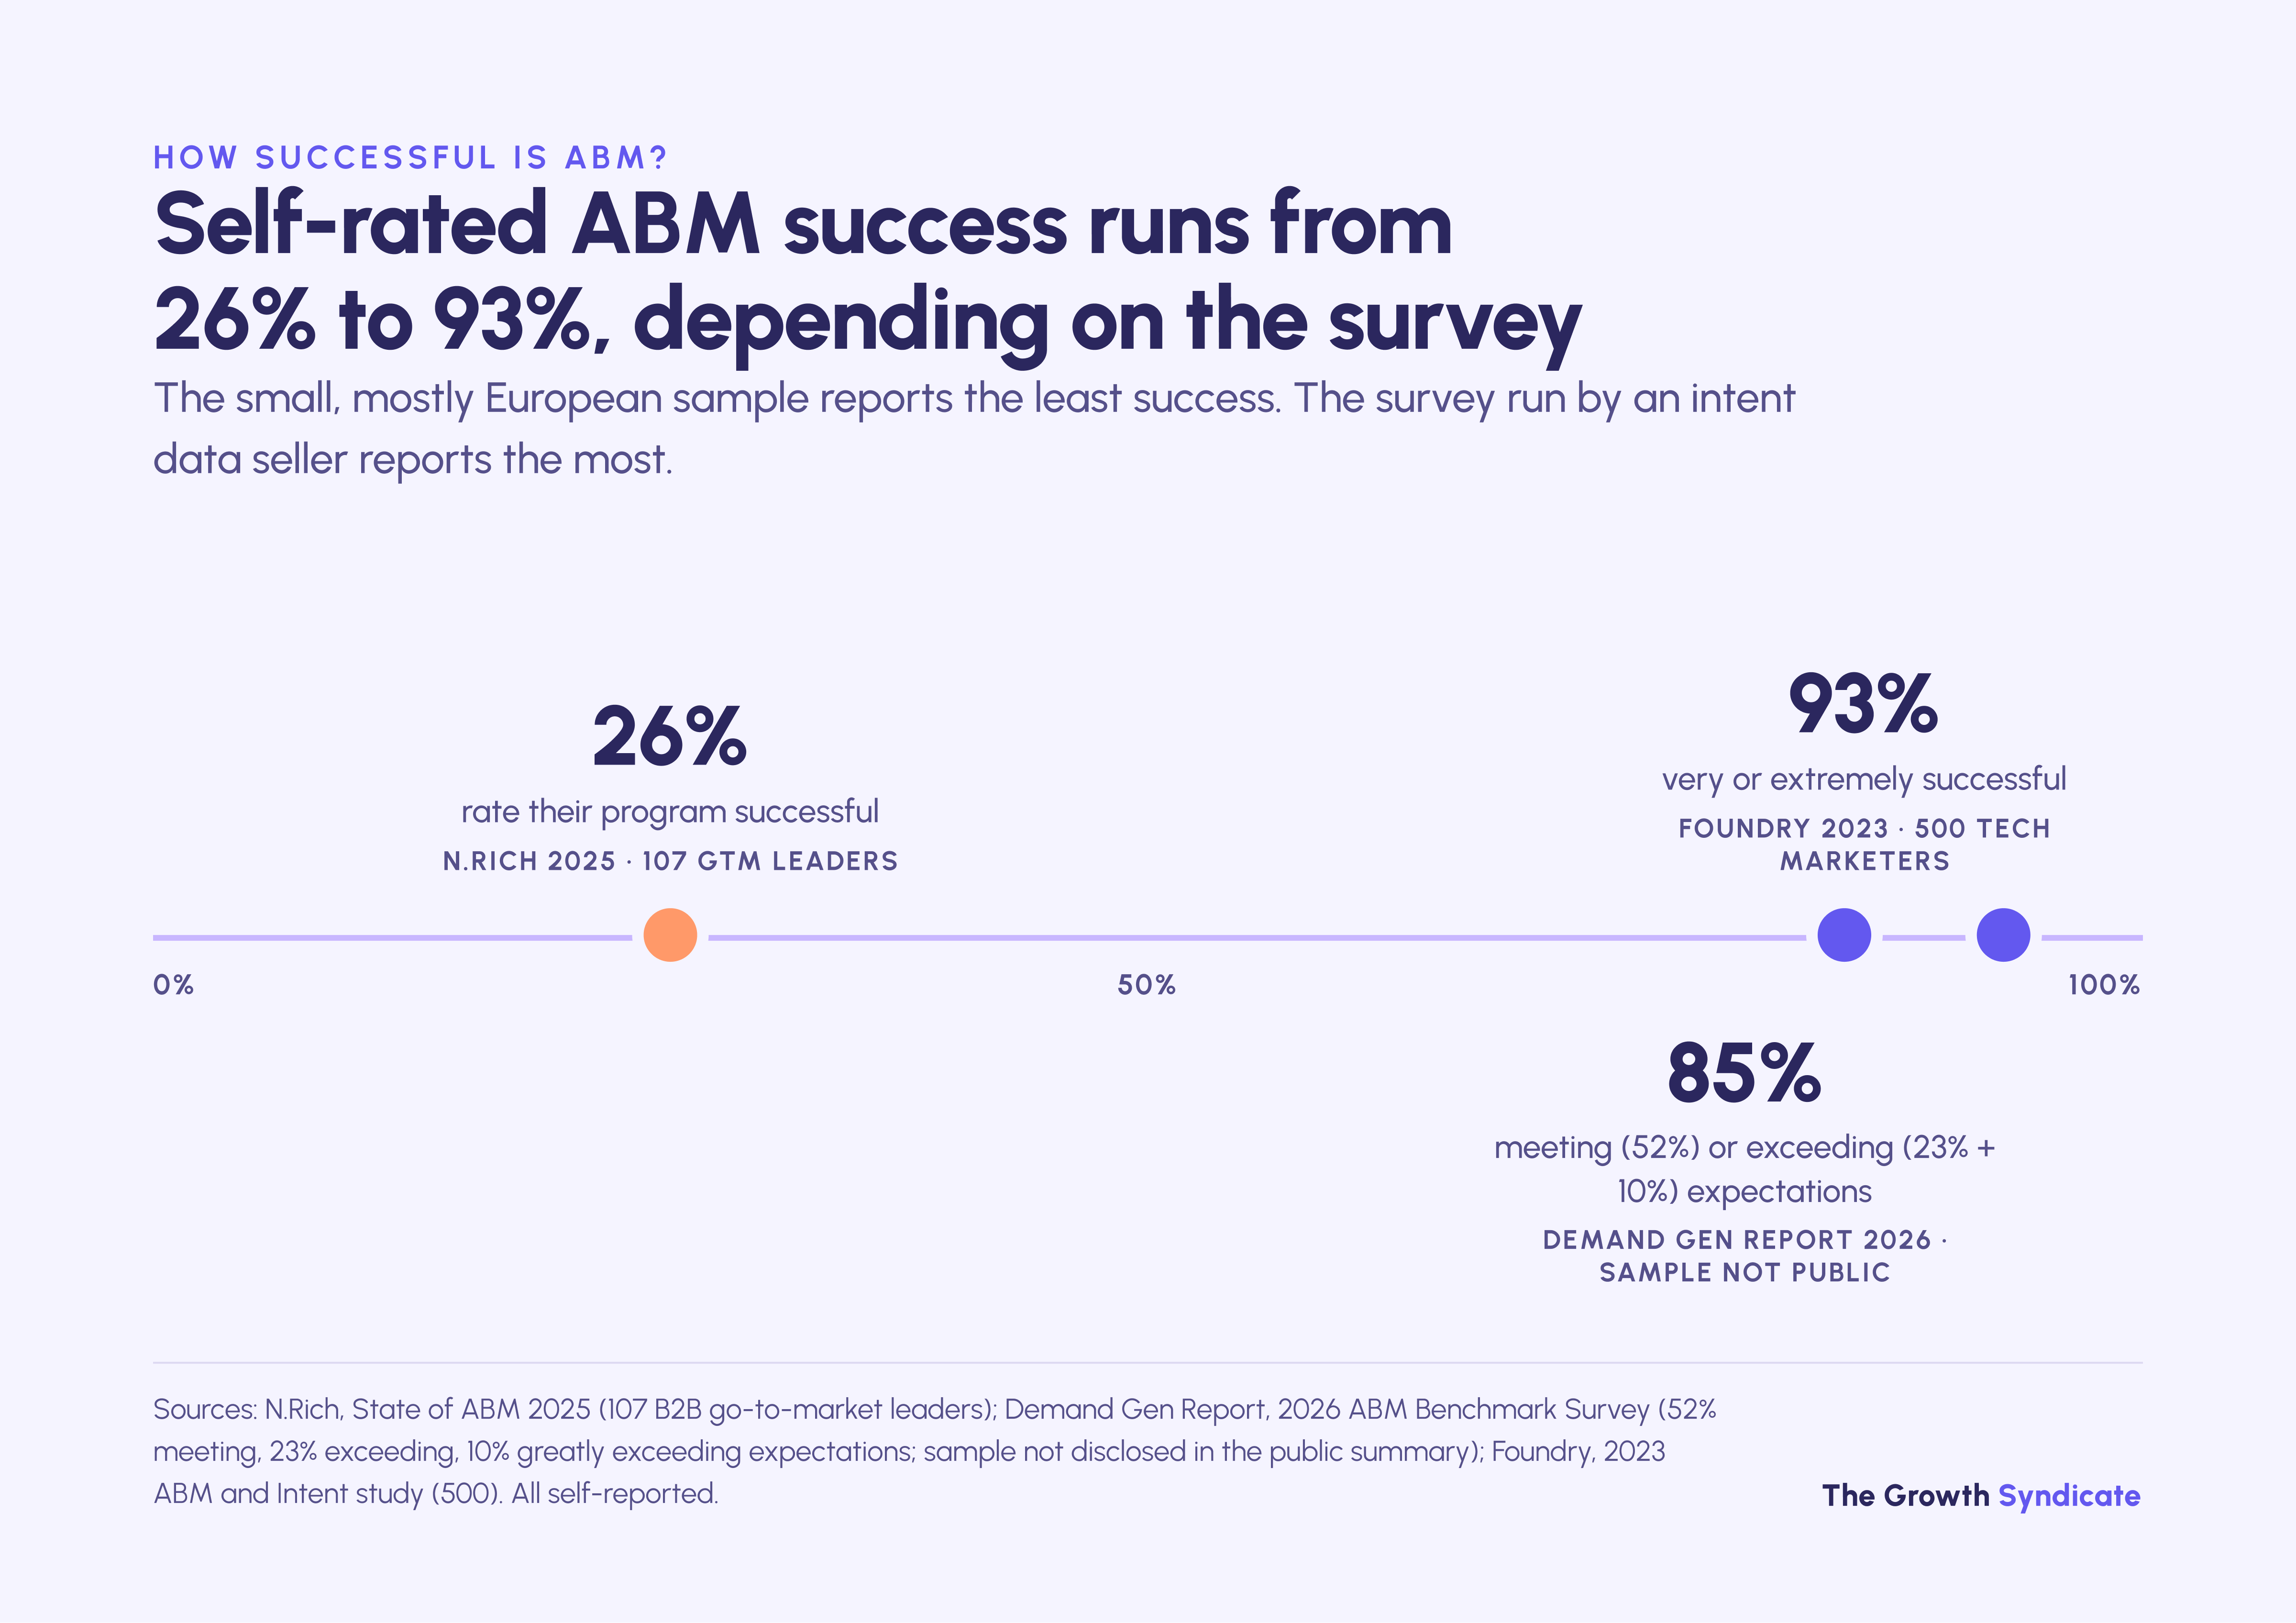
Differences in sample and sponsor may explain much of the spread: N.Rich's State of ABM report is small and 58% European, and Foundry sells intent data. Demand Gen Report's public summary of its 2026 survey, where 52% said their ABM was meeting expectations and another 33% said it was exceeding or greatly exceeding them, discloses no sample. The one study we found that examines failure directly is older: BCG's 2020 interviews with 34 executives at 21 companies found more than half of the account-based engagement programs it identified failed initially, and that 67% of strategic and 75% of scaled programs went on to succeed after companies regrouped.
"It's very easy to fail on the first try, and it's very easy to say this thing doesn't work, it's just trendy and popular. But experimenting with it one time isn't enough. The best ABM campaign I ran, I think I had to revise two or three versions of it before it suddenly clicked."
The causes are more consistent than the rates. The executives BCG interviewed named a lack of sales support and alignment with marketing as the overwhelming reason for failure, and Momentum ITSMA's 2023 report lists educating sales on ABM process and value first among its top five people challenges. Gartner's 2024 survey found attribution (39%), measuring ABM success (36%) and a lack of people (36%) as the leading challenges, while Forrester's 2024 survey put insufficient staff first at 37%.
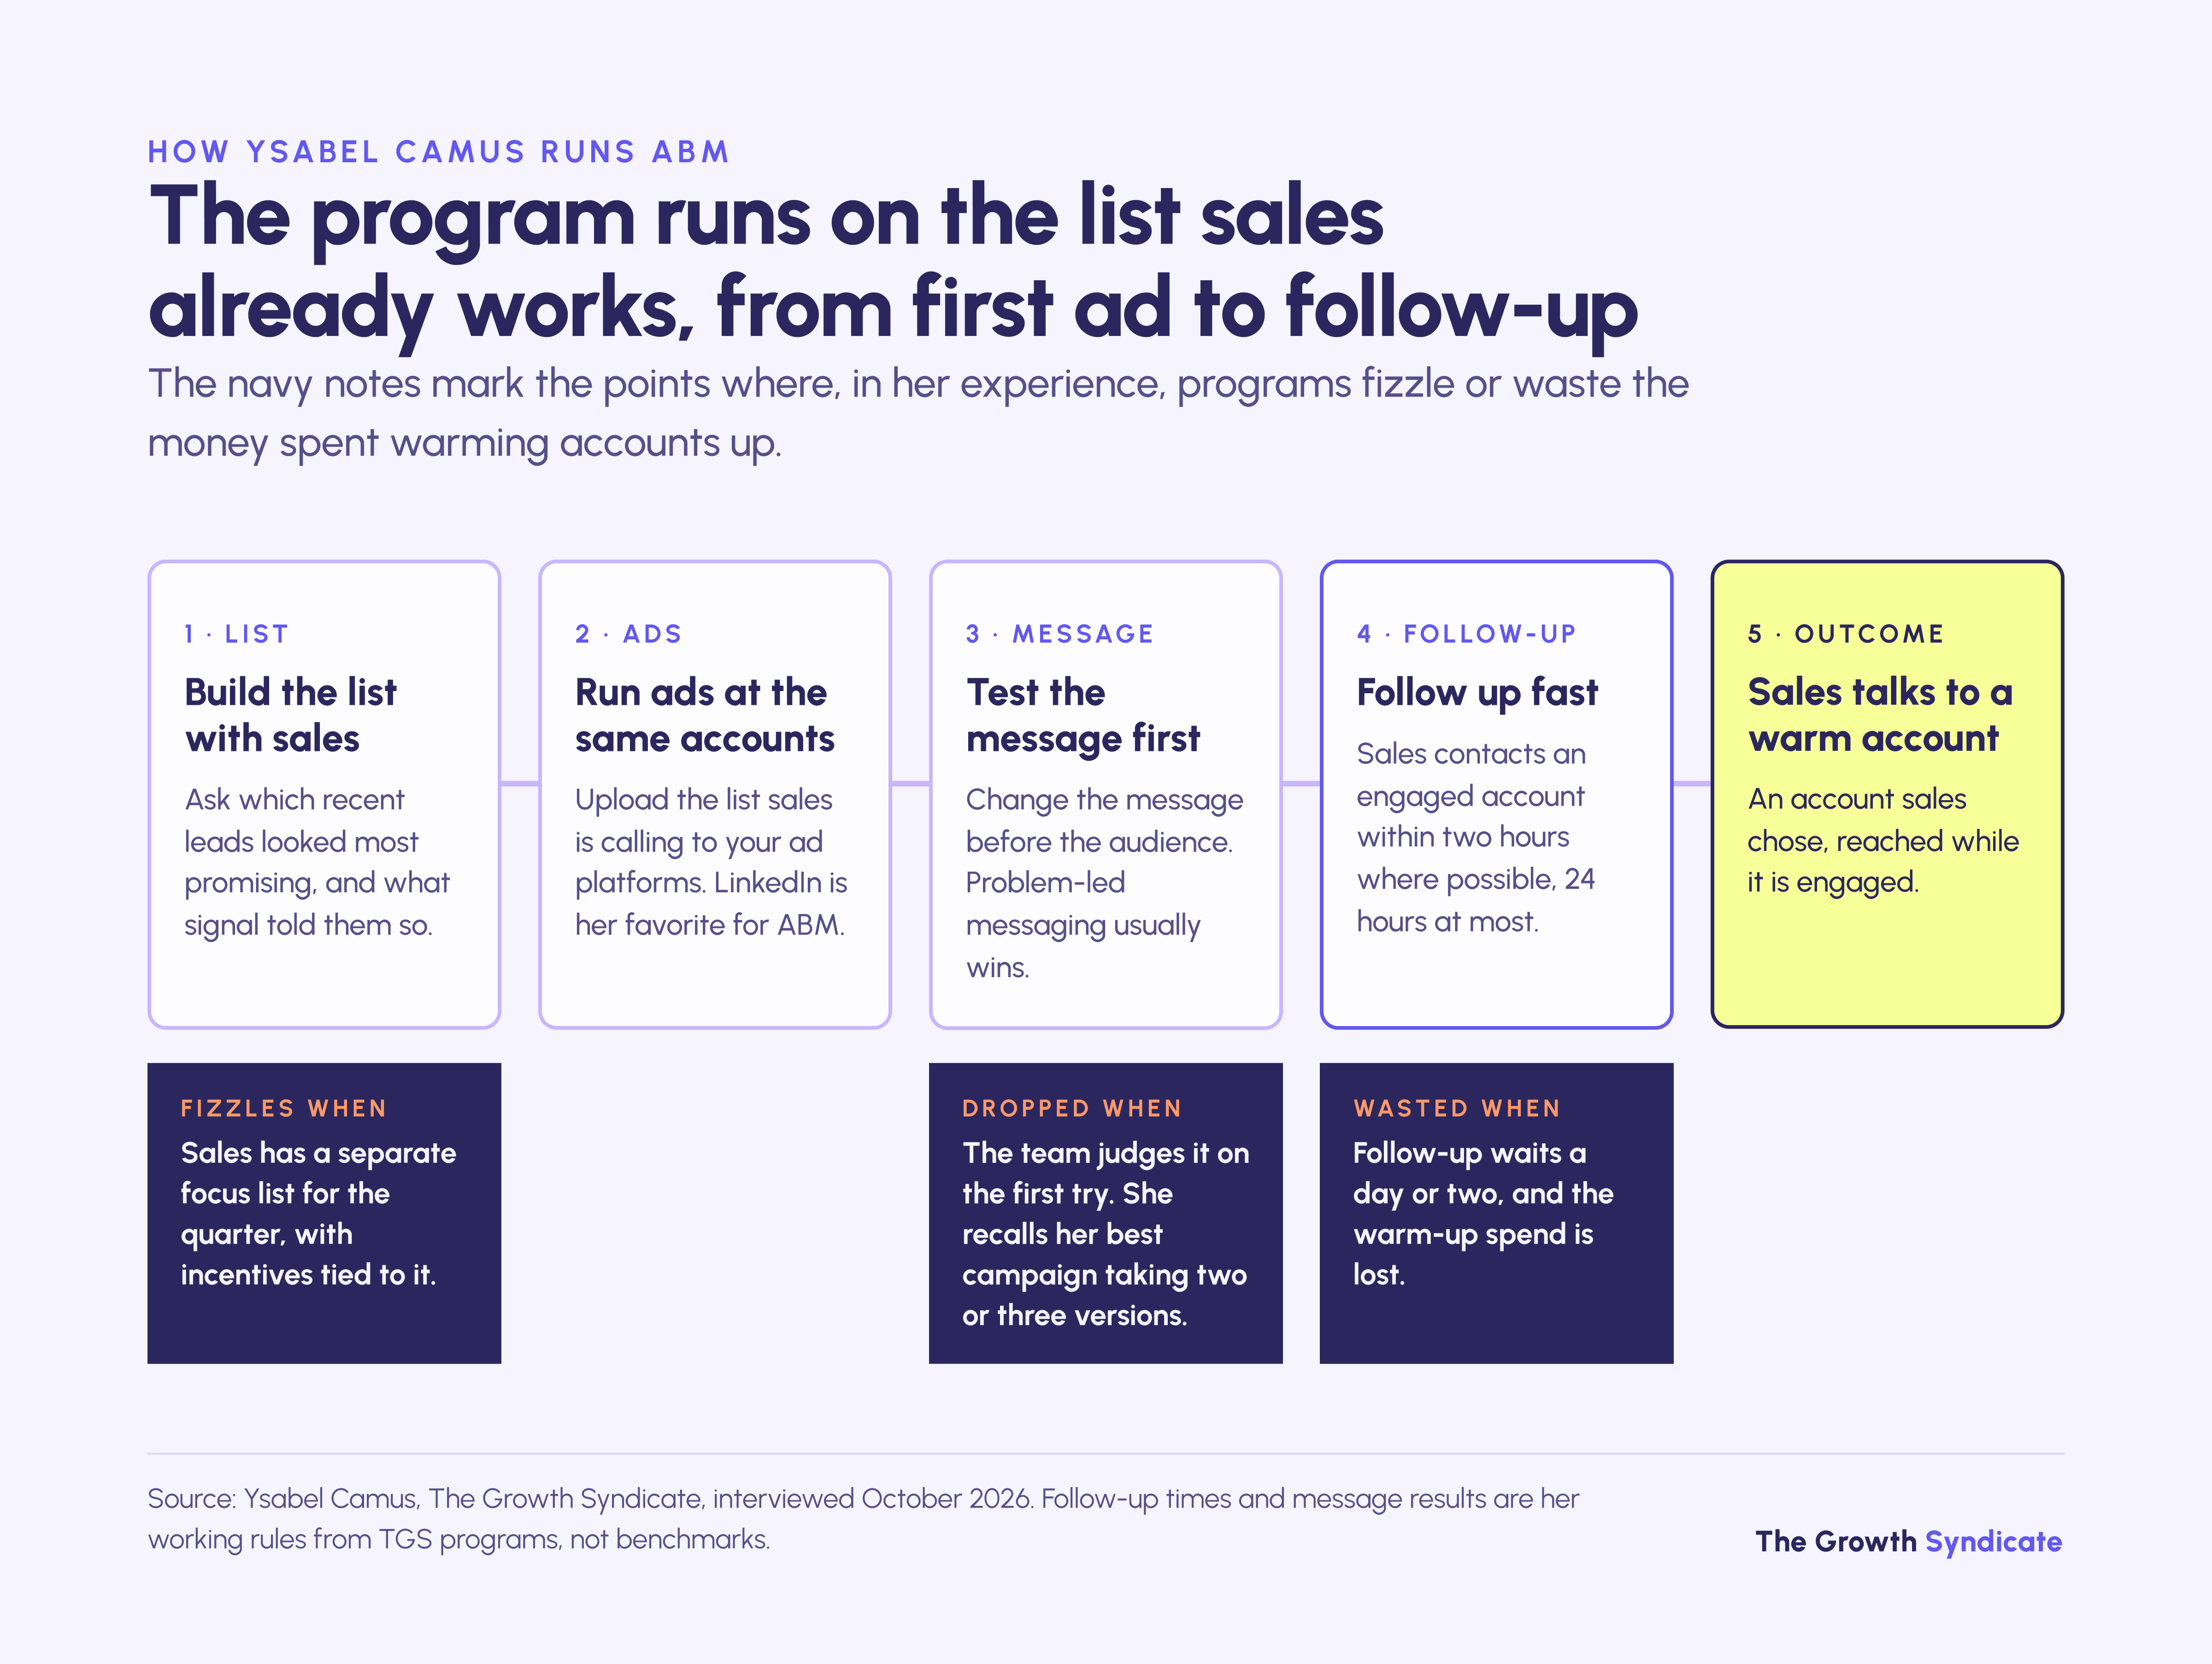
Ysabel's experience points the same way. In the companies where she has seen ABM start and then fizzle out, sales usually had a separate focus list for the quarter, with incentives tied to it, so engaged ABM accounts felt like extra work. Her rule is that sales follows up on an engaged account within two hours where possible and within 24 hours at most, because after a day or two the money spent warming the account up is wasted.
Shared targets are one of the cheaper fixes. They belong to sales and marketing alignment more than to ABM tooling, so a platform bought before sales agrees on the account list leaves the main cause in BCG's study in place.
How many people are in a B2B buying group?
A typical B2B purchase involves 13 internal stakeholders and nine external influencers, according to Forrester's 2026 State of Business Buying. That buying group is the audience an ABM program exists to reach, and Forrester's 2024 edition found 86% of B2B purchases stall during the buying process. A program that reaches one contact per account misses most of that group.
The buyers move first. 6sense's 2025 Buyer Experience Report, based on nearly 4,000 buyers, found first contact with a seller came 61% of the way through the journey, that buyers initiated 79% of engagements, and that they evaluated 5.1 vendors on average. In 95% of purchases the winner was already on the roughly four-vendor shortlist buyers held on day one.
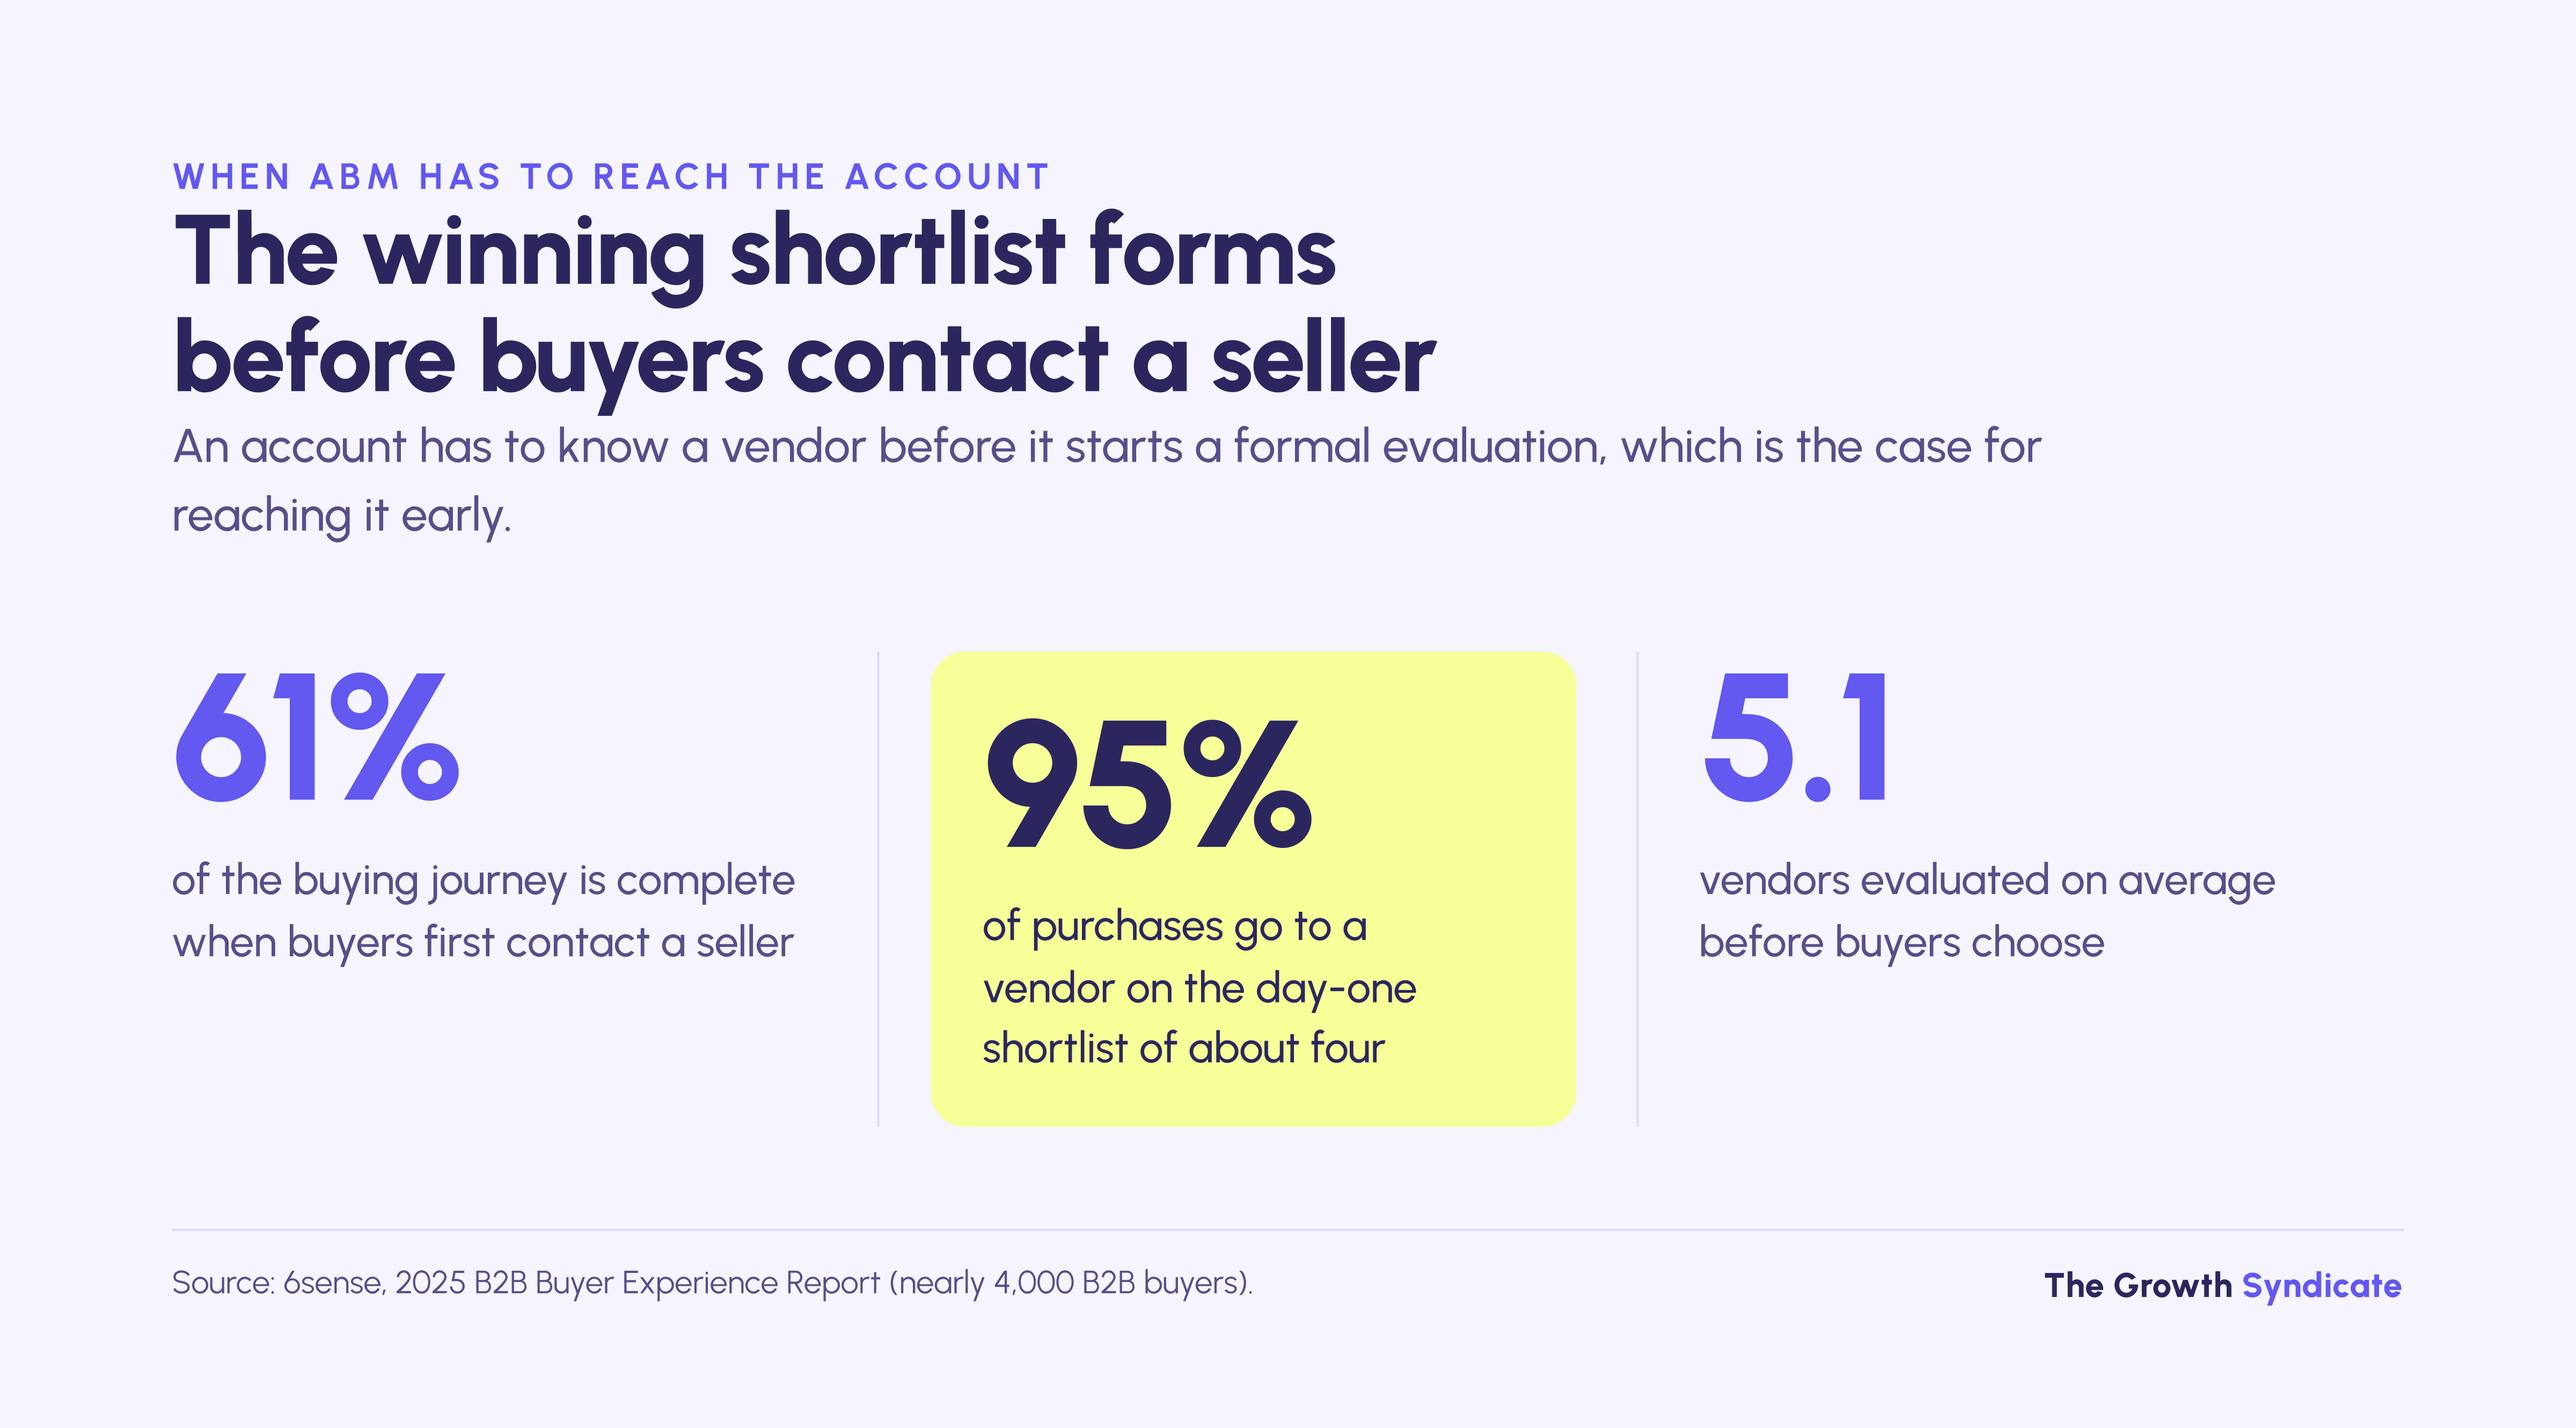
That timing is the practical case for ABM: an account has to know a vendor before it starts a formal evaluation. Forrester's 2026 press release adds that buying groups grow for complex purchases, and Ebsta and Pavilion's 2025 data shows new-business deals engaging 8 stakeholders on average against 5 for expansion. Reaching that group means targeting by role, which is why LinkedIn is Ysabel's favorite channel for ABM.
"Usually I'm a fan of using LinkedIn ads for ABM because the targeting capabilities of LinkedIn are still the best match for B2B. You can target the audience by job title, by job function, by seniority level, by the company they work at, by the industry and the company size."
Which ABM tier fits your deal size?
One-to-one ABM pays only when a single account is worth a great deal, and TGS's working threshold is an annual contract value of about €300K. Below that line, one-to-few and one-to-many programs fit better. In Momentum ITSMA's 2023 benchmark, one-to-one programs typically covered 5-100 accounts, while one-to-many programs typically covered 500-2,500.
The account ranges and the new-prospect shares come from page 28 of the 2023 benchmark, where the median program covered 250 accounts and the largest 8,500. Existing customers took 51% of one-to-one programs' focus, so the heaviest ABM tier is as much an expansion motion as a new-logo one. On page 29, 45% of respondents' companies under $100M revenue ran one-to-one ABM, against 66% of those with $1B or more.

Market size changes the answer as well. In our experience, when a company has only a few hundred potential customers, everything it does to reach them is effectively ABM. The split matters mainly for companies selling into thousands of accounts, and our guide to demand generation vs lead generation shows where ABM sits between demand creation and capture.
For one-to-few programs, the cluster is the unit of personalization, so the quality of the segmentation behind the account list shapes much of the result.
Below the €300K line, ABM takes cheaper forms. Ysabel recalls ABM paying off at a company whose average annual deal was about 5,000 to 7,000, because the team judged the return on customer lifetime value and churn was very low.
Check your ABM fit
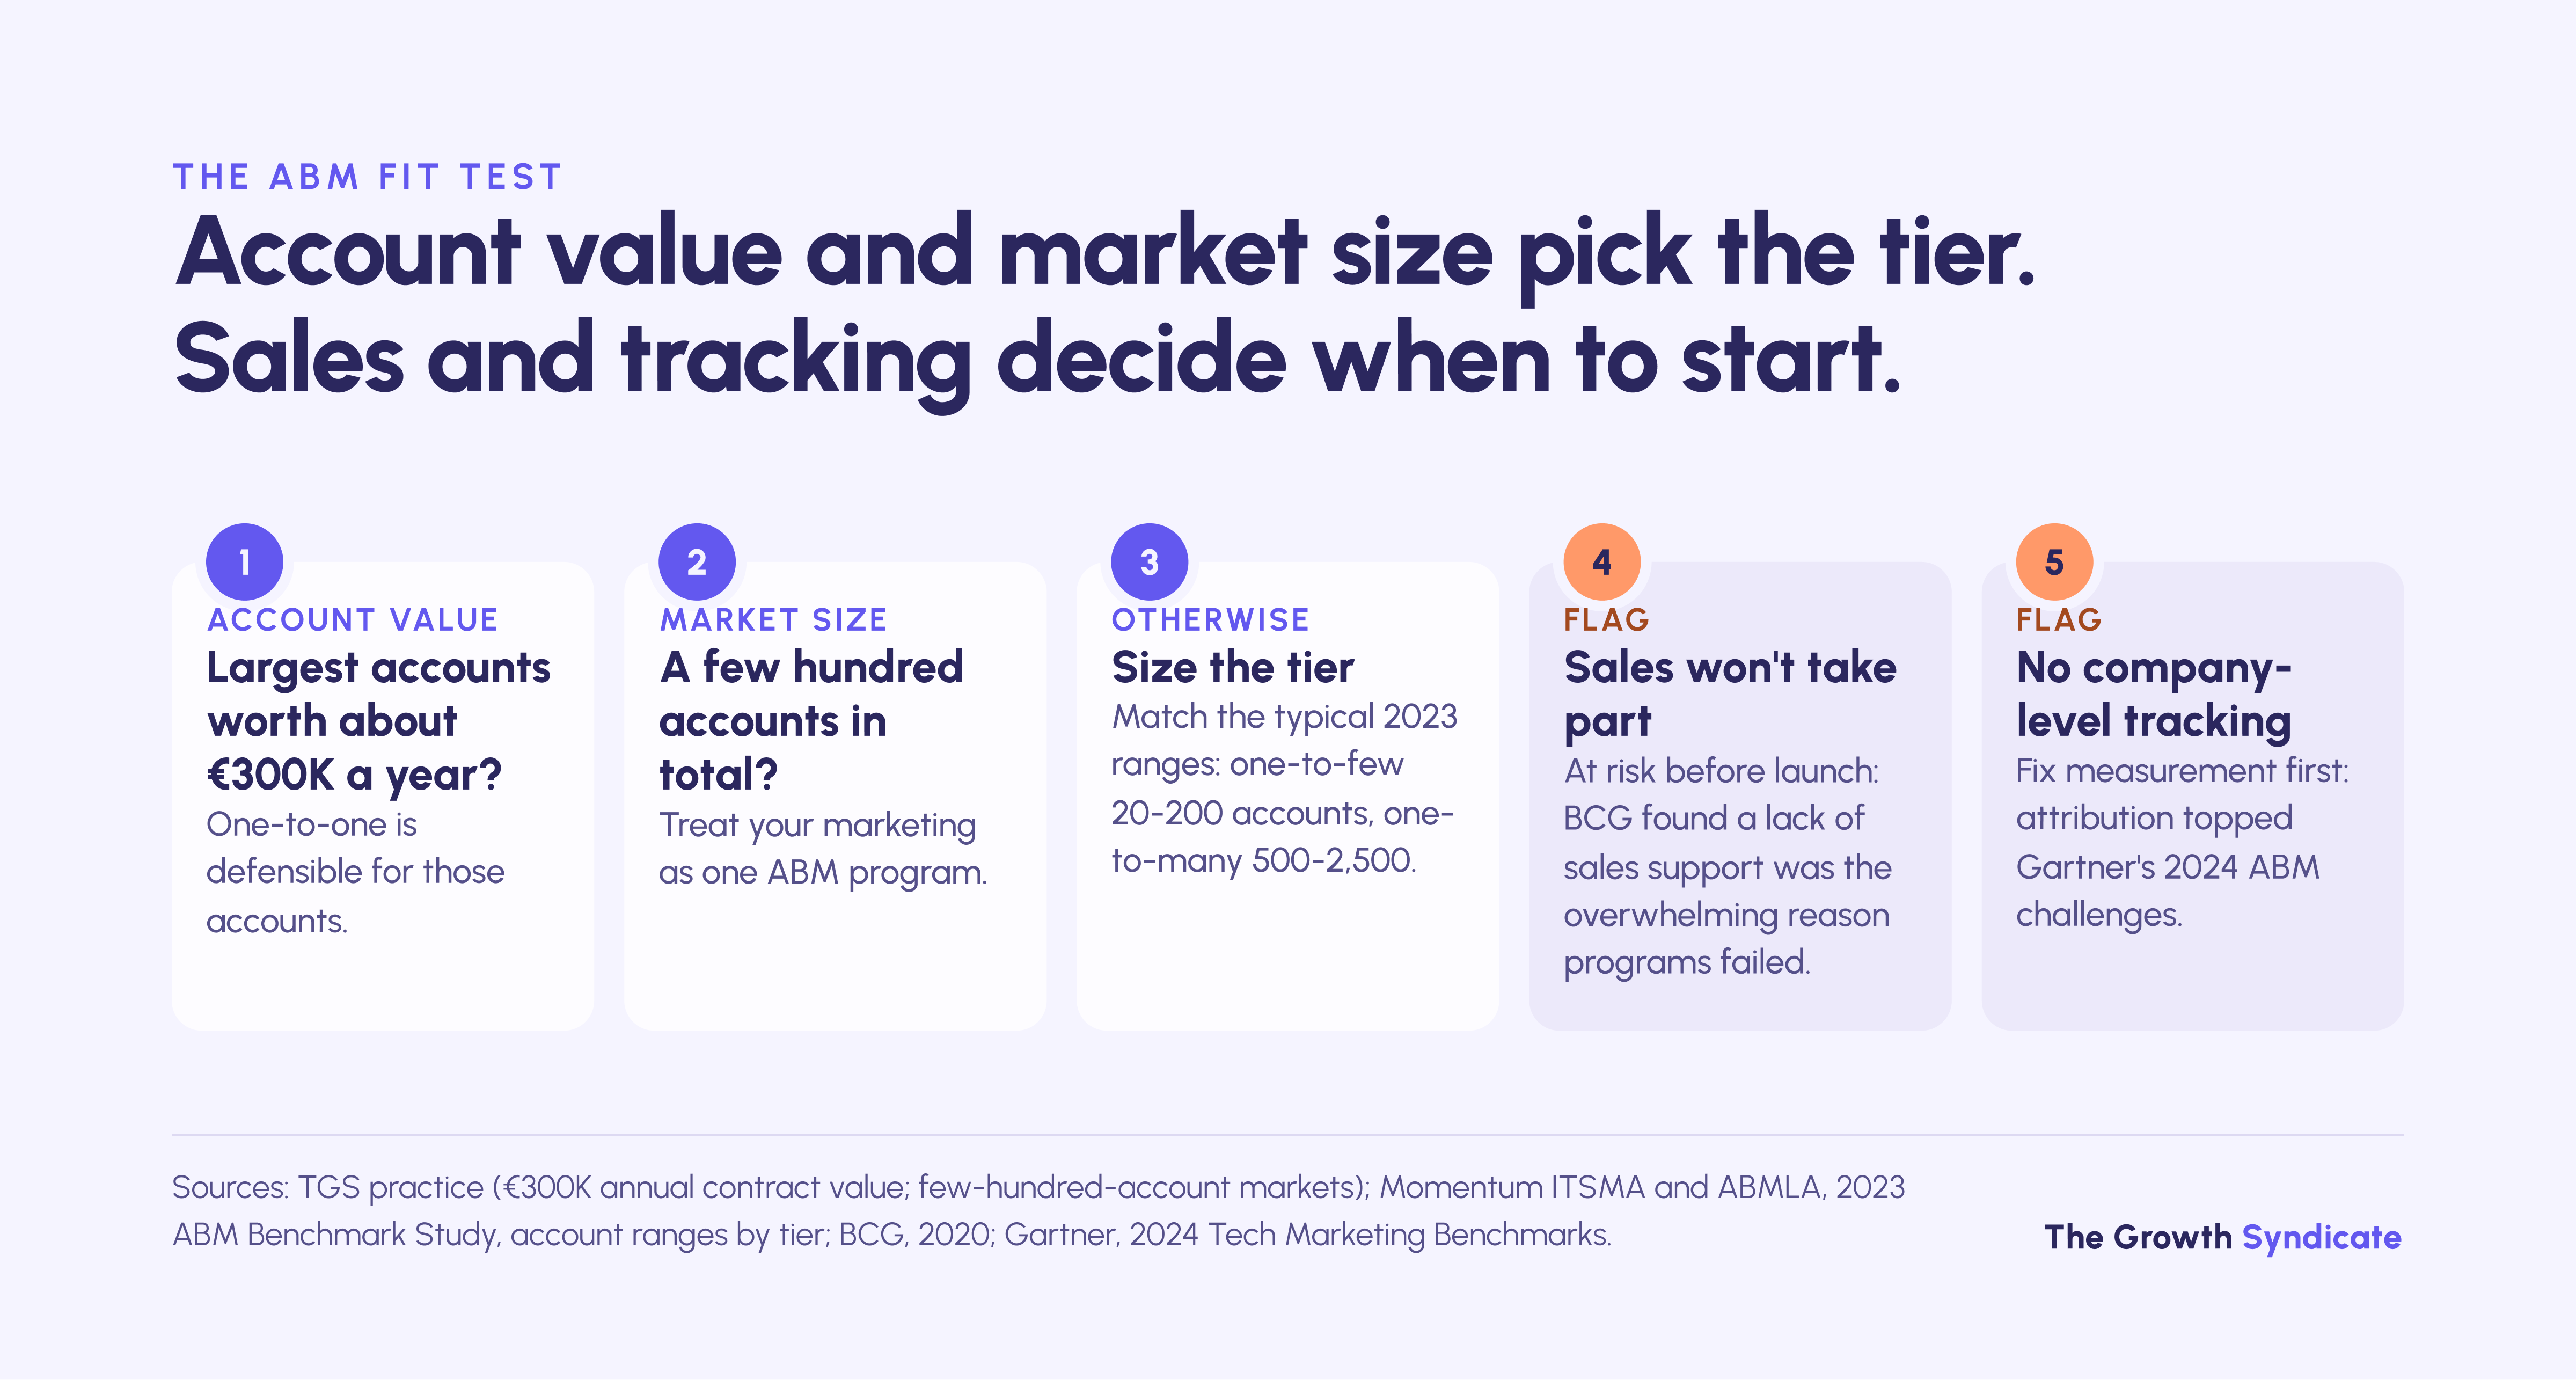
The ABM fit test turns the rules above into a check you can run on your own numbers. You enter the annual contract value of your largest accounts and the size of your market, then answer two yes-or-no questions on sales participation and company-level tracking. It returns the tier those numbers support, with the rule and source behind each answer.
The fit test applies five rules, in this order:
- If your largest accounts are worth about €300K a year or more in contract value, one-to-one ABM is defensible for those accounts.
- If your whole market is a few hundred accounts, the test treats your marketing as one ABM program rather than two motions.
- Otherwise it sizes a one-to-few or one-to-many program against the 2023 Momentum ITSMA account ranges.
- If sales will not take part, it flags the program as at risk before launch, because BCG's 2020 interviews found a lack of sales support and alignment was the overwhelming reason programs failed. Educating sales on ABM also comes first in Momentum ITSMA's 2023 list of people challenges.
- If you do not track engagement at the company level, it flags measurement as the first thing to fix, since attribution topped Gartner's 2024 list of ABM challenges.
The test stores nothing and asks for no email address. Each threshold comes from a named source or from TGS practice, and each answer shows which.
Where these ABM numbers break down
The figures on this page have four limits worth stating plainly. Nearly all are self-reported, and the measured ones come from a vendor's own customers or from buying-group data that does not isolate ABM. TGS's results cover four programs, and the €300K threshold is co-founder Clément Dumont's working rule rather than a finding from a dataset.
- Self-report dominates. Twenty-five of the 28 groups of figures we graded are self-reported answers from surveys or interviews, and most of the ABM surveys here draw on people who already run ABM.
- The measured data is indirect. Ebsta and Pavilion measure buying groups across all deals, and Demandbase measures correlations among its customers, so neither isolates what ABM added.
- Four programs are not a sample. TGS's results show what the motion produced for four clients in different markets and periods, and they should be read as examples.
- The tier threshold is judgment. The €300K line comes from running programs, and we found no public dataset that compares results by tier.
The honest alternative to all of these is a test of your own: run ABM against a matched set of accounts that get no ABM treatment, and compare win rates and deal sizes after a full sales cycle.
How we verified these figures
Every third-party figure on this page was checked in October or November 2026 at its primary source, or at a named secondary report where the primary is paywalled or offline. Each group of figures in our source ledger carries two labels: measured or self-reported, and a grade from A to C, with H reserved for historical figures.
A figure graded B usually has an undisclosed sample, a sponsor with an interest in the answer, or an age above 24 months. A zombie is a figure whose earliest traceable source cites no study we could find, or a study that says something different. Figures we could not trace to a named source stayed out, and so did vendors' unpublished platform claims.
We re-check this page every quarter and log substantive changes below. October 2026: first published.
What to do next
Decide on ABM from your own deal size and the size of your market, and treat the surveys as context rather than proof. A business case built on 81% or 171% will not survive a CFO who asks what was actually measured, while one built on your own won and lost deals will.
- If your largest accounts are worth about €300K a year or more, build a one-to-one program for them and expect about half of its focus to go to existing customers.
- If your market holds a few hundred accounts, treat your marketing as a single account-based program rather than running a separate demand generation track.
- If you sell smaller deals into thousands of accounts, start one-to-many and promote accounts to one-to-few clusters when engagement justifies the extra work. Where churn is low, judge the return on customer lifetime value rather than first-year contract value.
- If you are building the account list, build it with sales: ask which recent leads looked most promising and what signal told them so, then run your ads against the same accounts sales is calling.
- If your first campaign underperforms, change the message before the audience, and expect to need more than one version before you judge the program. In Ysabel's tests, problem-led messaging usually wins.
- If you need ROI for a business case, measure it from your own deals against a holdout group, and quote survey figures only with their samples.
- If sales has not agreed on the account list, fix that first, because BCG found a lack of sales support and alignment was the overwhelming reason programs failed.
Ysabel's own sequence keeps those steps on one list, from the first ad to the sales follow-up.
When your deal size supports it, we run ABM programs for complex B2B companies and report them on pipeline.
Frequently asked questions
How long does ABM take to show results?
We found no study that measures how long ABM takes to pay back. In B2B Marketing's survey of 300 marketers, published in 2020, the most common estimate of time to ROI was 12 months. 6sense's 2025 survey of nearly 4,000 buyers put the average buying cycle at 10.1 months, so judge a program over at least one full cycle.
Where does the 171% ABM statistic come from?
The earliest public source we found is a September 2017 MarTech Series roundup, which credits a TOPO study commissioned by the ABM Leadership Alliance and links only to the two organizations' homepages. The alliance's own blog describes a comparison of pre- and post-ABM periods, but we found no public copy of the study, so nobody can check it today.
What is the 40-40-20 rule, and does it apply to ABM?
The 40-40-20 rule, usually credited to direct marketer Ed Mayer in the 1960s, says 40% of a campaign's result depends on the list, 40% on the offer and 20% on the creative. It fits ABM closely, because an ABM program is built on a named account list, and personalization cannot rescue a weak list.
How do you measure ABM?
Measure ABM at the account level, not the lead level. Track the share of target accounts engaged, opportunities and pipeline from target accounts, win rate and deal size against non-target accounts, and sales cycle length. A matched holdout group of accounts that receive no ABM treatment turns those figures into evidence rather than correlation.
Is ABM only for enterprise companies?
ABM is not only for enterprise companies, though one-to-one is more common at larger ones. In Momentum ITSMA's 2023 benchmark, 45% of ABM users under $100M revenue ran one-to-one, against 66% at $1B or more. Smaller firms rated selling to new accounts higher (4.6 against 3.3 of 5), and larger ones rated growing existing accounts higher (4.5 against 3.6).
What is the difference between ABM and demand generation?
Demand generation builds awareness and preference across a whole market, while ABM concentrates effort on a named list of accounts chosen with sales. In markets of only a few hundred potential customers the two converge, because the market and the account list are the same set of companies.
What is a good ABM win rate?
We found no independent ABM win-rate benchmark measured across companies. The closest references are Ebsta and Pavilion's 2025 data, with new-business win rates of 18-19% and expansion win rates of 45%, and Demandbase's 2026 customer data, where companies using four advertising products won 58.7% of deals. Compare your target accounts against your own non-target deals.