.svg)


What does revenue marketing mean?
Revenue marketing is the practice of measuring marketing efforts by their contribution to pipeline and closed revenue rather than by lead volume, website traffic, or engagement. The marketing team takes a share of the company's revenue goals, agrees funnel definitions with sales, and reports sourced and influenced pipeline in the same forum where sales reports its own number. Debbie Qaqish of The Pedowitz Group coined the term in 2010.
Most writing on revenue marketing describes a ladder. A company starts with traditional marketing, climbs to lead generation, then demand generation, and arrives at revenue marketing as a kind of graduation. The diagrams are tidy, the stages have names, and the benefits of revenue marketing are listed as if they arrive on schedule.
This article takes a different position. Companies do not move to revenue marketing because they matured into it. They move because someone in a pipeline review stopped believing the lead number, usually after a specific argument with sales about what those leads were worth. The operating model follows from that loss of trust, and it costs more to build than the ladder diagrams suggest.
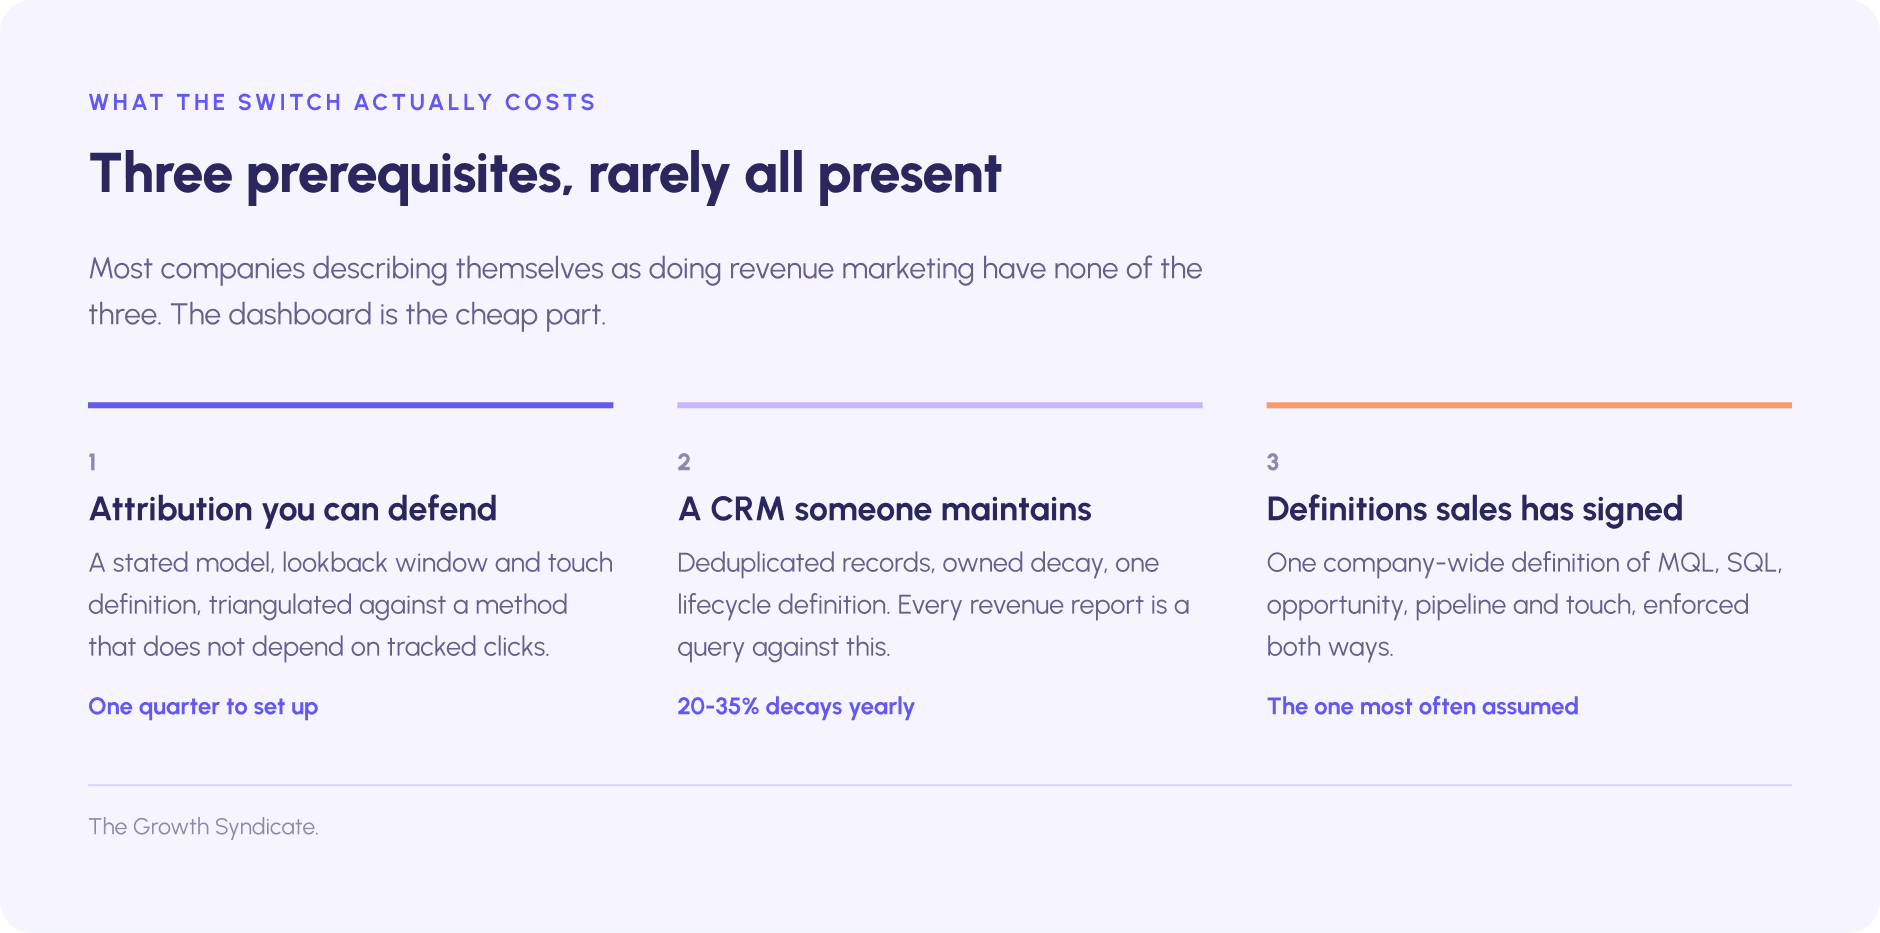
The costs are concrete. A working revenue marketing model needs attribution you can defend in front of a CFO, a CRM that someone maintains, and a sales team that agrees on definitions. Most companies that describe themselves as doing revenue marketing have none of the three.
This piece covers where the term came from, why sales and marketing teams adopt it, what separates it from demand generation and RevOps, what the prerequisites cost, how to build a revenue marketing strategy, how it fails, and what it looks like when it works.
Where the term revenue marketing came from
The term has a verifiable origin, which is rare for marketing vocabulary. Dr. Debbie Qaqish and The Pedowitz Group coined "revenue marketing" in 2010, introduced a maturity model the following year, and published Rise of the Revenue Marketer in 2013. Qaqish later trademarked "Queen of Revenue Marketing."
Even the originators are inconsistent about the date. Pedowitz pages variously claim the term was coined in 2007, 2010, and 2011. The 2010 date is best supported by the book, and the drift is worth noting because it illustrates something about the category: the vocabulary moved faster than the discipline.
The four-stage maturity model, stated fairly
Pedowitz's model describes four stages, and it deserves an accurate summary before any critique.
- Traditional marketing. Marketing owns brand, awareness, and creative. Success is measured on activity and reach: impressions, website traffic, events run, assets produced. These are the traditional marketing metrics, and nobody is accountable for pipeline.
- Lead generation. Marketing generates marketing qualified leads and hands them to sales. Visibility mostly ends at the handoff.
- Demand generation. Marketing owns conversion from MQL to sales qualified lead and shares pipeline targets with the sales team.
- Revenue marketing. Marketing is accountable for a defined share of pipeline and revenue generated, carries joint compensation with sales, and runs closed-loop reporting across the entire customer journey. In the original Business Chief write-up of the model, stage four is described as the same as demand generation with one exception: the ability to produce repeatable, predictable, sustainable revenue.
Pedowitz's own assessment is that most B2B companies sit at stage two or early stage three.

What the model gets right
The model is right that capability has a sequence. You cannot run closed-loop reporting before you have a lead lifecycle, and you cannot negotiate a revenue target with sales before you have conversion data. It is also right that compensation is the tell. A marketing team with no variable pay tied to revenue outcomes is not in stage four, whatever the dashboard says, and the same is true of a team whose marketing investments are still justified on impressions.
What the model leaves out
The model implies an upward drift, as if companies climb because that is what companies do. It says nothing about the trigger, and the trigger matters, because it determines what the company builds first.
The model also assumes a fixed endpoint. In 2023, the analyst firm that codified the lead-based funnel walked away from it, which means the ladder's top rung has moved. That story comes next.
Why companies actually switch to revenue marketing
Ask a marketing leader who moved to revenue-based reporting when the decision was made and you rarely hear about a maturity assessment or a new marketing strategy document. You hear about a meeting.
The argument with sales
The meeting runs along familiar lines. Marketing presents a quarter at 140% of MQL target and a tidy chart of marketing campaigns that beat plan. Sales presents a quarter at 80% of bookings.
The VP of Sales says the leads were unworkable. The VP of Marketing says the sales team never called them.
The CEO looks at two dashboards that describe two different companies and stops trusting both.
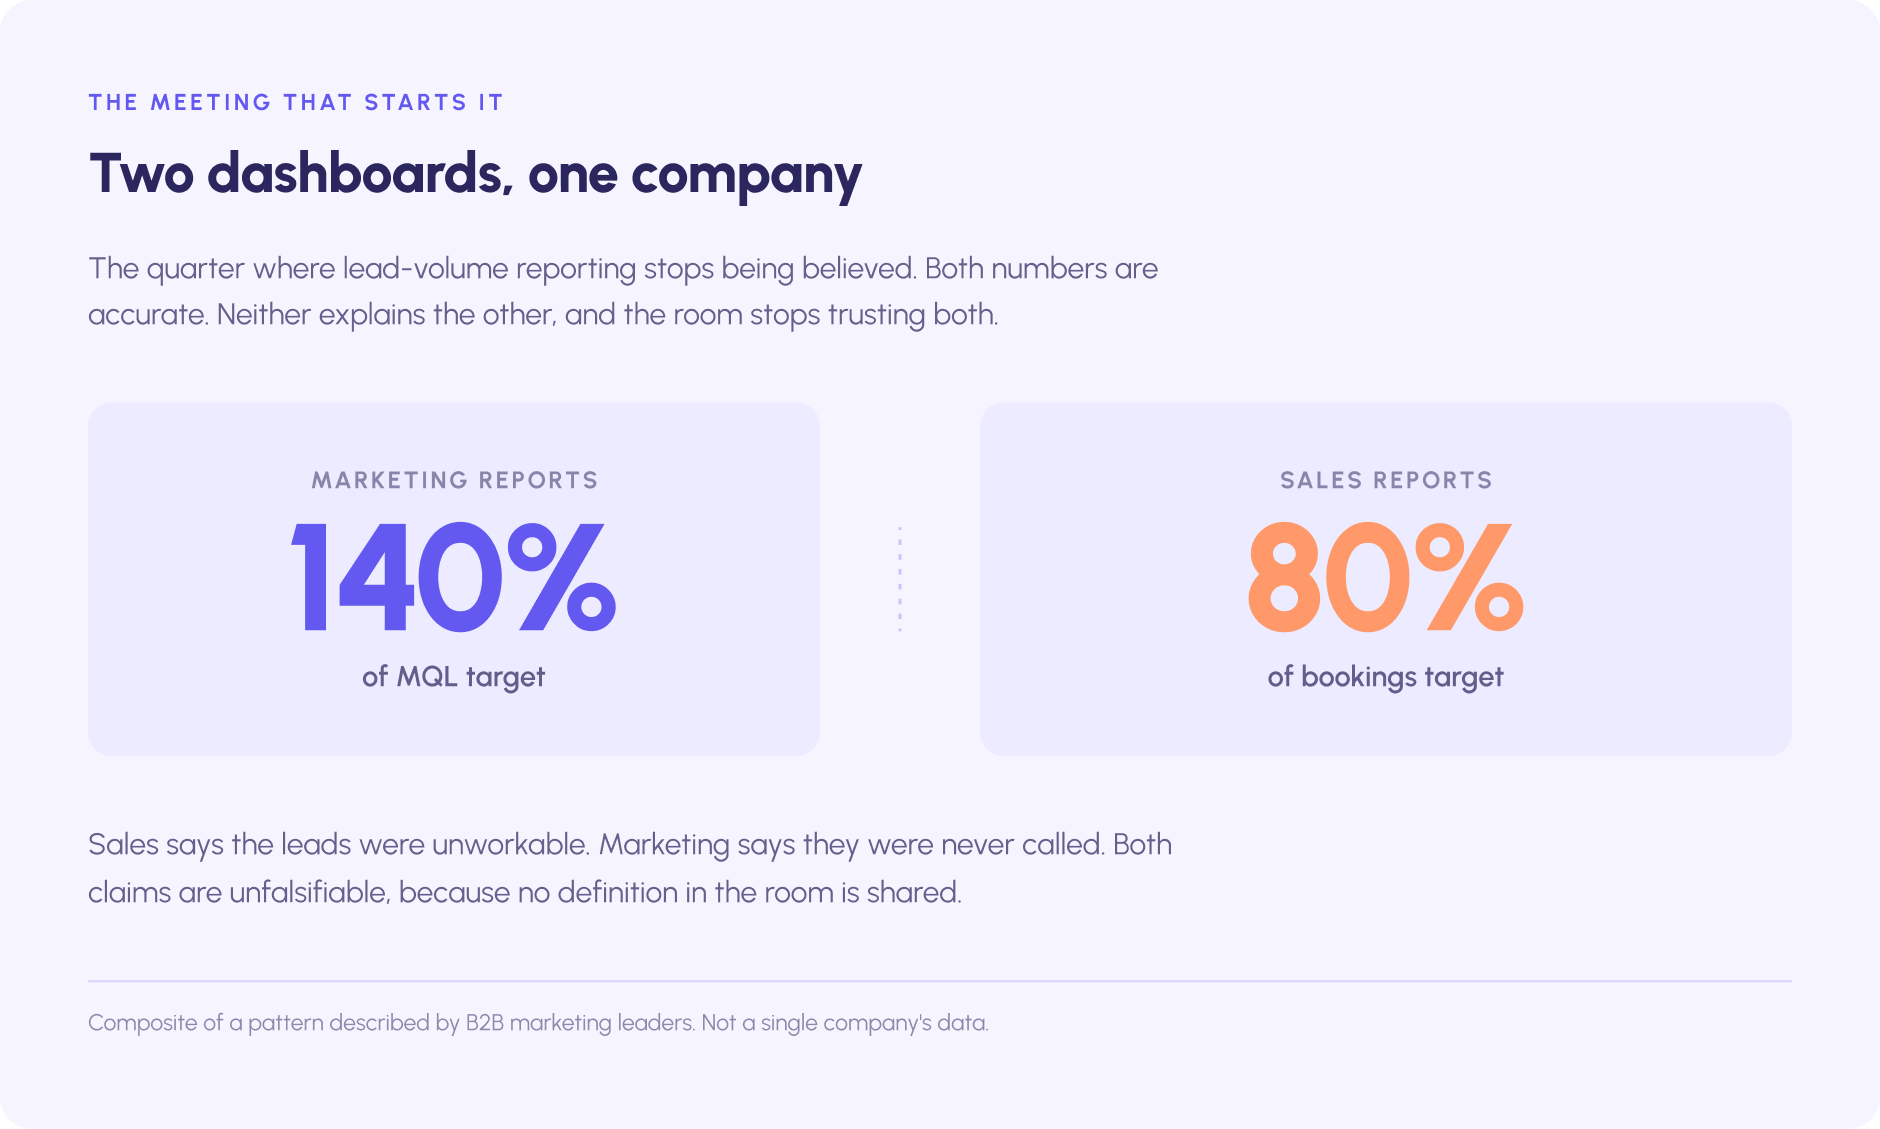
That moment is the real origin of revenue marketing inside most organizations. Lead volume as a reported number failed the only test a number has to pass: whether the people receiving it believe it. Everything that follows, from shared definitions to joint compensation, is an attempt to produce a number the room can accept, one tied to the company's revenue goals rather than to marketing activities. Vanity metrics do not survive that meeting.

MQL benchmarks that disagree with each other
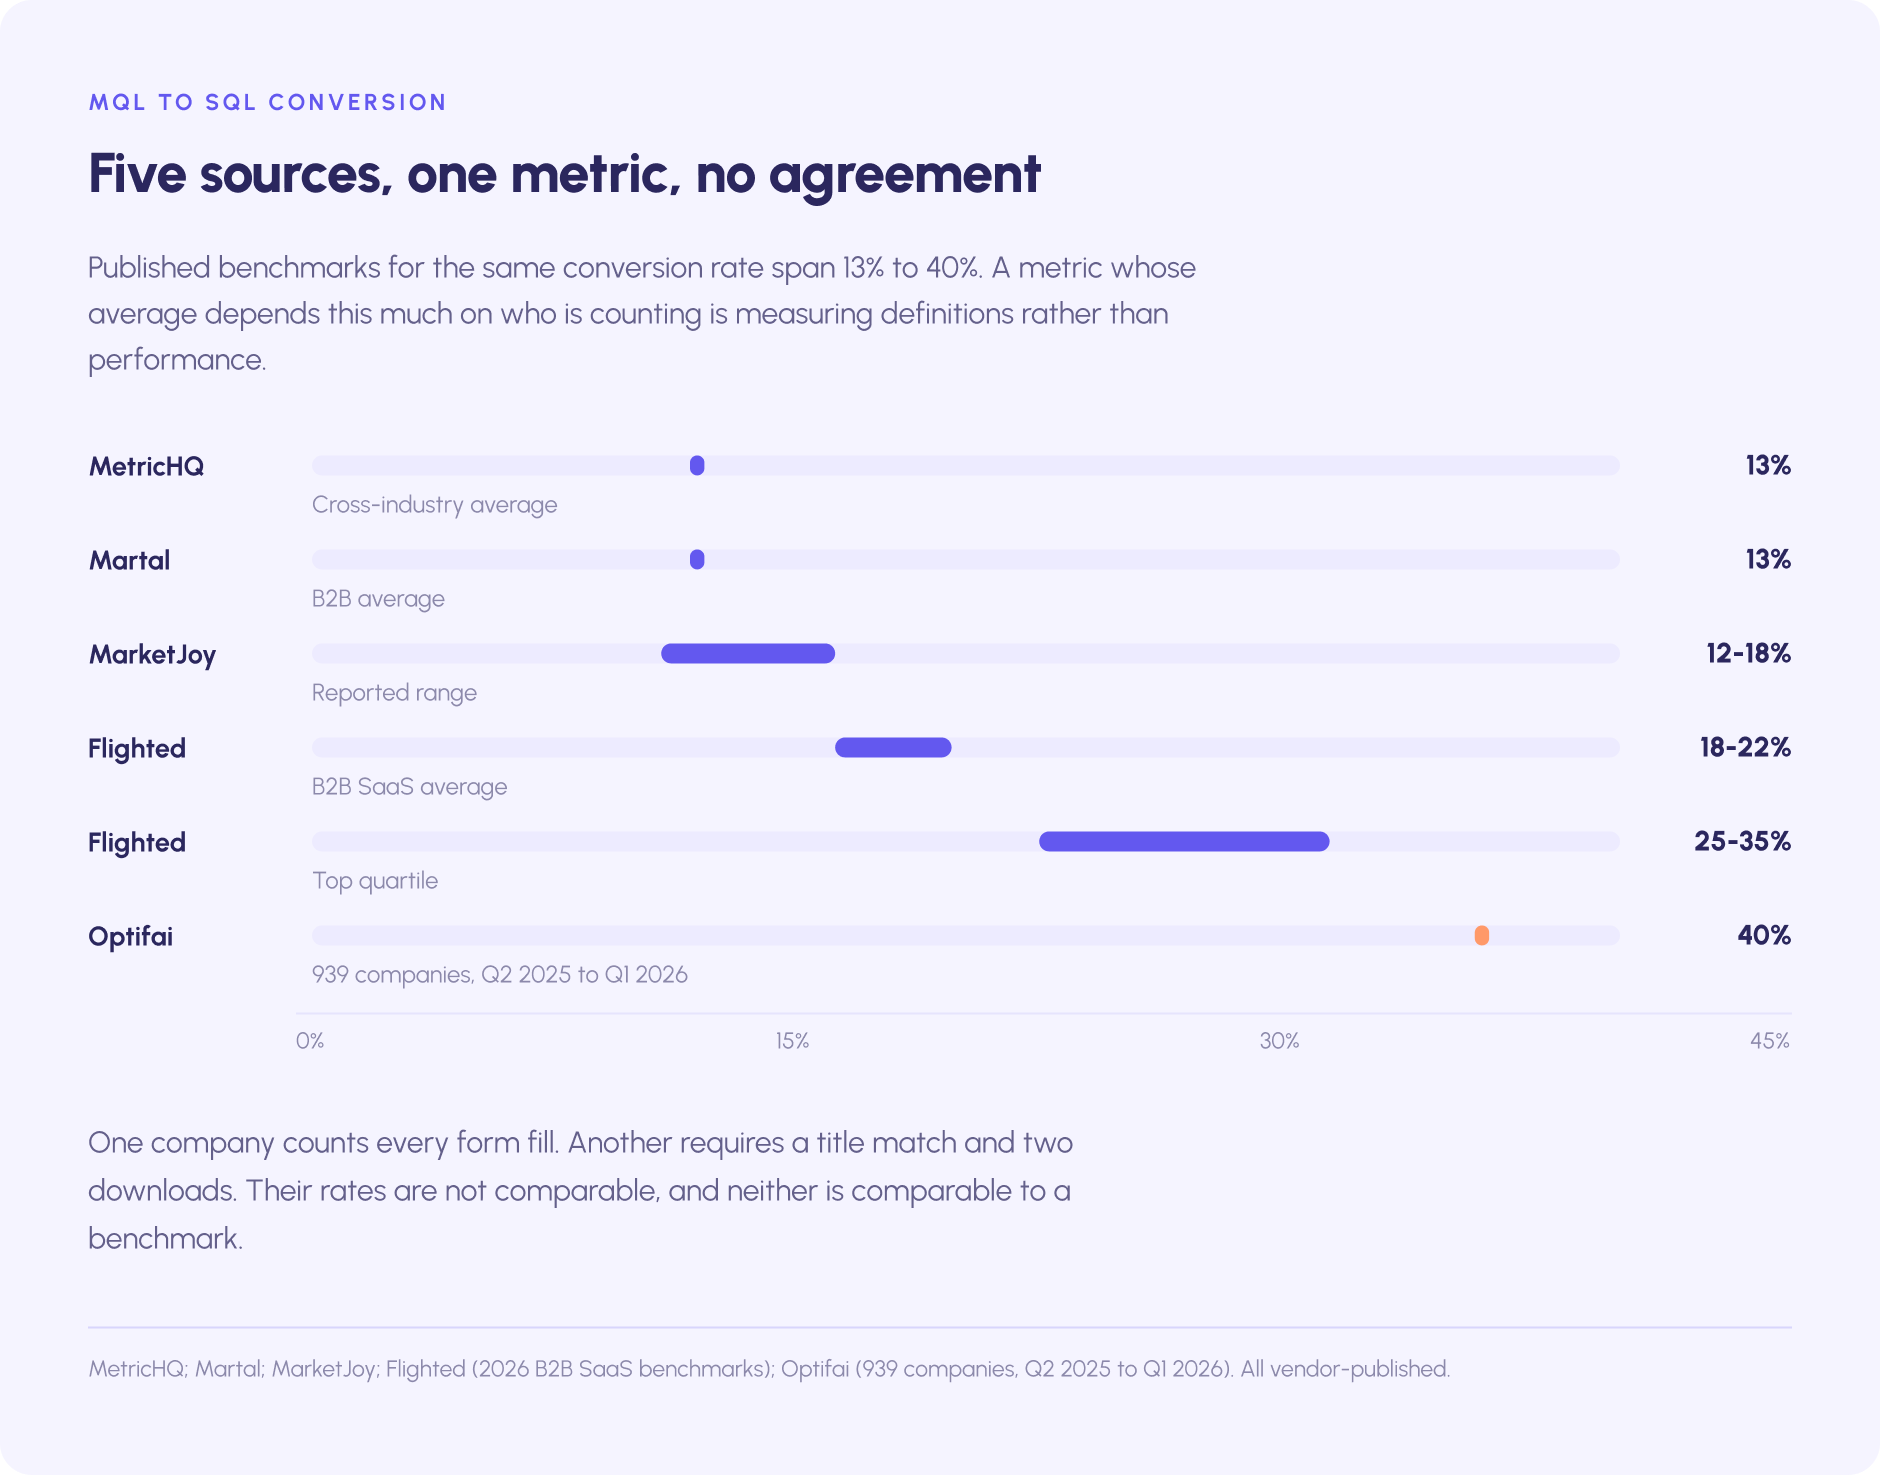
If MQL reporting were sound, industry benchmarks for MQL-to-SQL conversion would cluster. They do not.
MetricHQ puts the cross-industry average at about 13%. Flighted's 2026 B2B SaaS benchmarks cite 18-22% as average and 25-35% as top quartile. Optifai, drawing on 939 companies between Q2 2025 and Q1 2026, reports 40%.
A metric whose "average" ranges from 13% to 40% depending on who is counting is measuring definitions, not performance. One company counts every form fill as an MQL, which makes its marketing efforts look productive. Another requires a job title match and two content downloads. Their conversion rates are not comparable, and neither is comparable to a benchmark.
Nearly half the leads went unanswered
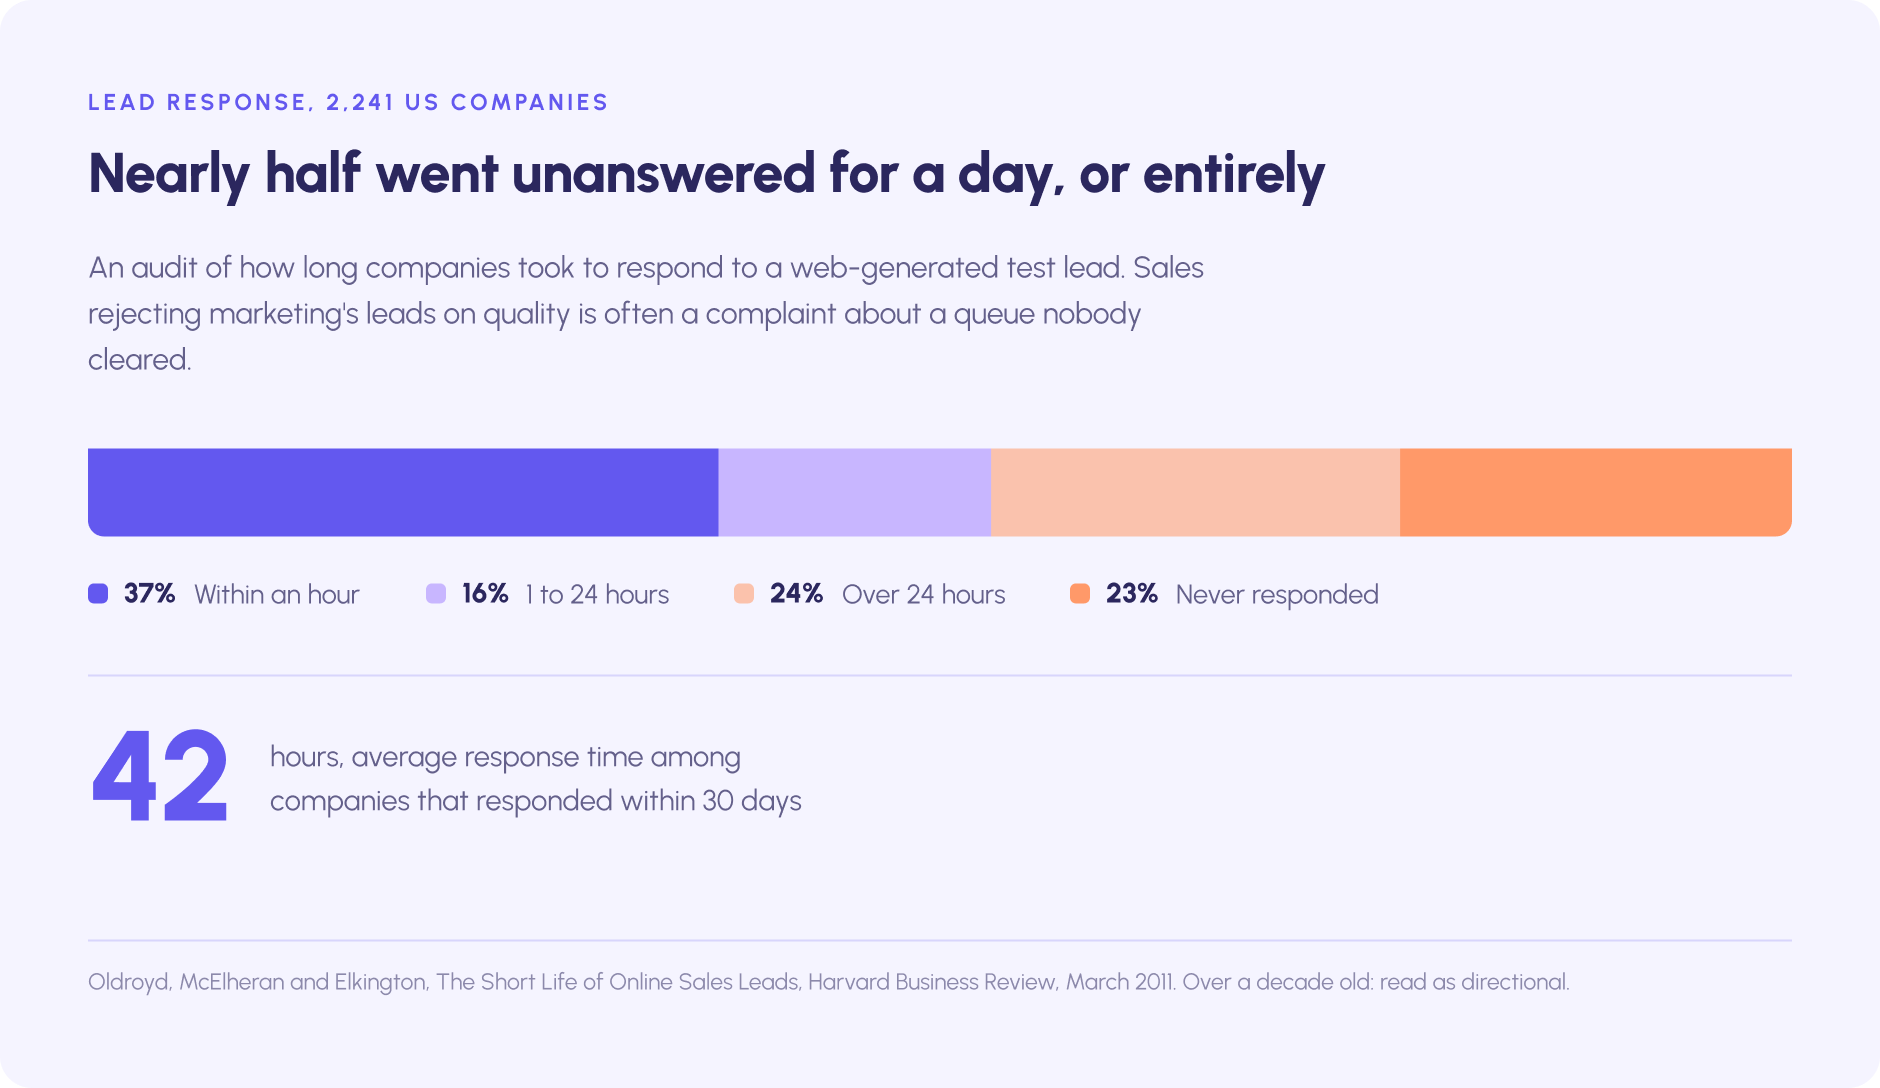
The oldest evidence here is still the most damning. A 2011 Harvard Business Review article by James Oldroyd, Kristina McElheran, and David Elkington reported an audit of 2,241 US companies, measuring how long each took to respond to a web-generated test lead.
Only 37% responded within an hour. Sixteen percent responded within one to 24 hours, 24% took more than 24 hours, and 23% never responded at all. Among the companies that did respond within 30 days, the average response time was 42 hours.
A separate study by the same authors, covering 1.25 million leads at 29 B2C and 13 B2B companies, found that firms attempting contact within an hour were nearly seven times as likely to qualify the lead as those that tried an hour later. Both datasets are now well over a decade old, so treat the multipliers as directional rather than current.
Add contact-data decay, which sits around 20-35% per year by most estimates (more on that below), and a large share of the leads marketing reported were unreachable or unworked before sales ever formed an opinion about them. The sales team's complaint about quality was often a complaint about a queue nobody cleared, and marketing and sales spent years arguing about generating leads when the problem was answering them.
When the model's own authors walked away
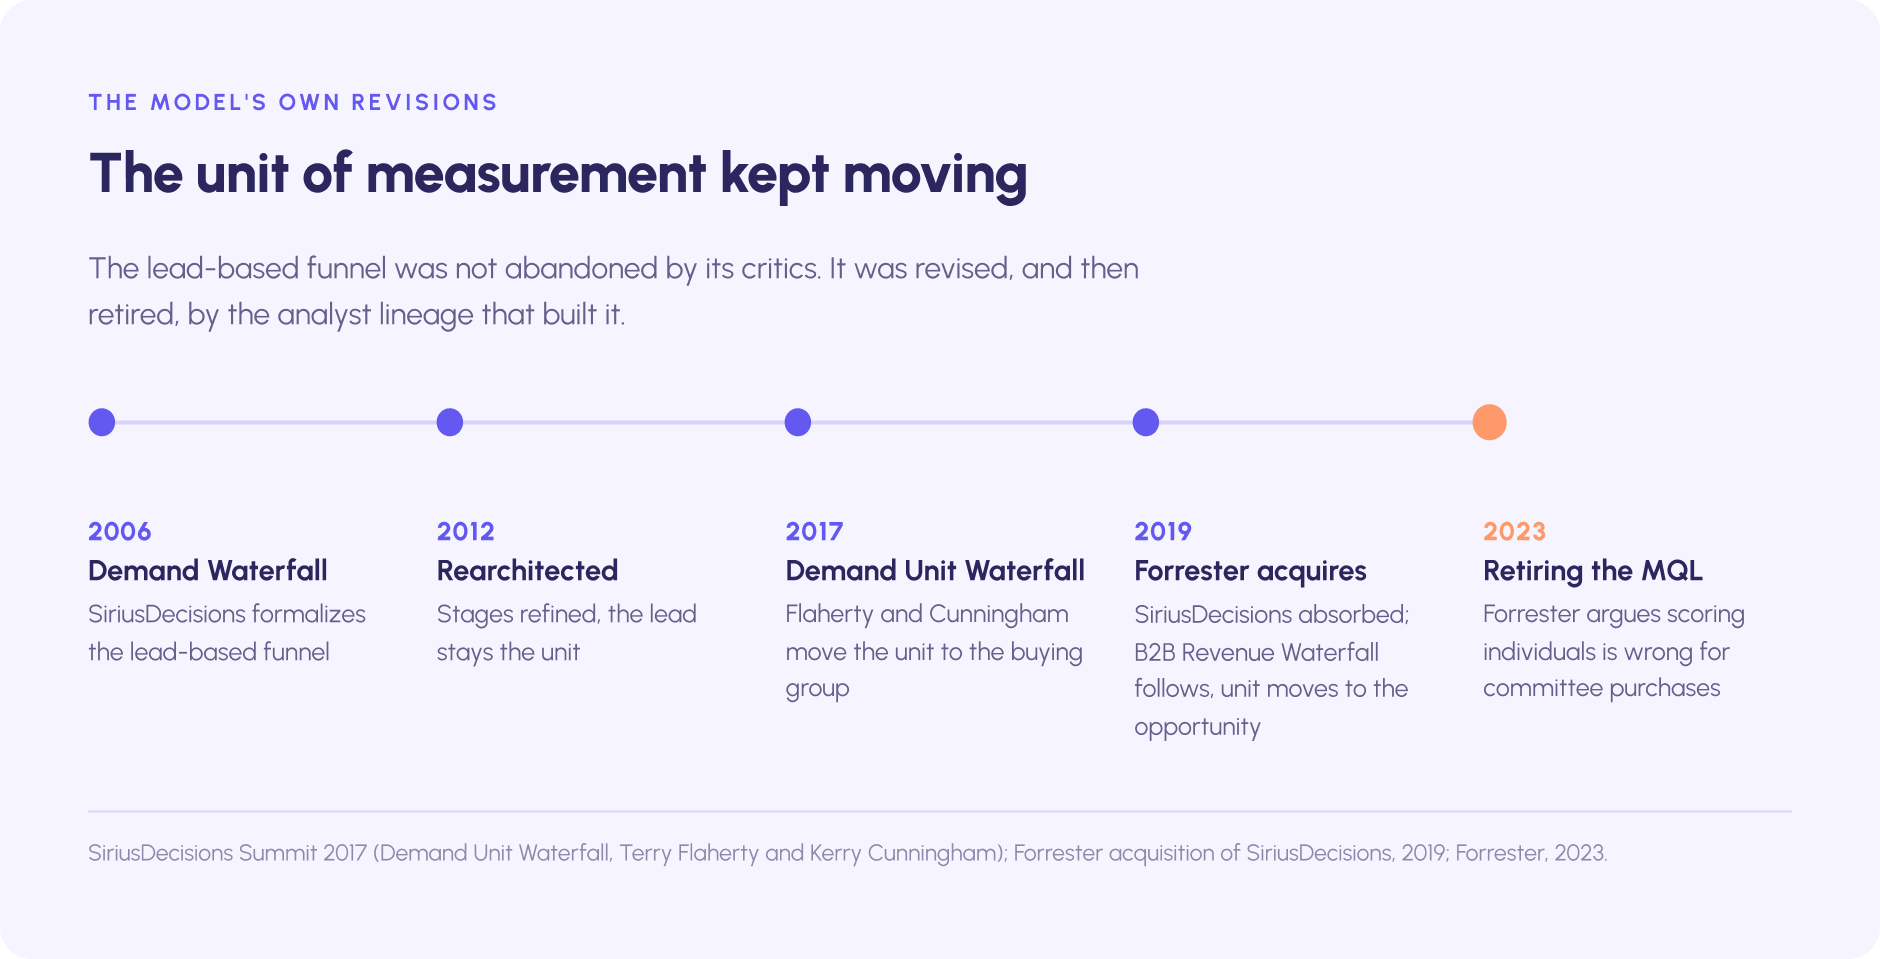
The MQL-centric funnel was formalized by SiriusDecisions, whose Demand Waterfall debuted in 2006 and was rearchitected in 2012. At the 2017 SiriusDecisions Summit, analysts Terry Flaherty and Kerry Cunningham unveiled the Demand Unit Waterfall, shifting the unit of measurement from the individual lead to the buying group. SiriusDecisions was acquired by Forrester in 2019, and the model's successor, the B2B Revenue Waterfall, moved the unit again, to the opportunity. In 2023, Forrester published a series on retiring the MQL, arguing that scoring individuals is structurally wrong for purchases made by committees.
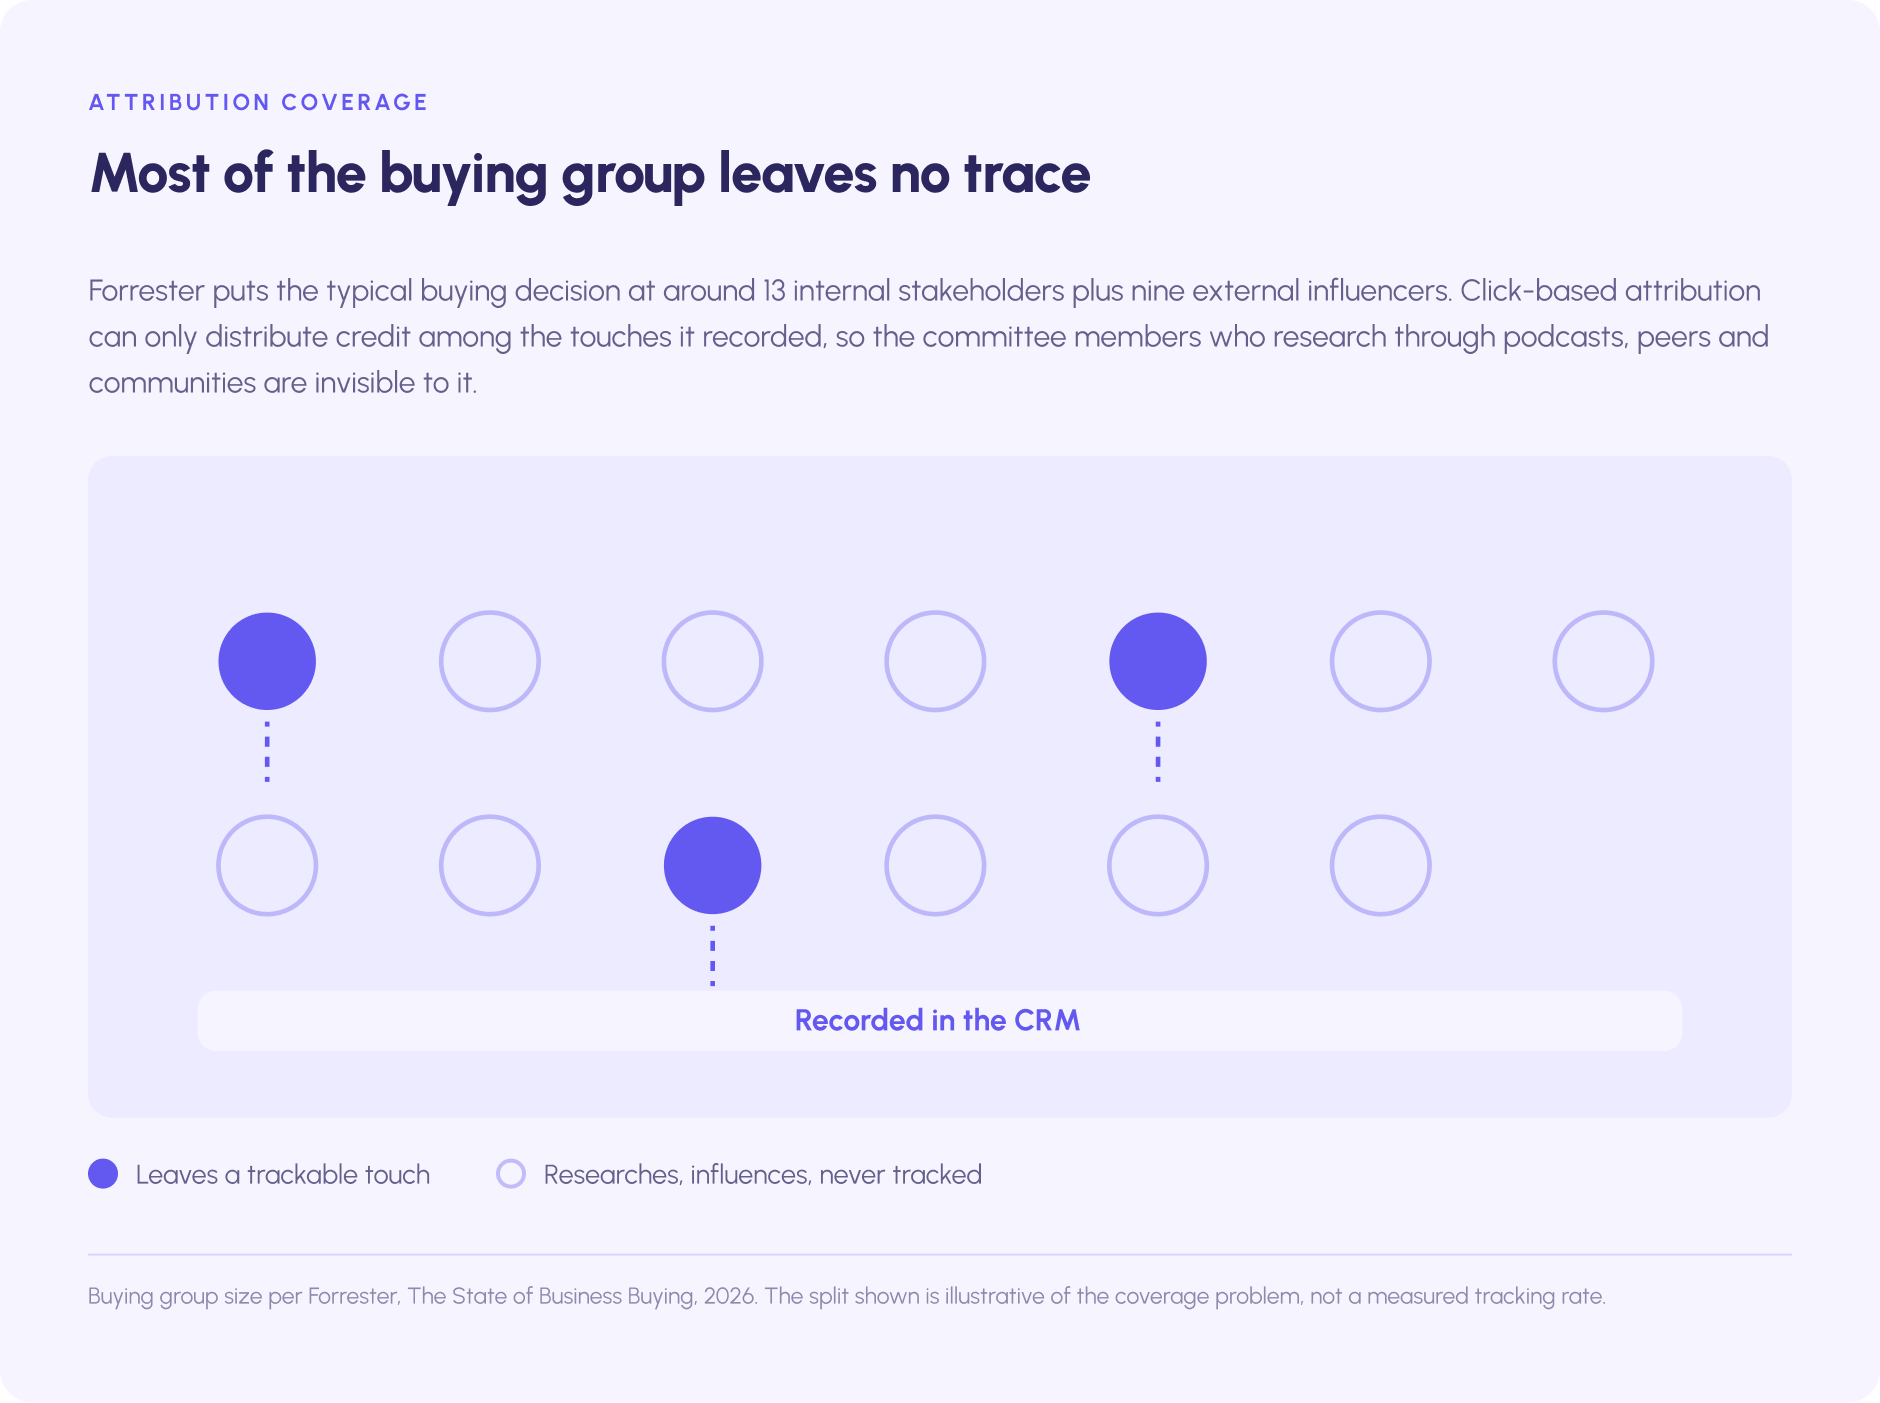
The committee data supports them. Gartner's B2B buying research reports that 77% of buyers describe their most recent purchase as very complex or difficult, and that a typical buying group runs to six to ten decision-makers, each arriving with four or five pieces of independently researched information. Forrester's State of Business Buying, 2026 puts the group larger still, at around 13 internal stakeholders plus nine external influencers. The two firms count differently, and both agree that an individual lead score cannot represent a group that size.
It is also the argument for account-based marketing, which reports at the level where buying actually happens.
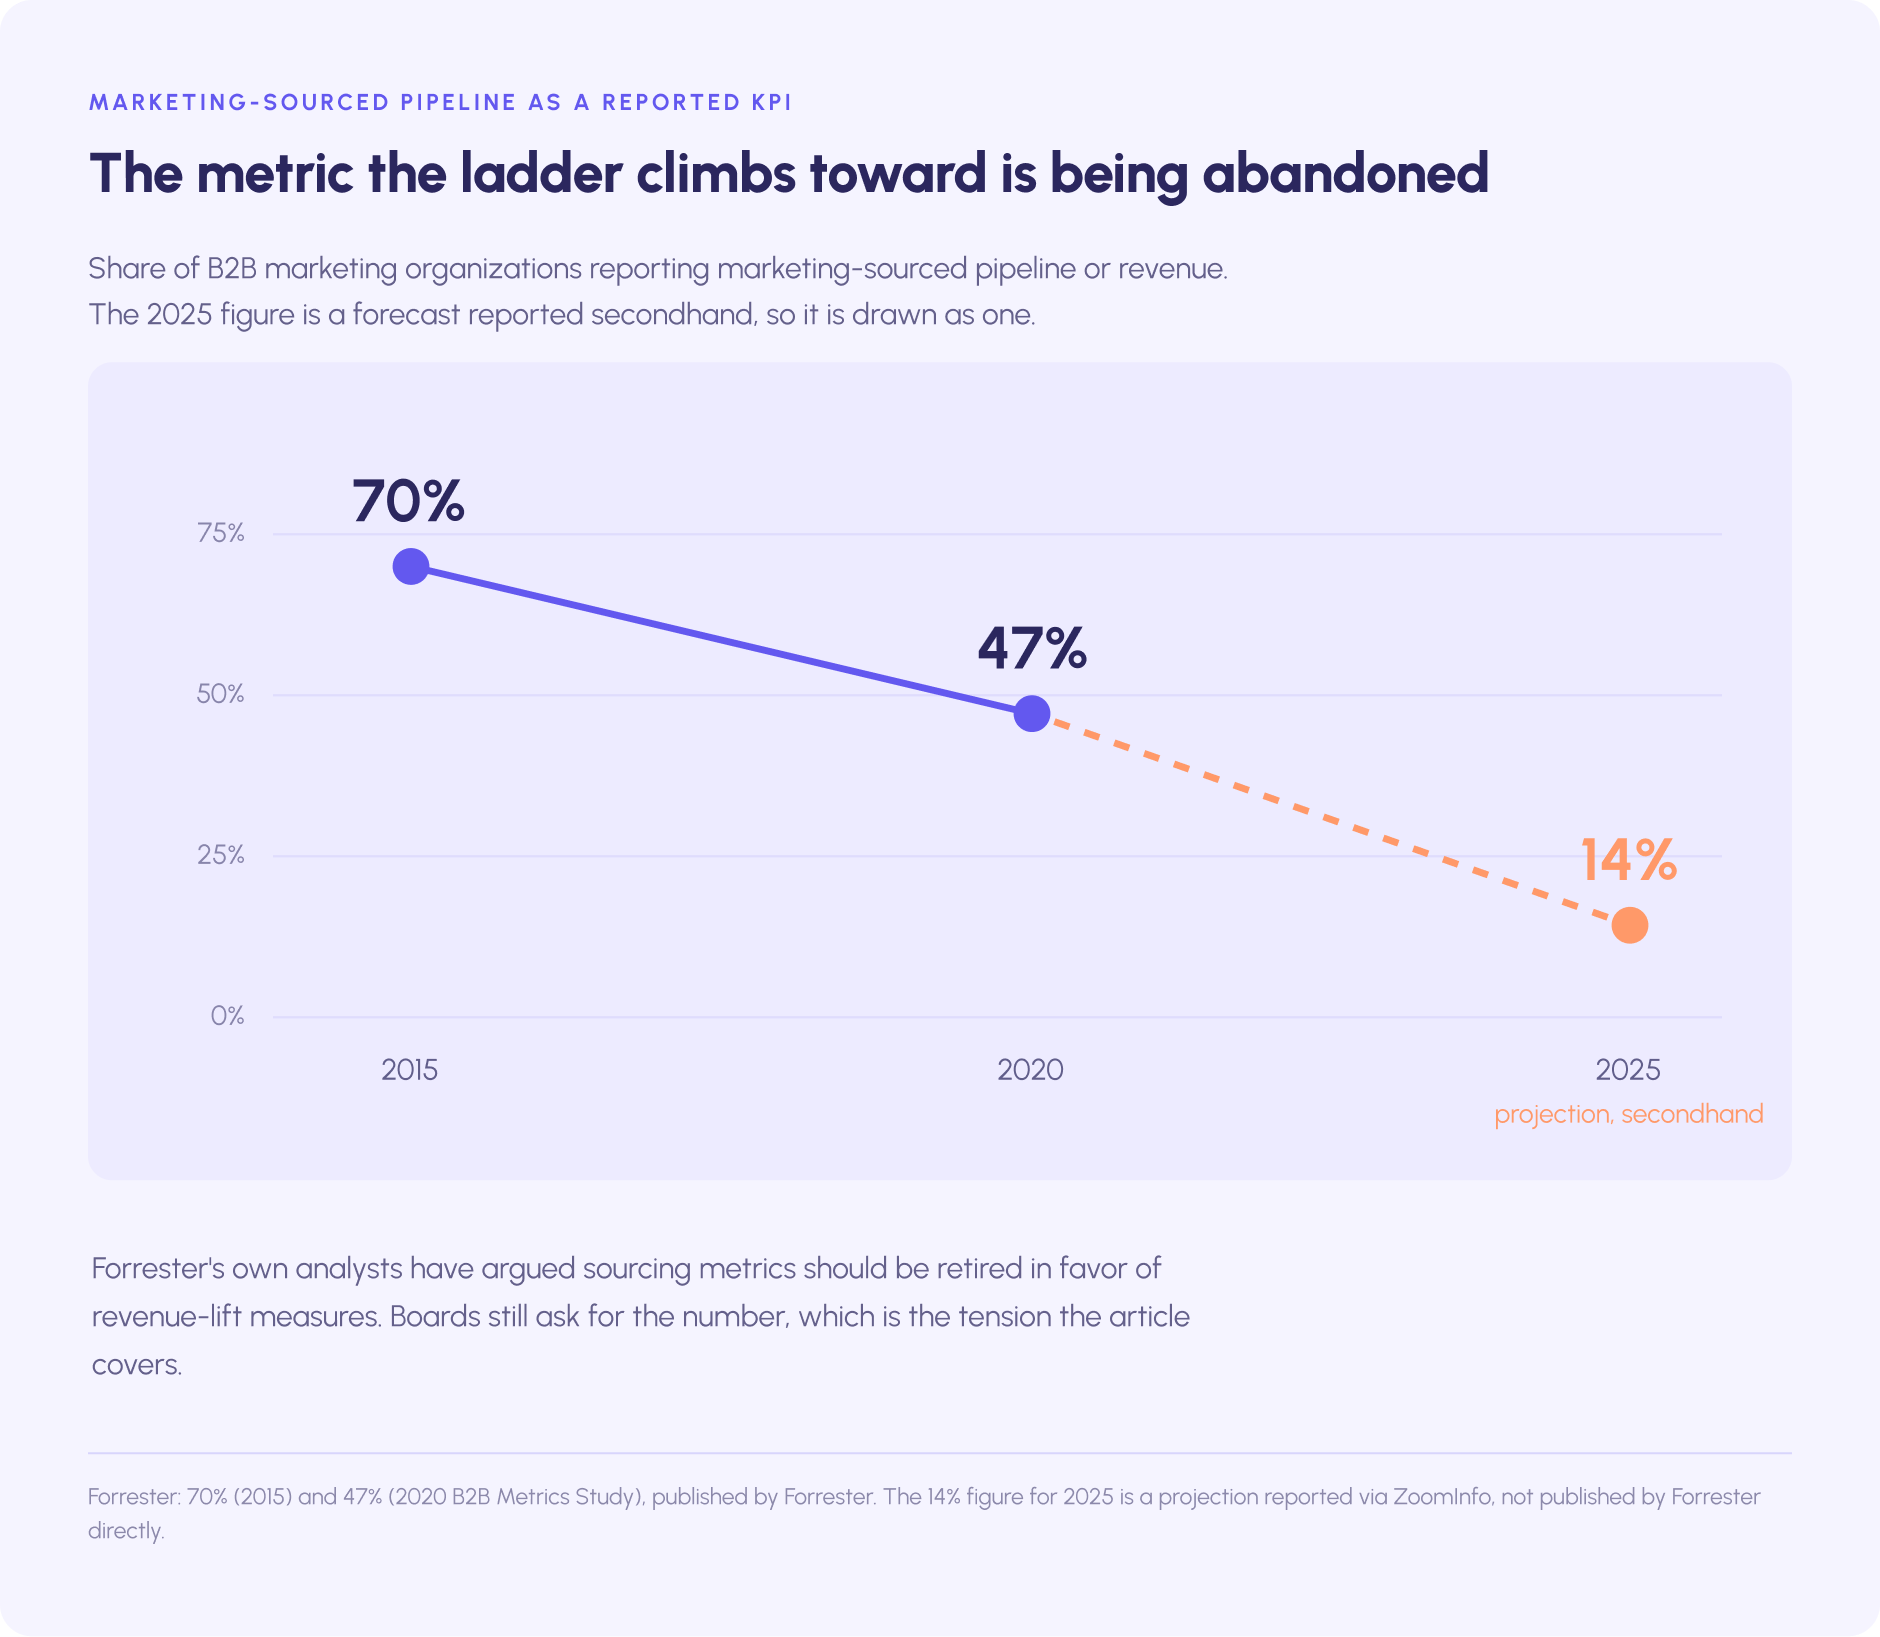
The reporting trend confirms the loss of faith. In 2015, Forrester found marketing-sourced pipeline in use at around 70% of B2B marketing organizations. By its 2020 B2B Metrics Study, sourced pipeline or sourced revenue appeared on only 47% of marketing leadership dashboards. Forrester's own analysts have since argued that sourcing metrics should be retired in favor of revenue-lift measures.
A further projection, that only 14% of marketing teams would track sourced pipeline by 2025, is reported via ZoomInfo rather than published by Forrester directly. The metric that the maturity model treats as arrival has been quietly abandoned by a growing share of the sophisticated organizations that reached it, in favor of revenue generated and opportunities created.
The case for keeping MQLs, and where it holds
None of this means the MQL is useless. As an internal lifecycle stage, it still tells the marketing team which contacts warrant a sales development touch, and routing has to happen somehow. The distinction worth holding is between the MQL as a routing signal, where it still works, and the MQL as the number reported to the board, where it stopped being believed.
Revenue marketing does not require deleting the MQL from the CRM. It requires refusing to report it upward as evidence of contribution, in the same way that mature marketing teams stopped reporting website traffic as a business result a decade ago.
.avif)
Revenue marketing vs demand generation, lead generation, and RevOps
Revenue marketing overlaps with half a dozen adjacent terms, and the overlaps are where most confusion lives. Unlike traditional marketing, which is defined by what it produces, most of these terms are defined by what they are measured on. The table below states what each one owns and how it relates to revenue marketing.
Revenue marketing vs demand generation
Demand generation describes a set of programs: content, events, paid media, outbound, community. Revenue marketing describes what those programs are accountable for and how the team is paid. Pedowitz frames it directly: demand generation is a function, revenue marketing is an operating model, and demand gen lives inside it.
The distinction is real, and it is also thinner than the vendor content suggests. Dreamdata's definition concedes that the marketing activities themselves are not necessarily different from a demand gen program; the difference is that success is measured differently.
Revenue marketing vs lead generation
Lead generation is the reporting posture revenue marketing exists to replace. A lead generation team is measured on how many contacts it captured and what each one cost, so its marketing campaigns are built for generating leads. A revenue marketing team is measured on what those contacts became.
Both may run the same webinar. Only one of them ever finds out whether the webinar produced customers and, eventually, revenue growth.
Revenue marketing vs revenue operations
RevOps is the function that owns the shared data model, the CRM architecture, the handoff process, and the reporting layer across marketing, sales, and customer success. Revenue marketing is a way of holding marketing accountable for revenue generation. In practice, RevOps builds the attribution system and the definitions that revenue marketing runs on. A company can have RevOps without revenue marketing (the infrastructure exists but marketing is still reporting MQLs) and it cannot sustain revenue marketing without something doing RevOps' job across marketing and sales.
Revenue marketing vs marketing operations
Marketing operations owns the marketing automation platforms, lead scoring, UTM taxonomy, database health, and the marketing-sourced pipeline dashboard, and it is where most of the marketing team's reporting effort lives. RevOps owns the cross-functional data architecture that connects the marketing automation platform to the CRM and to customer success data. Both are prerequisites. Neither is the model.
Is revenue marketing just a rebrand?
The skeptical reading deserves a fair hearing, partly because its strongest statement comes from the term's originators. Pedowitz writes that the honest answer for most B2B marketing teams is that they are running demand gen and calling it revenue marketing. Adobe describes it as a business model shift rather than a tactical one.
The fair conclusion sits between the two. Revenue marketing is a new scoreboard rather than a new set of marketing activities, plus every organizational change required to make that scoreboard credible. The activities underneath, from performance marketing to events, do not change on the day the reporting does.
The scoreboard is the easy part. The credibility is the work, which is why effective revenue marketing is rarer than the term.
What the switch actually costs: three prerequisites most companies lack
Here is the part the maturity model skips. A revenue marketing approach requires three things before the first dashboard is built, and each is rarer than the category's popularity implies. Together, they are what the switch costs.
Attribution you can defend
Defensible attribution does not mean perfect attribution, and it does not mean a marketing ROI figure that looks precise. It means a stated model, a stated lookback window, a stated definition of a touch, and triangulation against at least one method that does not depend on tracked clicks. Most companies have a tool and no statement.
The reason click-based attribution fails on its own is structural. First-touch, last-touch, and multi-touch models can only distribute credit among the touchpoints they recorded, which means the marketing channels that leave the most tracks get the most credit, regardless of what actually moved the buyer. A B2B buying committee of six to thirteen people researches across podcasts, peer conversations, communities, and review sites that leave no trace in a CRM.
Chris Walker, who founded Refine Labs and popularized the term "dark funnel," has argued that multi-touch attribution tracks something like 3% of the real journey. The number is polemical. The direction is right.
Two complements make attribution defensible:
- Self-reported attribution. A required free-text "How did you hear about us?" field on high-intent forms. In HockeyStack's analysis of roughly 8,500 responses across its customer base, first-touch and last-touch models both credited more than 80% of results to organic, direct, and paid search, while the self-reported answers surfaced sources those models barely registered: previous customers accounted for 1.5% of MQLs but 7.06% of revenue. HockeyStack is an attribution vendor, so read the framing accordingly, and the method has known biases of its own. People name what they remember most recently, or say "Google" when the real first touch was a peer, and only the person filling in the form gets a vote. It remains the cheapest correction available.
- Incrementality testing and marketing mix modeling. These measure what changed when spend changed, rather than which recorded click deserves credit. They are harder to run in B2B, with its long cycles and small deal counts, and they are the only methods that speak to causation.
First-party intent data belongs in the same conversation. It is a signal that does not depend on a click either, and it has its own article.
The mechanics get a full treatment in our article on B2B marketing attribution and how to measure marketing ROI. The short version: attribution you can defend is a set of stated rules plus a second opinion, and it takes about a quarter to set up properly.
A CRM someone maintains
Every revenue marketing report is a query against the CRM. If the CRM is wrong, the report is wrong with more decimal places.
The data on CRM decay is consistent once the unreliable figures are removed. MarketingSherpa measured contact data decaying at about 2.1% per month, which HubSpot annualizes to roughly 22.5% per year. ZoomInfo cites email fields decaying at around 3.6% per month. Estimates attributed to Dun & Bradstreet run 30-40% per year.
A working range is 20-35% of your contact database going stale every year. The widely repeated "70.3% per year" figure traces to a 2015 vendor data sheet with a self-interested methodology and should not be used.
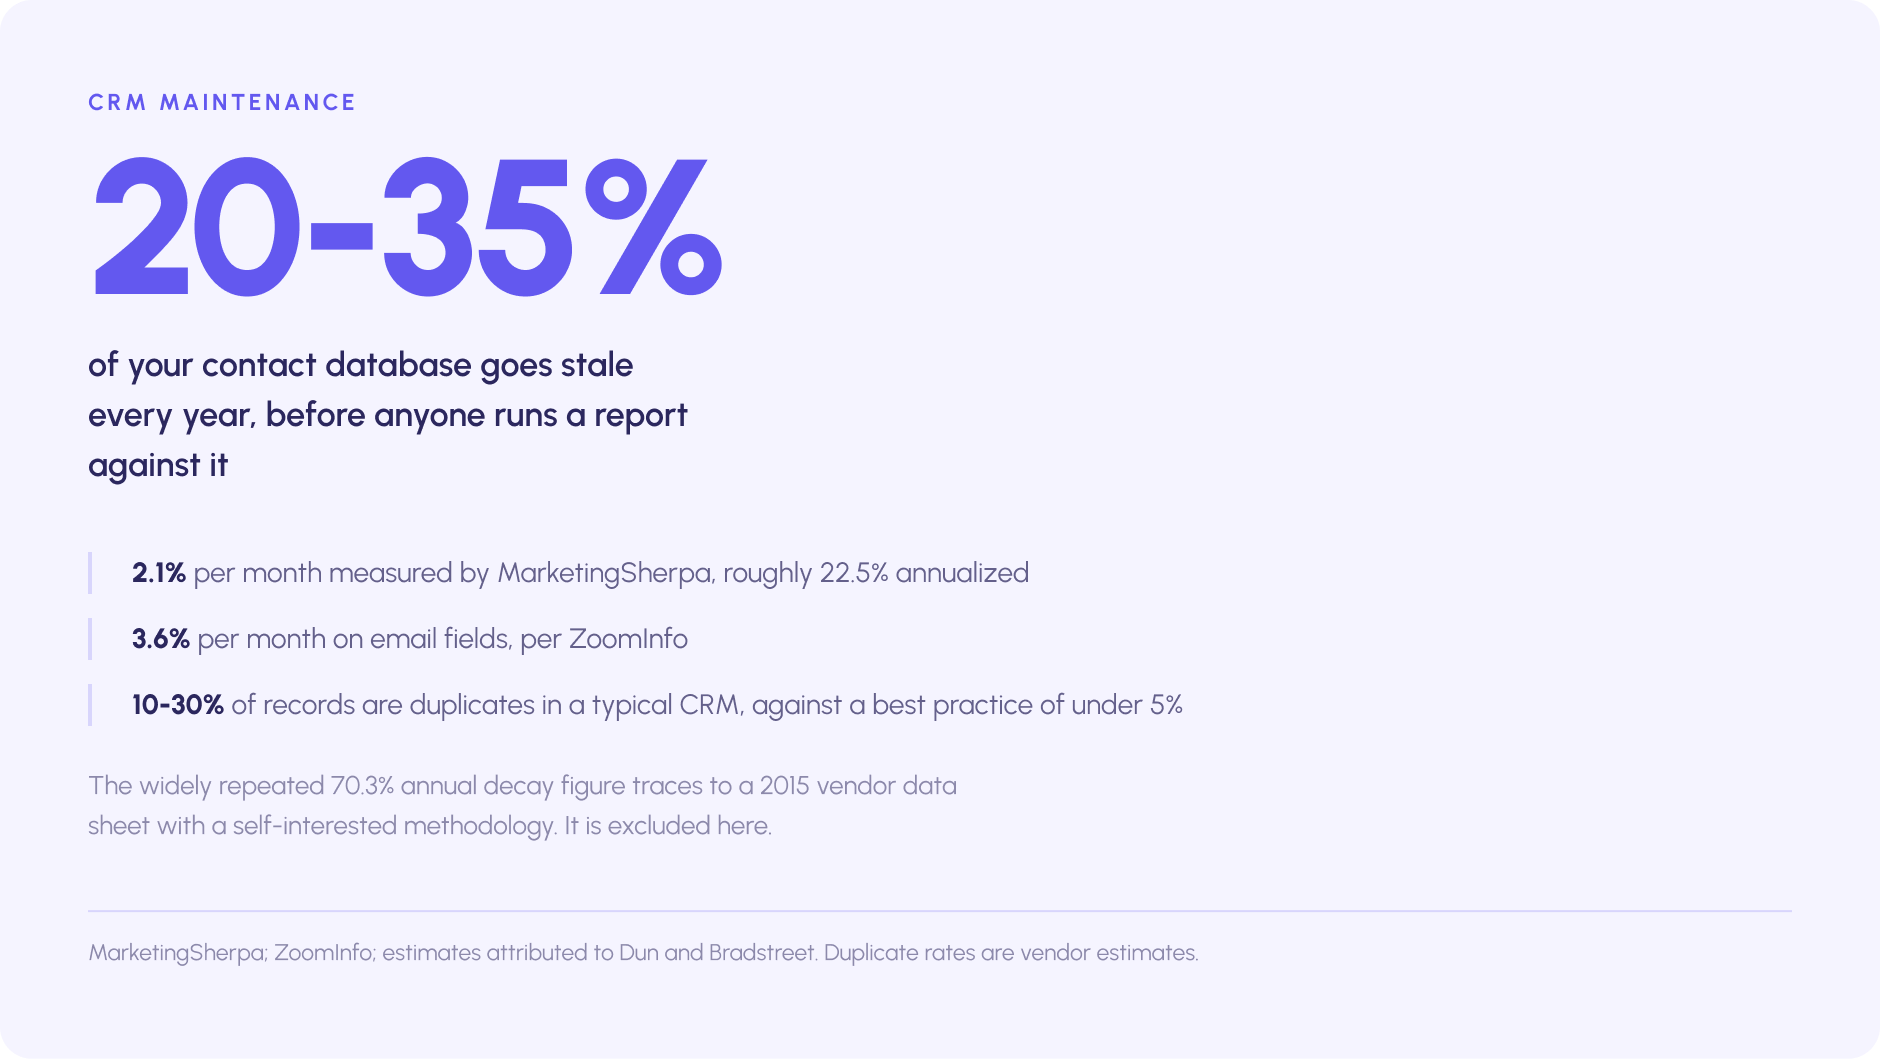
Duplicates compound the problem. Vendor estimates commonly put duplicate records at 10-30% of a typical CRM, against a best-practice threshold of under 5%. The widely quoted cost figure needs care too: the $12.9 million average annual cost of poor data quality comes from Gartner's 2020 Magic Quadrant for Data Quality Solutions, where 154 reference customers estimated their own losses. Those were large enterprises already shopping for data quality software, so the number is a self-reported estimate from the upper end of the market rather than a median business.
None of this is exotic. It is the unglamorous reason a marketing team's revenue claim falls apart in a finance review: the customer record has two owners, three lifecycle stages, and a first-touch source from a campaign that ended in 2023.
A sales team that agrees on definitions
The third prerequisite is the one most often assumed and least often checked. A revenue marketing model needs a single company-wide definition of an MQL, an SQL, an opportunity, pipeline, and a marketing touch, and it needs sales to have signed it. Otherwise, marketing and sales teams are reporting on two different companies.
Without that page, every argument about lead quality is an argument about vocabulary. Sales says the leads were bad. Marketing says they met the definition. Both are right, because the definition sales applies at the point of rejection is different from the one marketing applies at the point of handoff.
A shared definition, written down and enforced through a service level agreement in both directions (marketing commits to quality criteria, sales commits to response time), converts a blame exchange into a data exchange. The mechanics of building that agreement are covered in our guide to sales and marketing alignment.
A quick self-assessment
Before building a revenue marketing model, answer five questions in writing:
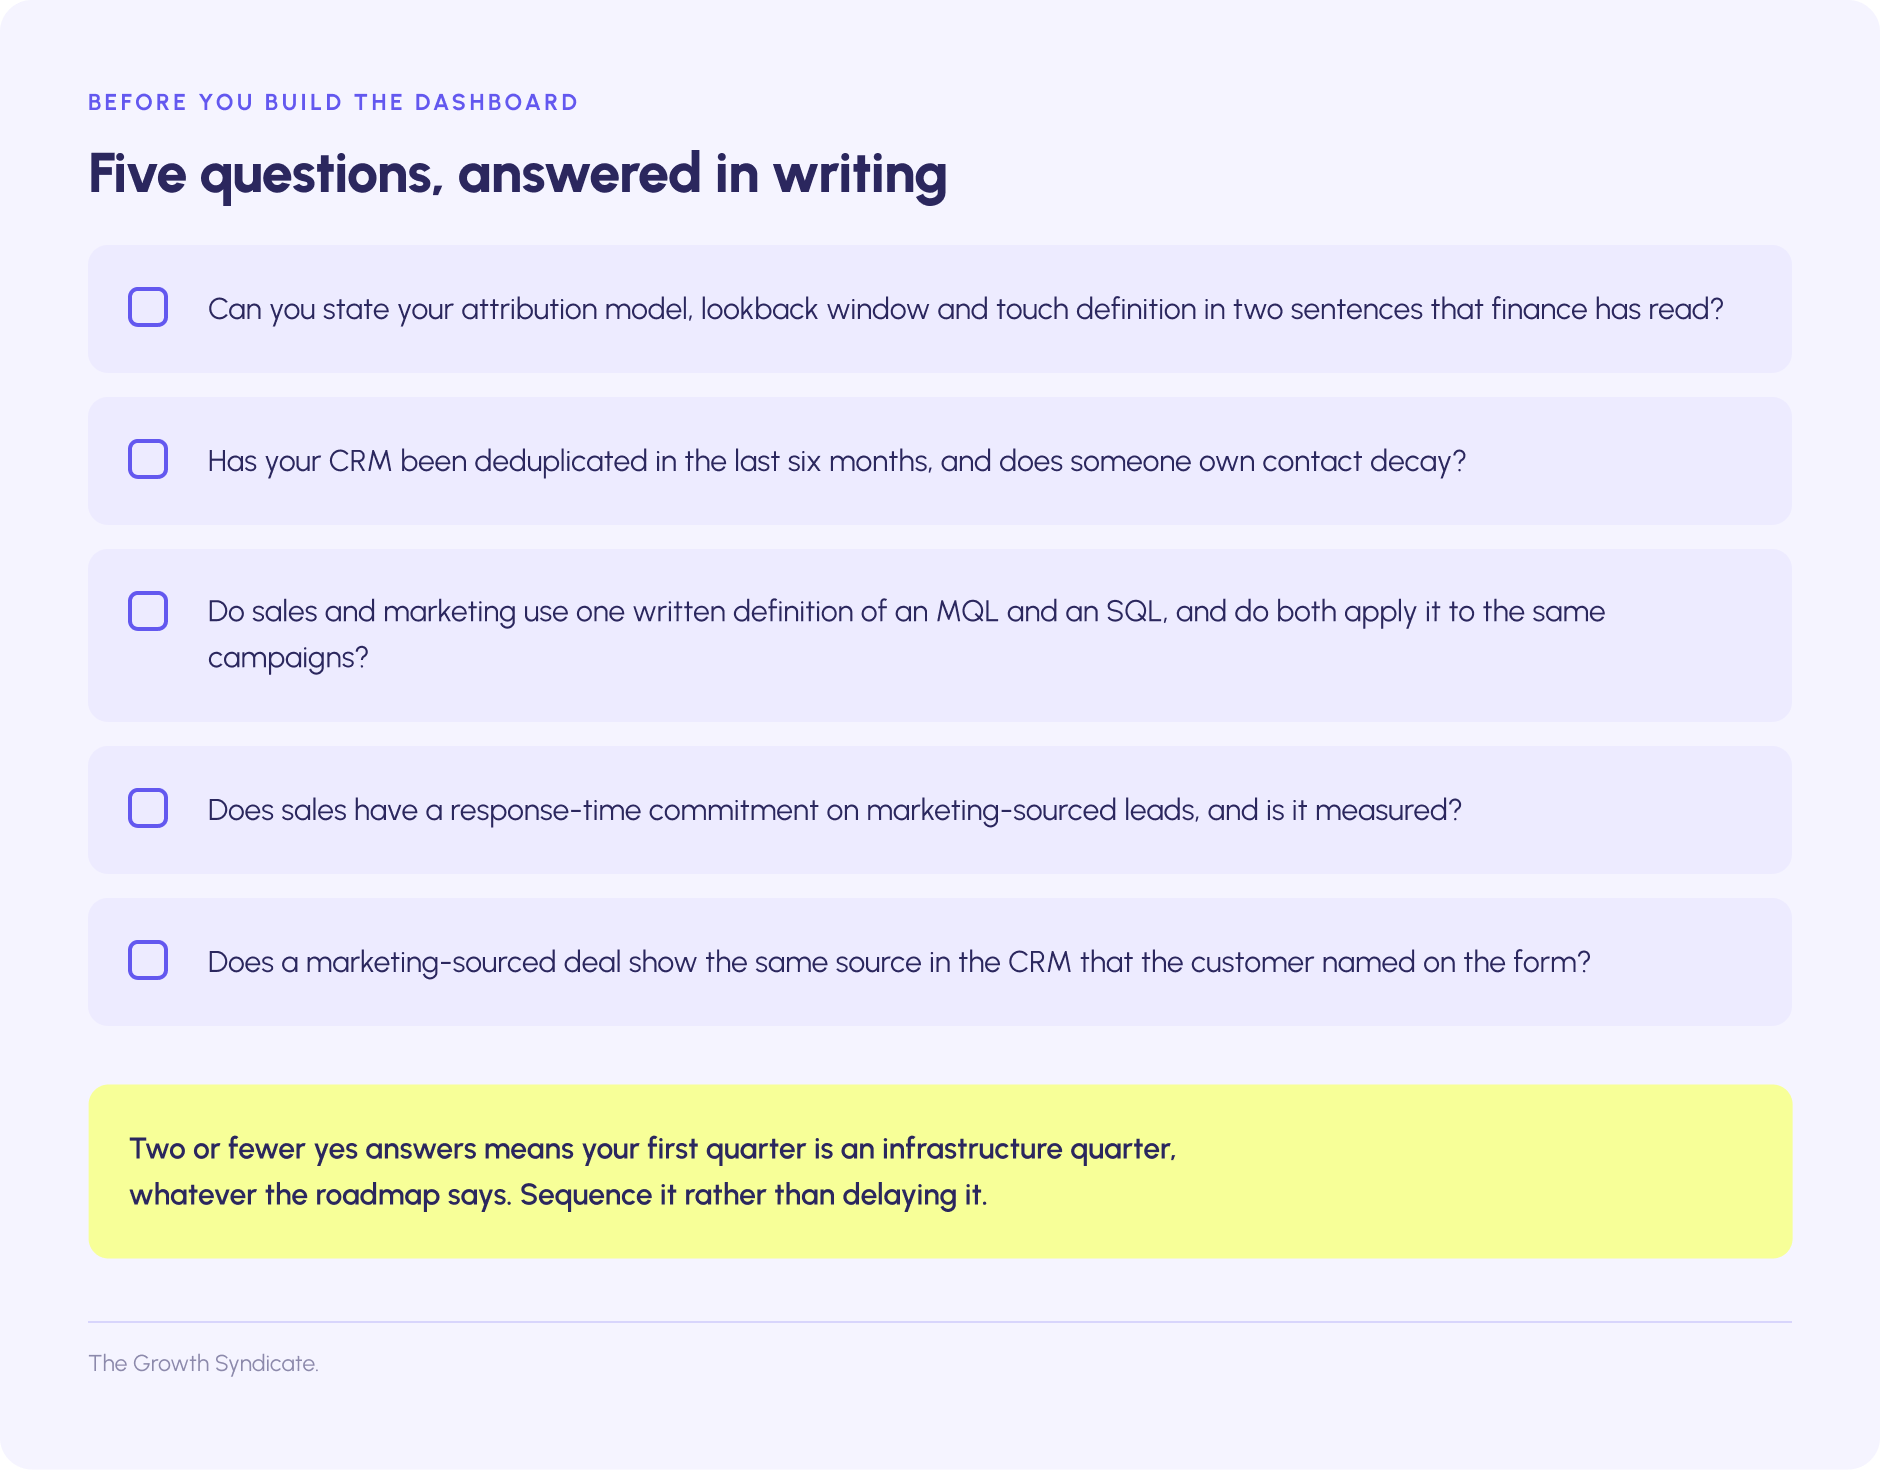
Two or fewer yes answers means the first quarter of a revenue marketing program is an infrastructure quarter, whatever the roadmap says. The right response is to sequence rather than delay, and a structured marketing audit is one way to find out which of the three you are missing.
How to build a revenue marketing strategy
With the prerequisites in view, the build has seven steps. It assumes you already have a B2B marketing strategy that these revenue goals serve. The order matters: most failed attempts to implement revenue marketing did step two first, and a revenue marketing strategy that starts with a dashboard ends with an argument.
Step 1: Agree the definitions before the dashboard
Write a one-page glossary with the sales and marketing teams in the room, plus finance: MQL, SQL, opportunity, pipeline, marketing-sourced, marketing-influenced, and touch. Include the lookback windows, and note which business goals each definition feeds. Get it signed, in the literal sense of someone's name on the document. This page becomes the first slide of every quarterly review, and it is the reason the numbers on the following slides are believed.
Step 2: Choose the revenue marketing metrics that replace MQLs
The market has already voted on which revenue marketing KPIs matter, and the key performance indicators it chose are dollar figures. Benchmarkit's 2025 B2B marketing benchmarks, run with Emergence Capital, found the three most reported marketing metrics were pipeline generated (62% of respondents), opportunities generated (51%), and new ARR bookings (36%). Absolute pipeline dollars have displaced percentage-of-pipeline claims.
Pick five. A dashboard with twenty revenue metrics is a lead dashboard with better vocabulary, and it will be read the same way: vanity metrics with a dollar sign attached. Choose the five that sales and finance would have picked, because those are the ones your revenue marketing efforts will be judged on.
Step 3: State the attribution model out loud
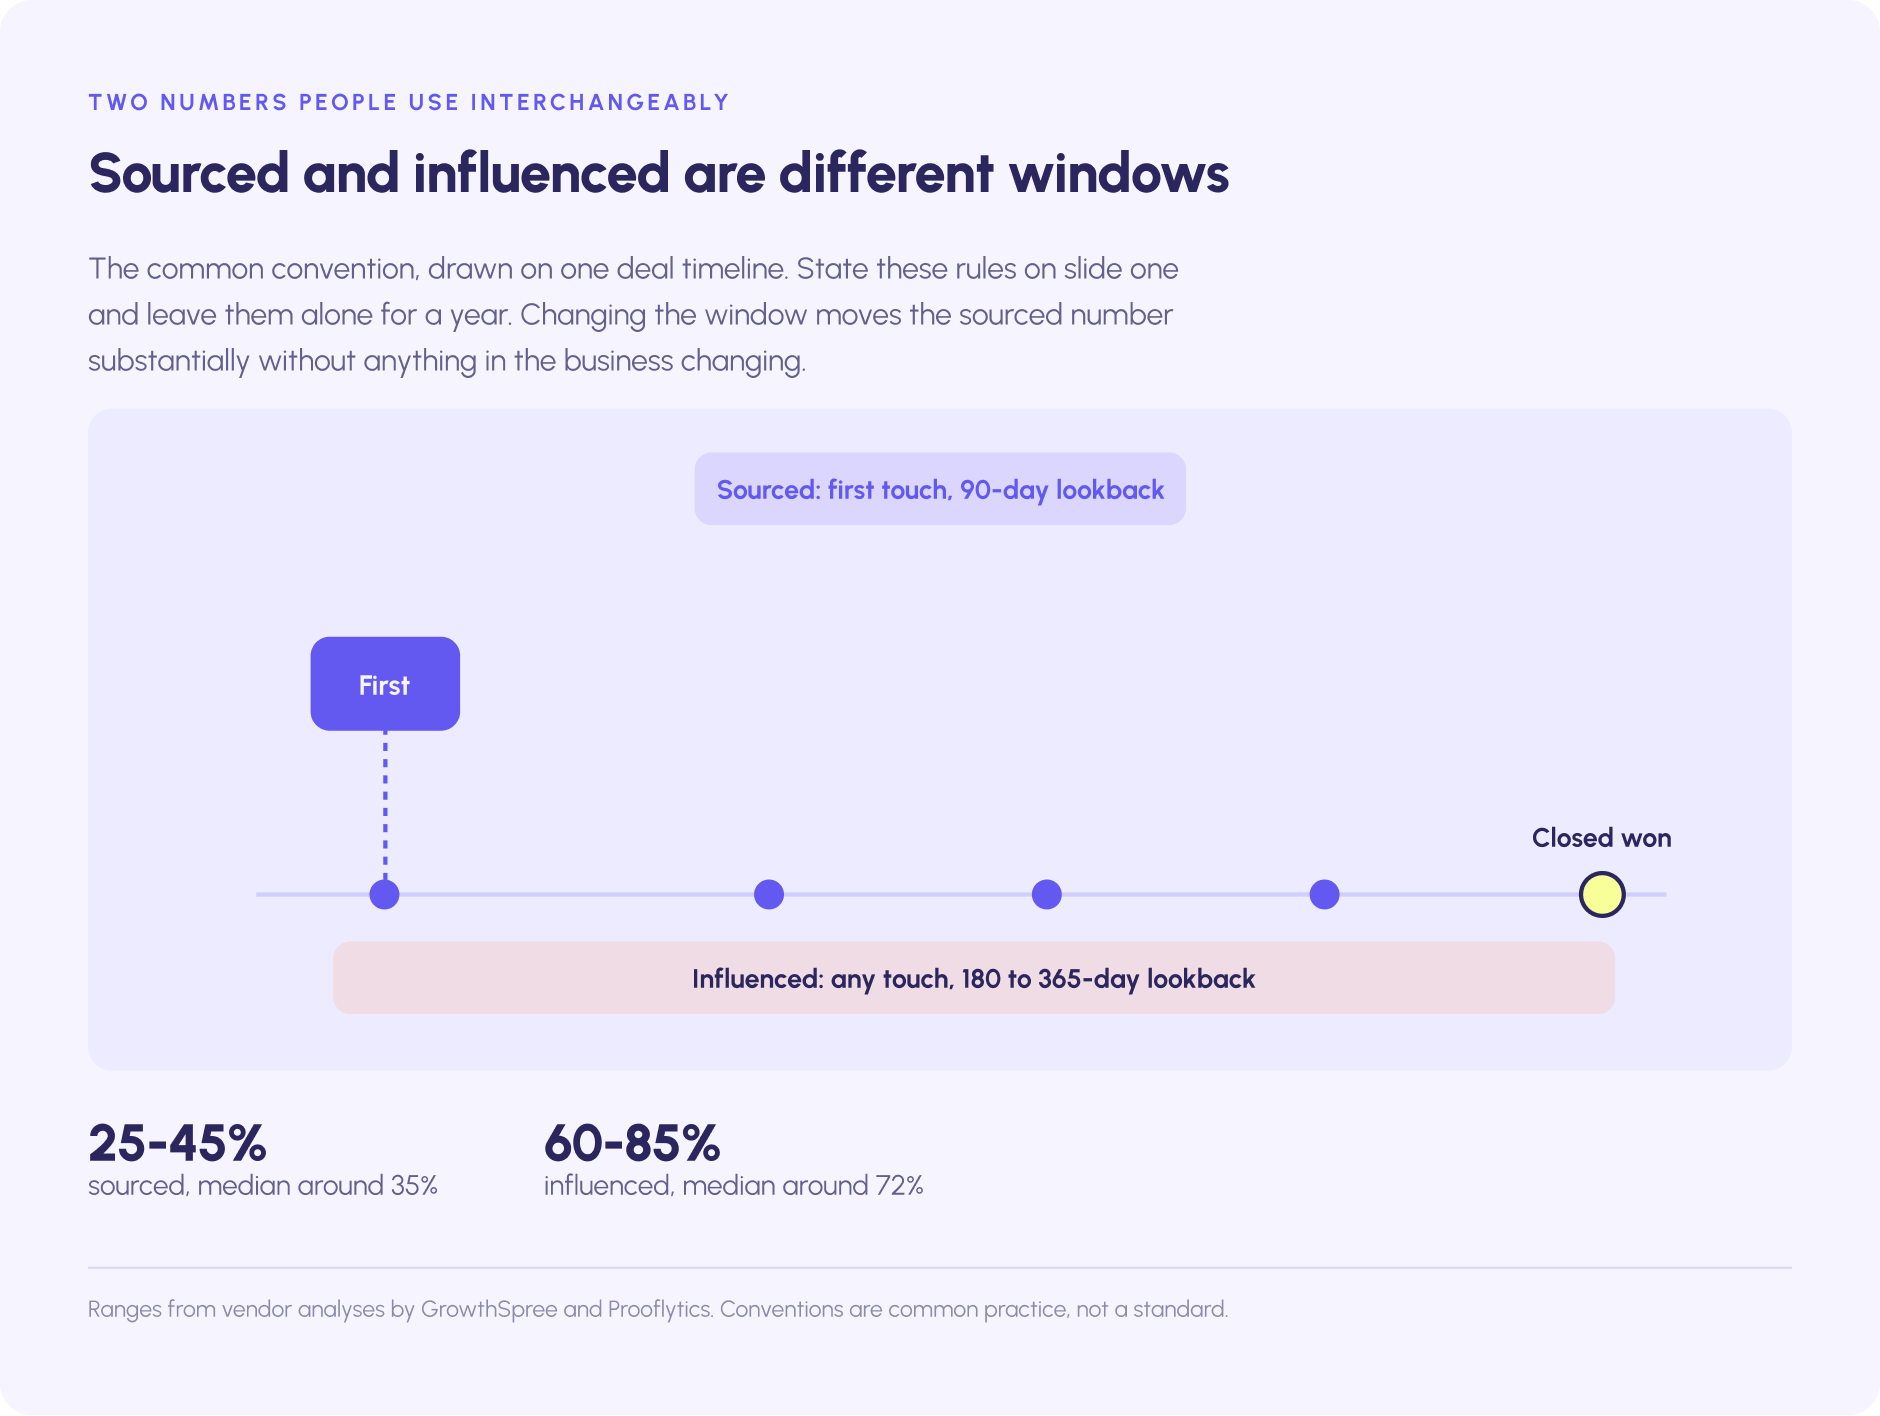
Sourced and influenced pipeline are the two numbers everyone will ask about first, and they need explicit rules. The common convention: a deal is marketing-sourced if the first touch was a marketing-owned channel within a 90-day lookback, and marketing-influenced if any marketing touch occurred during the deal within a 180- to 365-day window.
Published B2B SaaS ranges, drawn from vendor analyses by GrowthSpree and Prooflytics, sit at roughly 25-45% sourced (median around 35%) and 60-85% influenced (median around 72%). A secondary citation of Gartner's 2025 CMO Spend Survey puts the median sourced share near 33%, though we have not seen that figure in the primary report. Inbound-led companies report far higher; sales-led enterprise businesses often sit under 20%.
Treat all of these as ranges rather than targets, and check them against current B2B marketing benchmarks rather than a figure lifted from a vendor blog. The same underlying performance can produce a very different sourced number once the lookback window changes. That is exactly why the model has to be stated on slide one and left alone for a year.
Step 4: Negotiate the number with sales and finance
A revenue marketing team owns a number derived from the company's revenue goals, and the derivation should be visible. Teams that skip this step end up with a target nobody can trace back to the business goals it was meant to serve. A worked example:
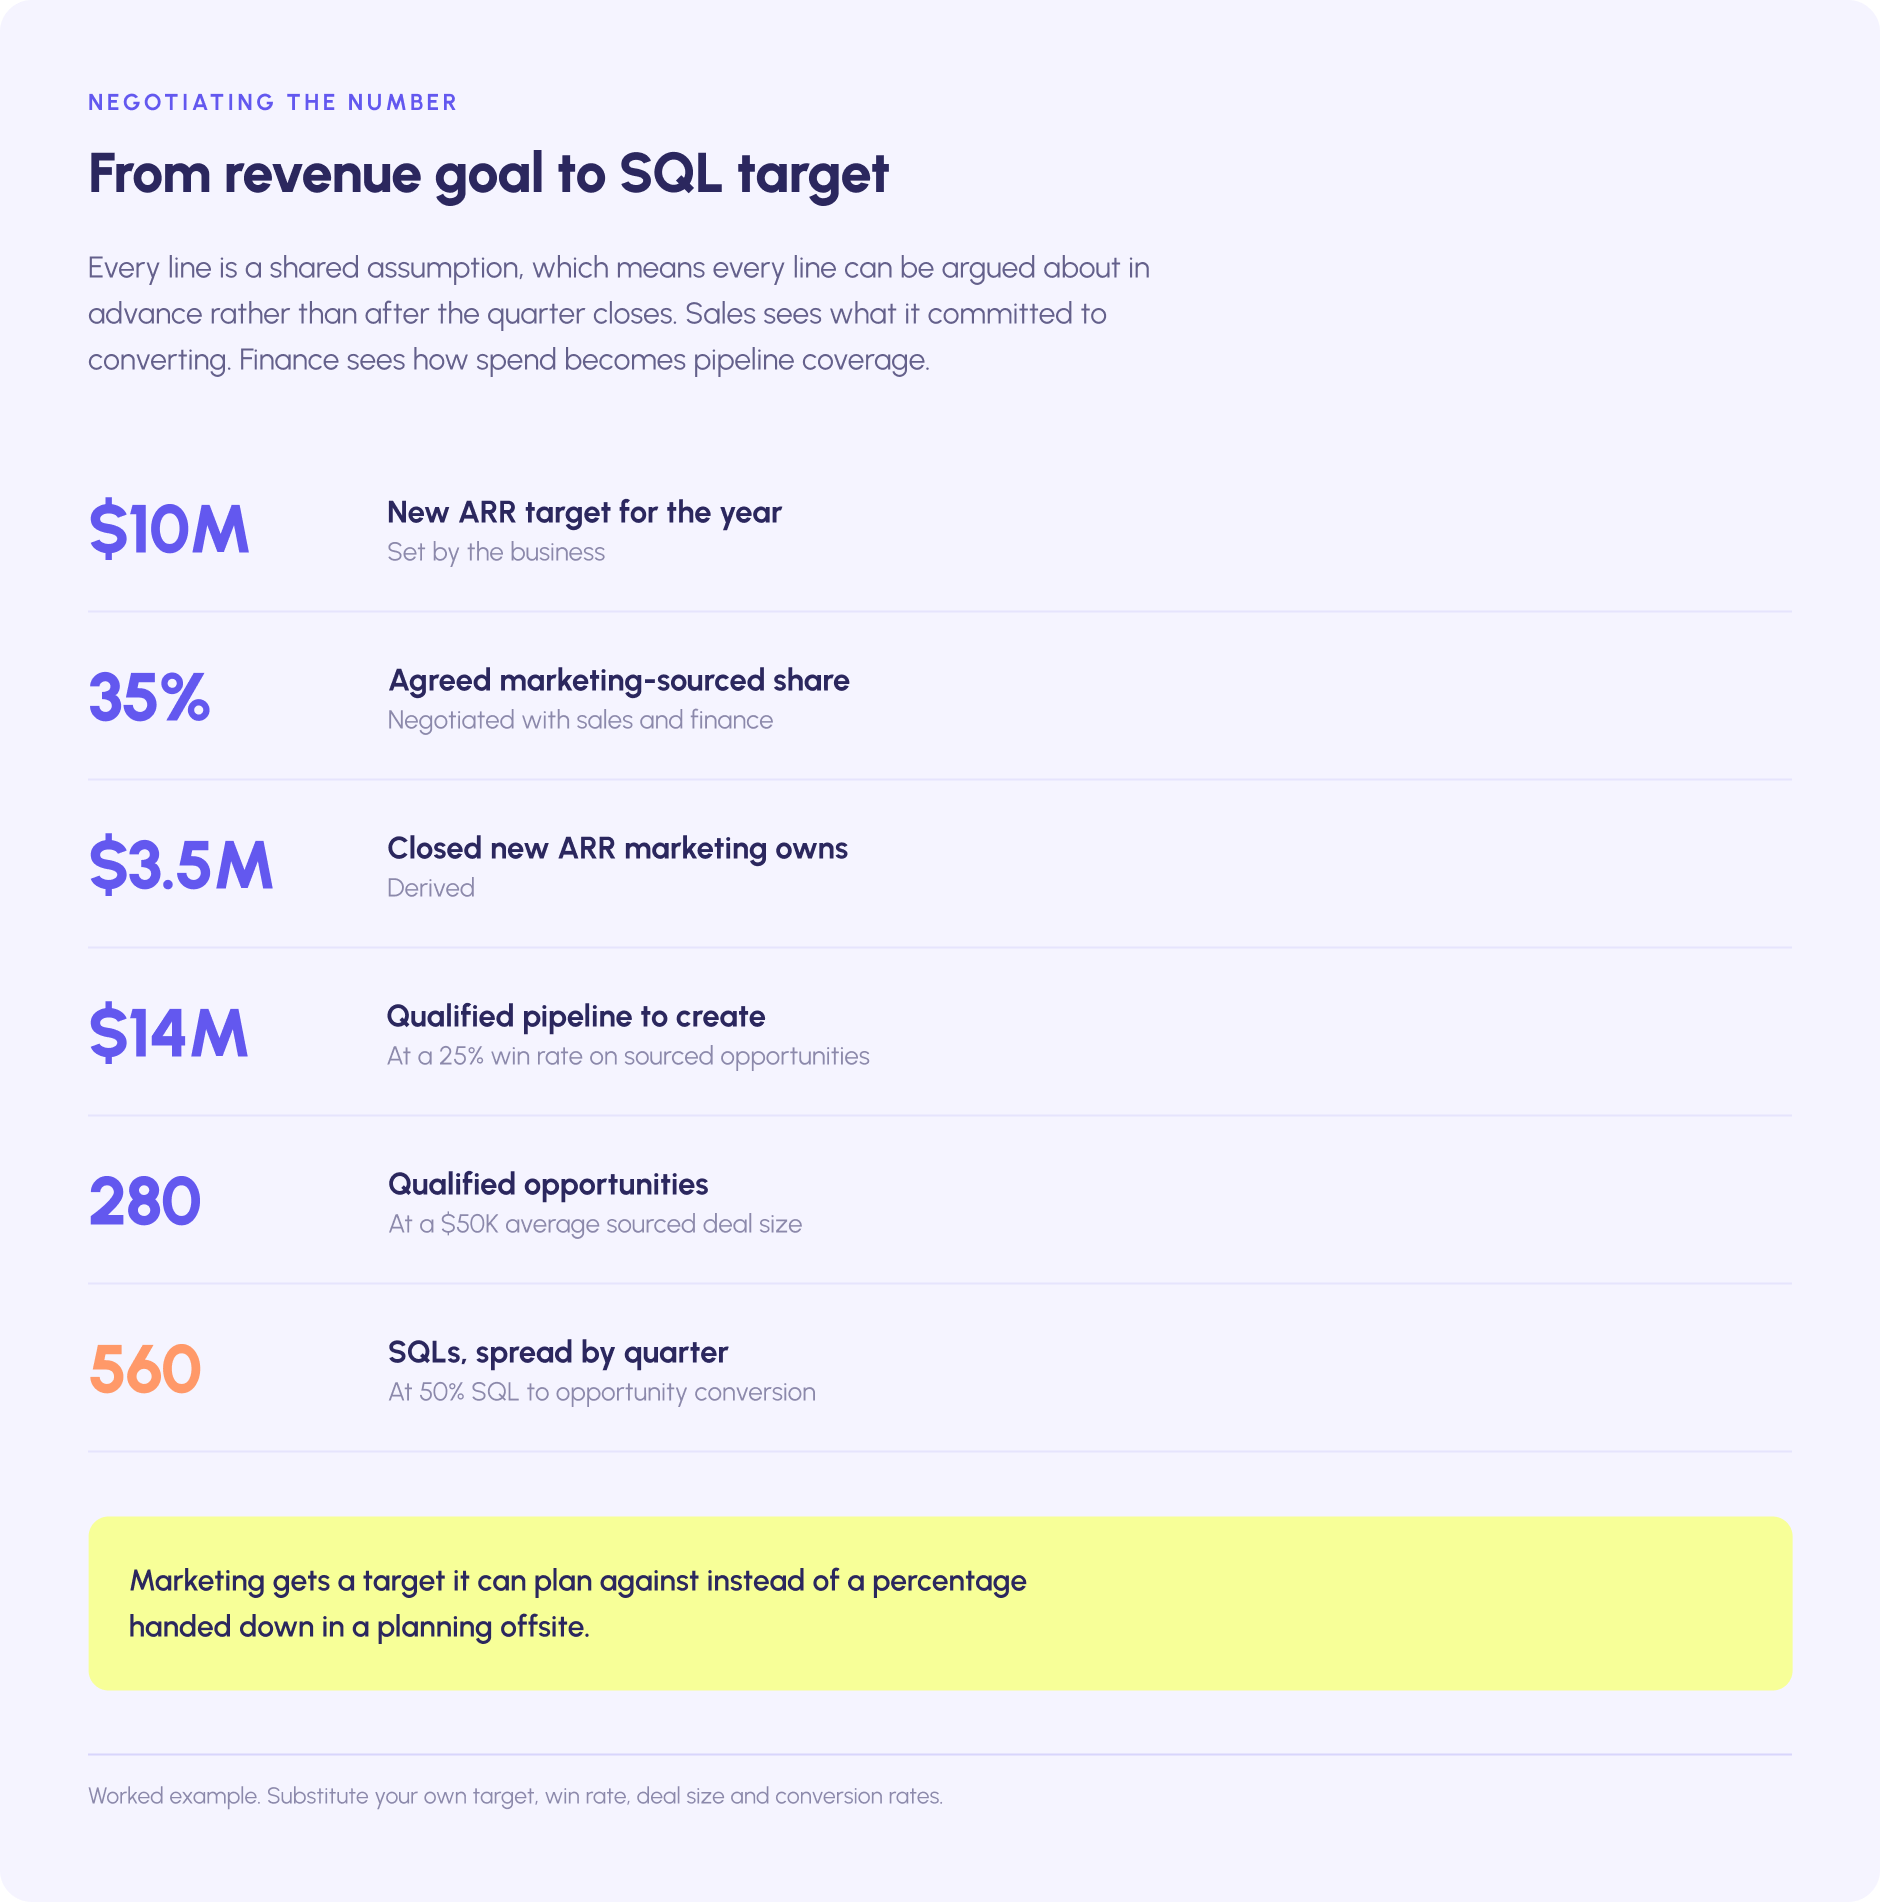
Every line in that chain is a shared assumption, which means every line can be argued about in advance rather than after the quarter closes. Finance sees how marketing spend converts into pipeline coverage, which is the only version of marketing ROI a CFO will sign off on. Sales sees what it committed to converting, and the negotiation between marketing and sales happens before the quarter instead of after it. Marketing sees a target it can plan against instead of a percentage handed down in a planning offsite.
Step 5: Tie compensation to revenue outcomes
Compensation is where revenue marketing stops being a reporting change and starts changing how sales and marketing efforts are rewarded. Practitioners who write about comp structures argue that a shared-revenue component below about 10% of variable pay is too small to change behavior, and that 15-25% of variable creates real shared interest. Those are practitioner rules of thumb rather than findings from published research. One structure that works, described by Steve Roop for SaaS marketing teams: a company-wide marketing bonus gated on the bookings goal (110% of plan earns 110% of bonus), then weighted by each team's pipeline target, so a demand generation team at 104% of its pipeline goal earns a corresponding uplift.
The structural problem is lag. With a six- to twelve-month sales cycle, the revenue impact of marketing efforts lands two or three quarters after the program ran. Compensation plans that ignore this pay marketing for the previous leader's work and punish the current one for investing, which is the fastest way to turn revenue marketers back into lead generators.
Step 6: Report alongside sales, weekly and quarterly
A revenue marketing team does not present to itself, and its marketing initiatives are not reviewed in a marketing-only forum. Two cadences do the work. The weekly cadence is a joint sales and marketing pipeline review: what was created, what advanced, what stalled, and why. The quarterly review is presented to the leadership team with sales in the same session, and it contains a fixed set of elements:
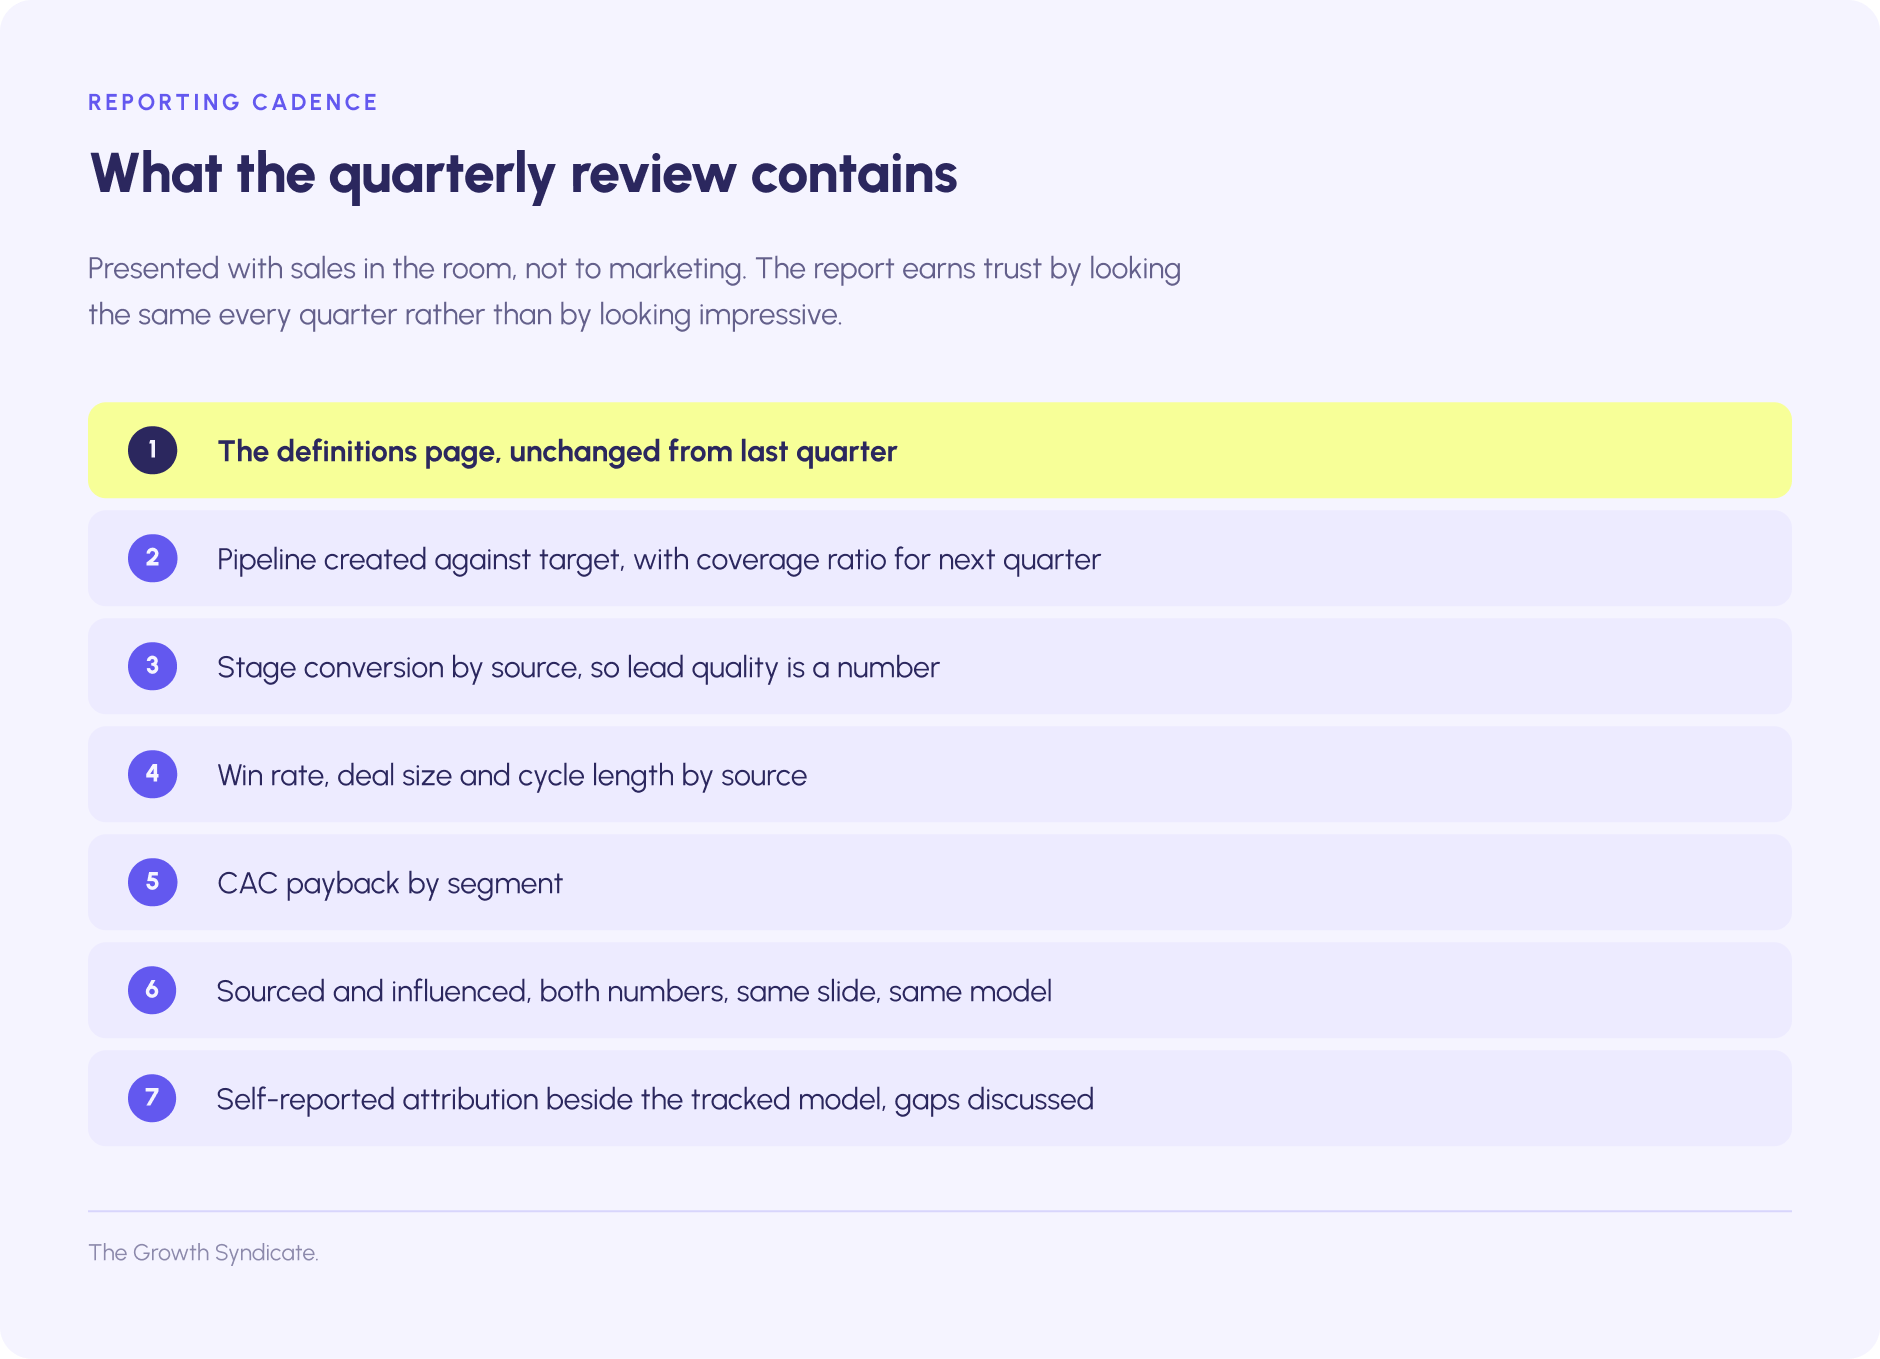
The discipline is repetition. The report earns trust by looking the same every quarter, and by measuring revenue generated against the revenue goals agreed at the start of the year rather than goals restated at the end of it.
Step 7: Protect the buyers who are not buying yet
This is the step that separates revenue marketing from crude revenue accountability, and it is the one most revenue marketing content ignores.
Research by John Dawes at the Ehrenberg-Bass Institute for the LinkedIn B2B Institute, published in 2021, found that businesses change most service providers roughly every five years. That means around 20% of buyers are in market in any given year and about 5% in a quarter. The rest, roughly 95%, are not looking. The split varies by category, from about 98/2 to 93/7 depending on purchase frequency, and it is a heuristic rather than a law, but the shape holds across B2B.
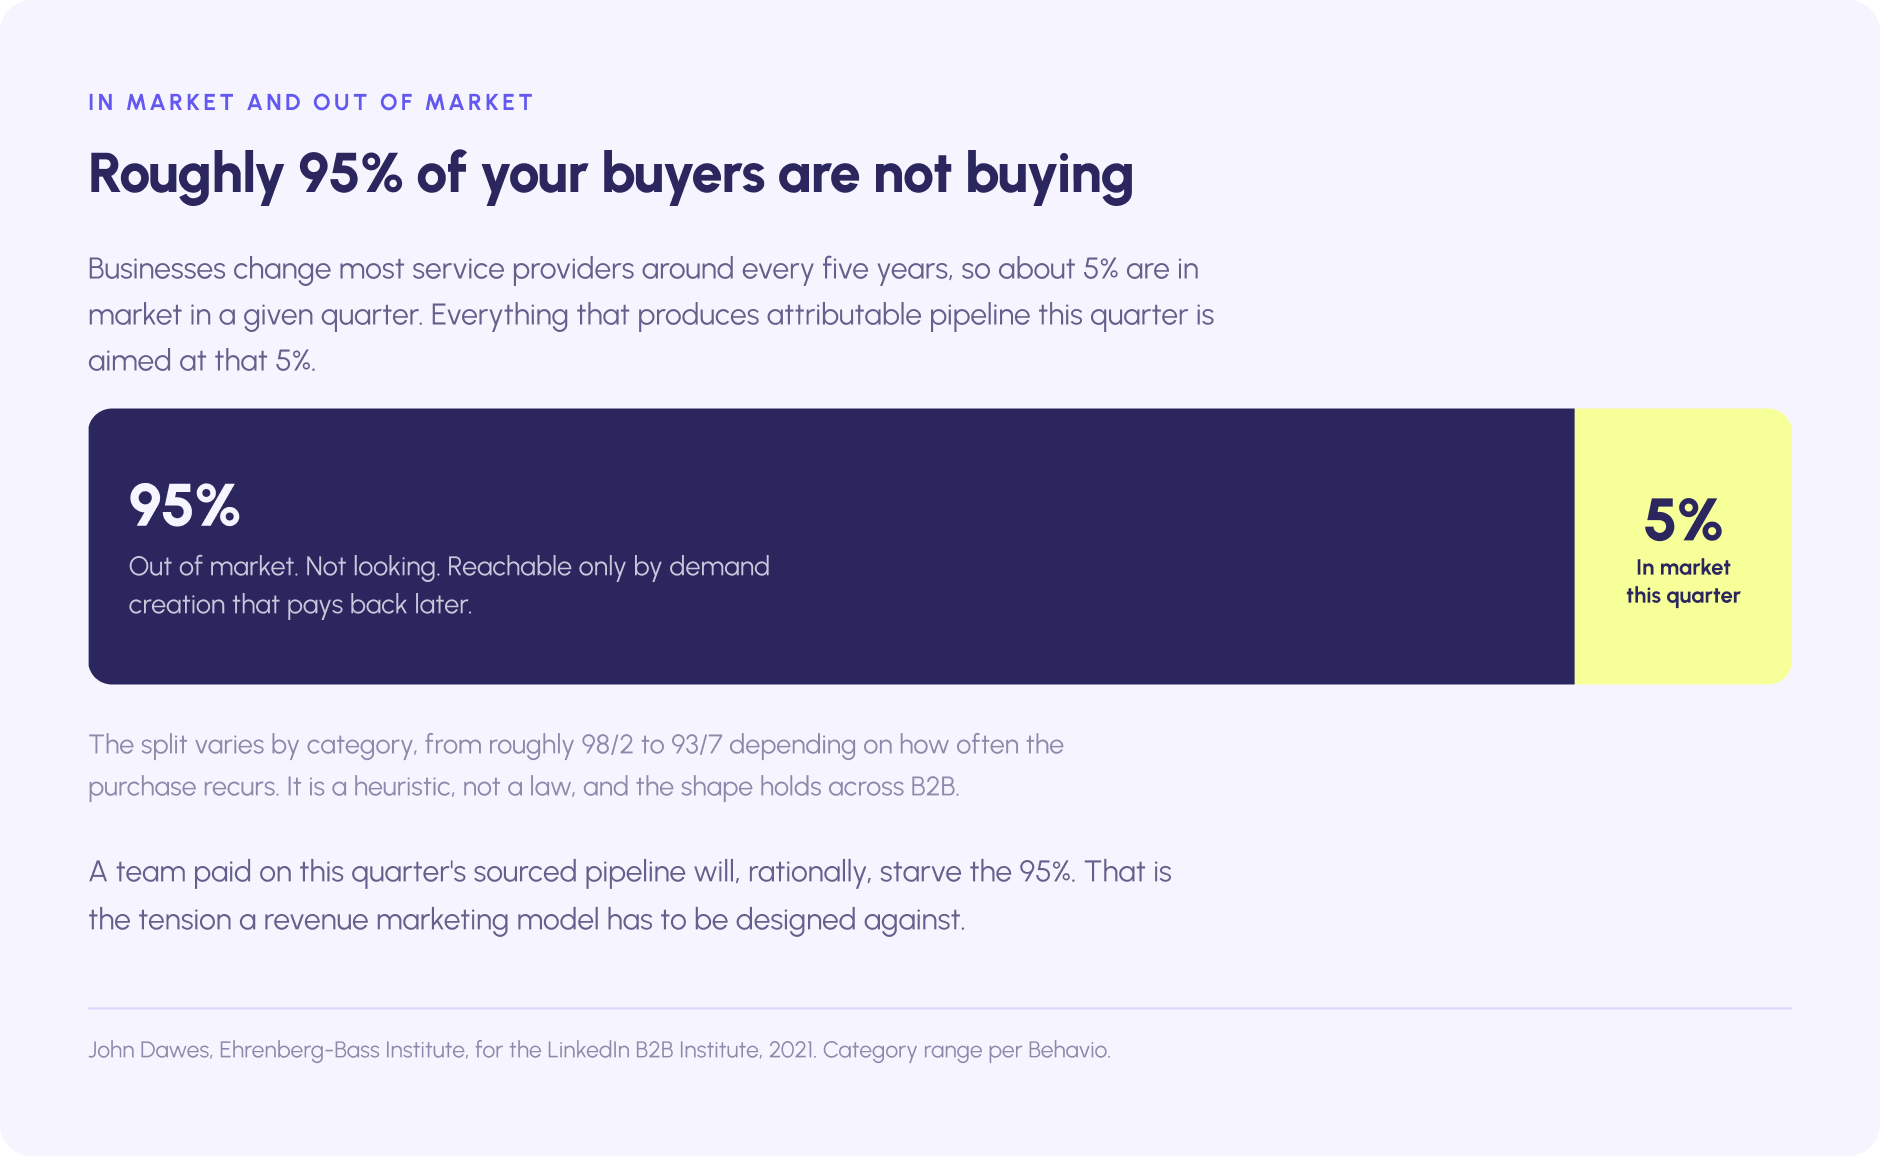
The implication for a marketing strategy measured only on this quarter's revenue is uncomfortable. Marketing campaigns that produce attributable pipeline this quarter are aimed at the 5%. Programs that produce pipeline in eighteen months are aimed at the 95%, and they show almost nothing measurable now. A team paid on this quarter's sourced pipeline will, rationally, starve the 95%, and the marketing investments that would have produced next year's revenue growth are the first to go.
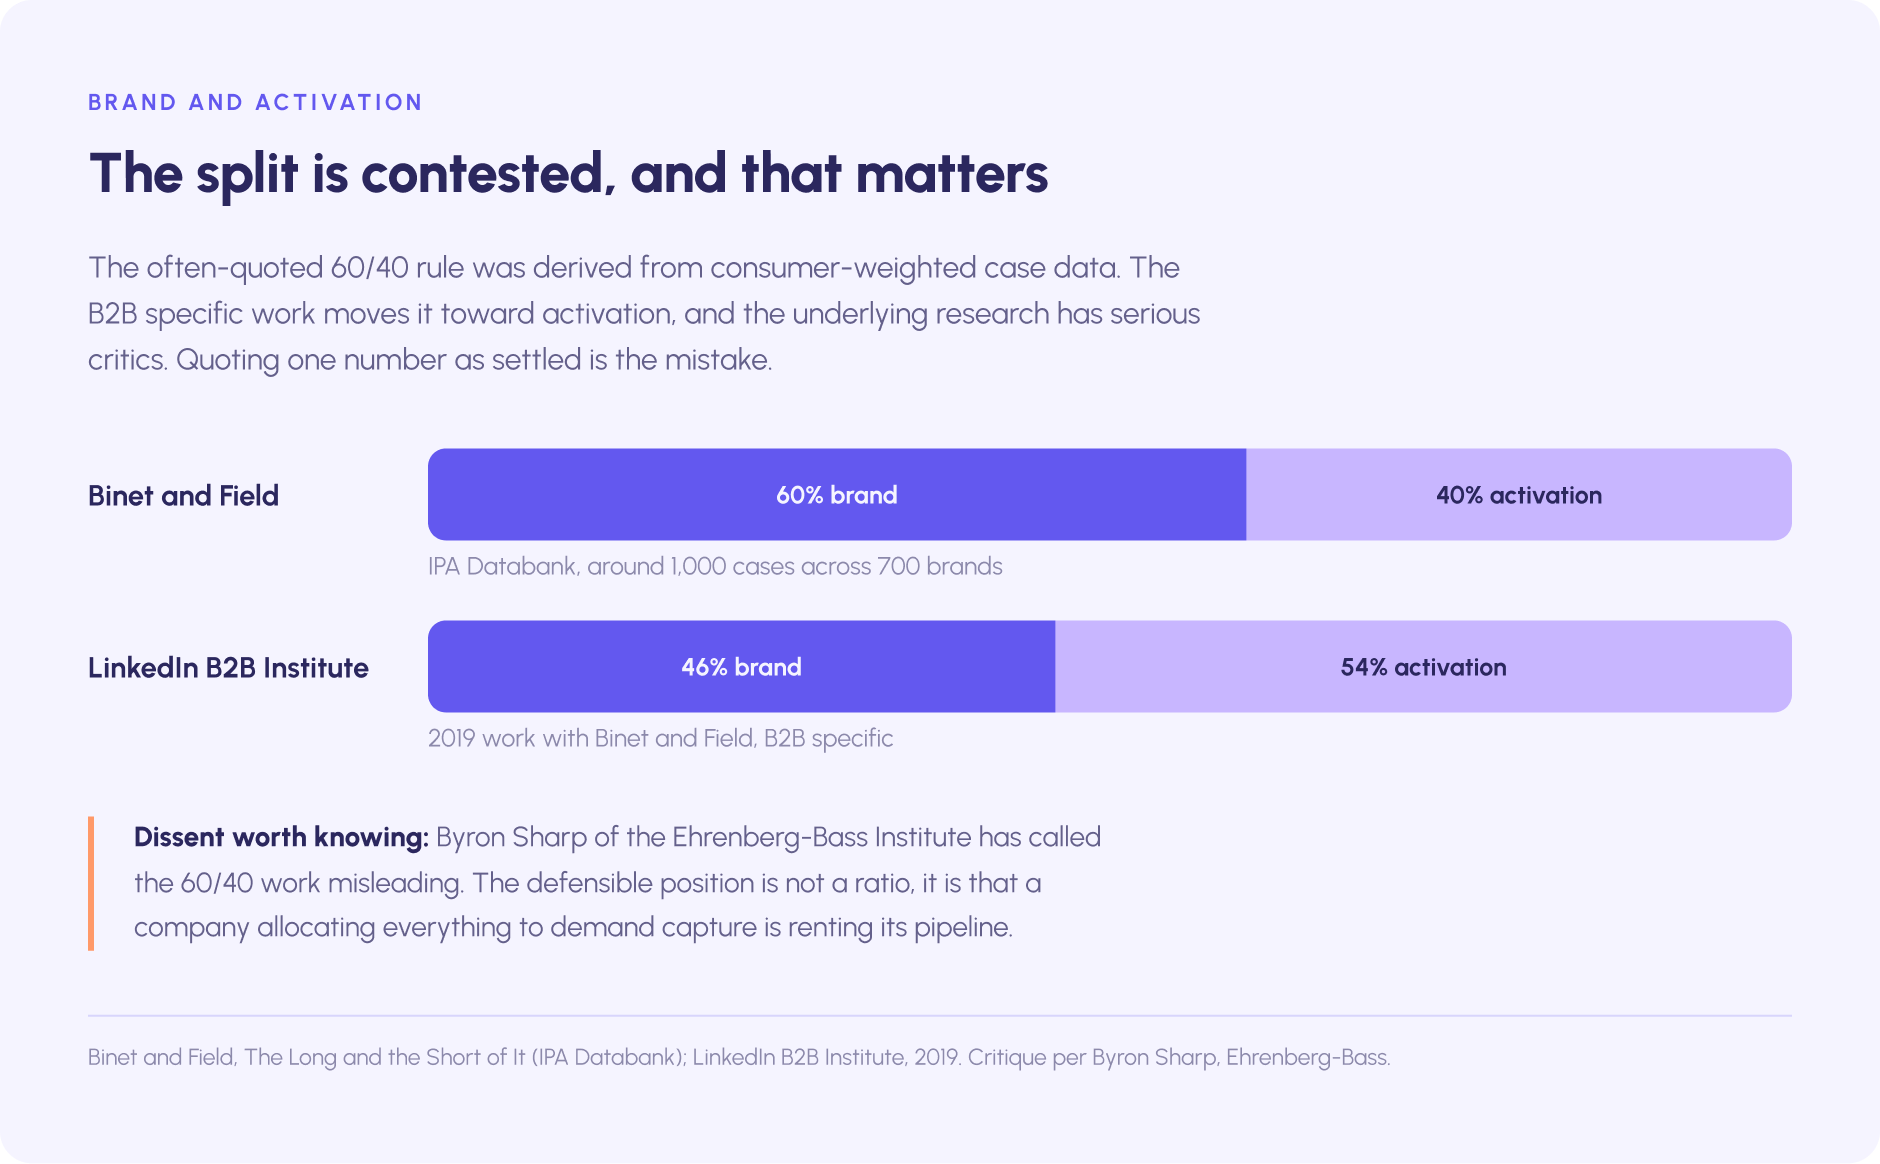
Les Binet and Peter Field's analysis of the IPA Databank (around 1,000 case studies across 700 brands) found that campaigns balancing roughly 60% long-term brand building with 40% short-term activation delivered the strongest growth. Their 2019 work with the LinkedIn B2B Institute tilted the B2B optimum toward activation, at roughly 46% brand to 54% activation. Byron Sharp of Ehrenberg-Bass has called the 60/40 work misleading, so the exact ratio is contested. What is not contested is that a company allocating 100% of its marketing dollar to demand capture is renting its pipeline rather than building it, and that the traditional marketing model of brand-only spending fails in the opposite direction.
The practical fix is to ring-fence a brand and education budget with its own metrics (share of search, unaided awareness in the ICP, direct and branded traffic trends, self-reported attribution mentions) and to report those alongside the pipeline numbers rather than in place of them. That puts long-term marketing efforts and short-term revenue generation on the same page, instead of letting brand report on its own terms. Revenue marketing with a protected long-term line is a growth strategy that compounds. Without one, it is a harvest, and sustainable business growth does not come from harvests.
[[CTA 1: mid-article]]
The revenue marketing stack, without the sales pitch
Revenue marketing is frequently sold as a software category. It is an operating model that software supports but cannot substitute for. The marketing automation platforms and attribution tools in the table below are the supporting cast. The layers, what they do, and what they cost as of mid-2026:
Three notes on the market.
First, the category is consolidating from "attribution" into "revenue intelligence," bundling forecasting and planning; that is useful and it also raises prices.
Second, every tool in the attribution row models tracked touchpoints only, so none of them resolves the dark funnel problem described above; self-reported attribution and incrementality testing remain the complements.
Third, no tool fixes a CRM with 25% duplicates or a definitions page nobody signed. Budget for the tool after the infrastructure quarter, not before, and treat it as one of the marketing investments the revenue model has to justify rather than as the model itself.
How revenue marketing goes wrong
Revenue accountability creates its own incentives to cheat, and the cheating is usually well-intentioned. Five patterns recur, and each one turns revenue marketing efforts back into a reporting exercise.
Attribution model shopping
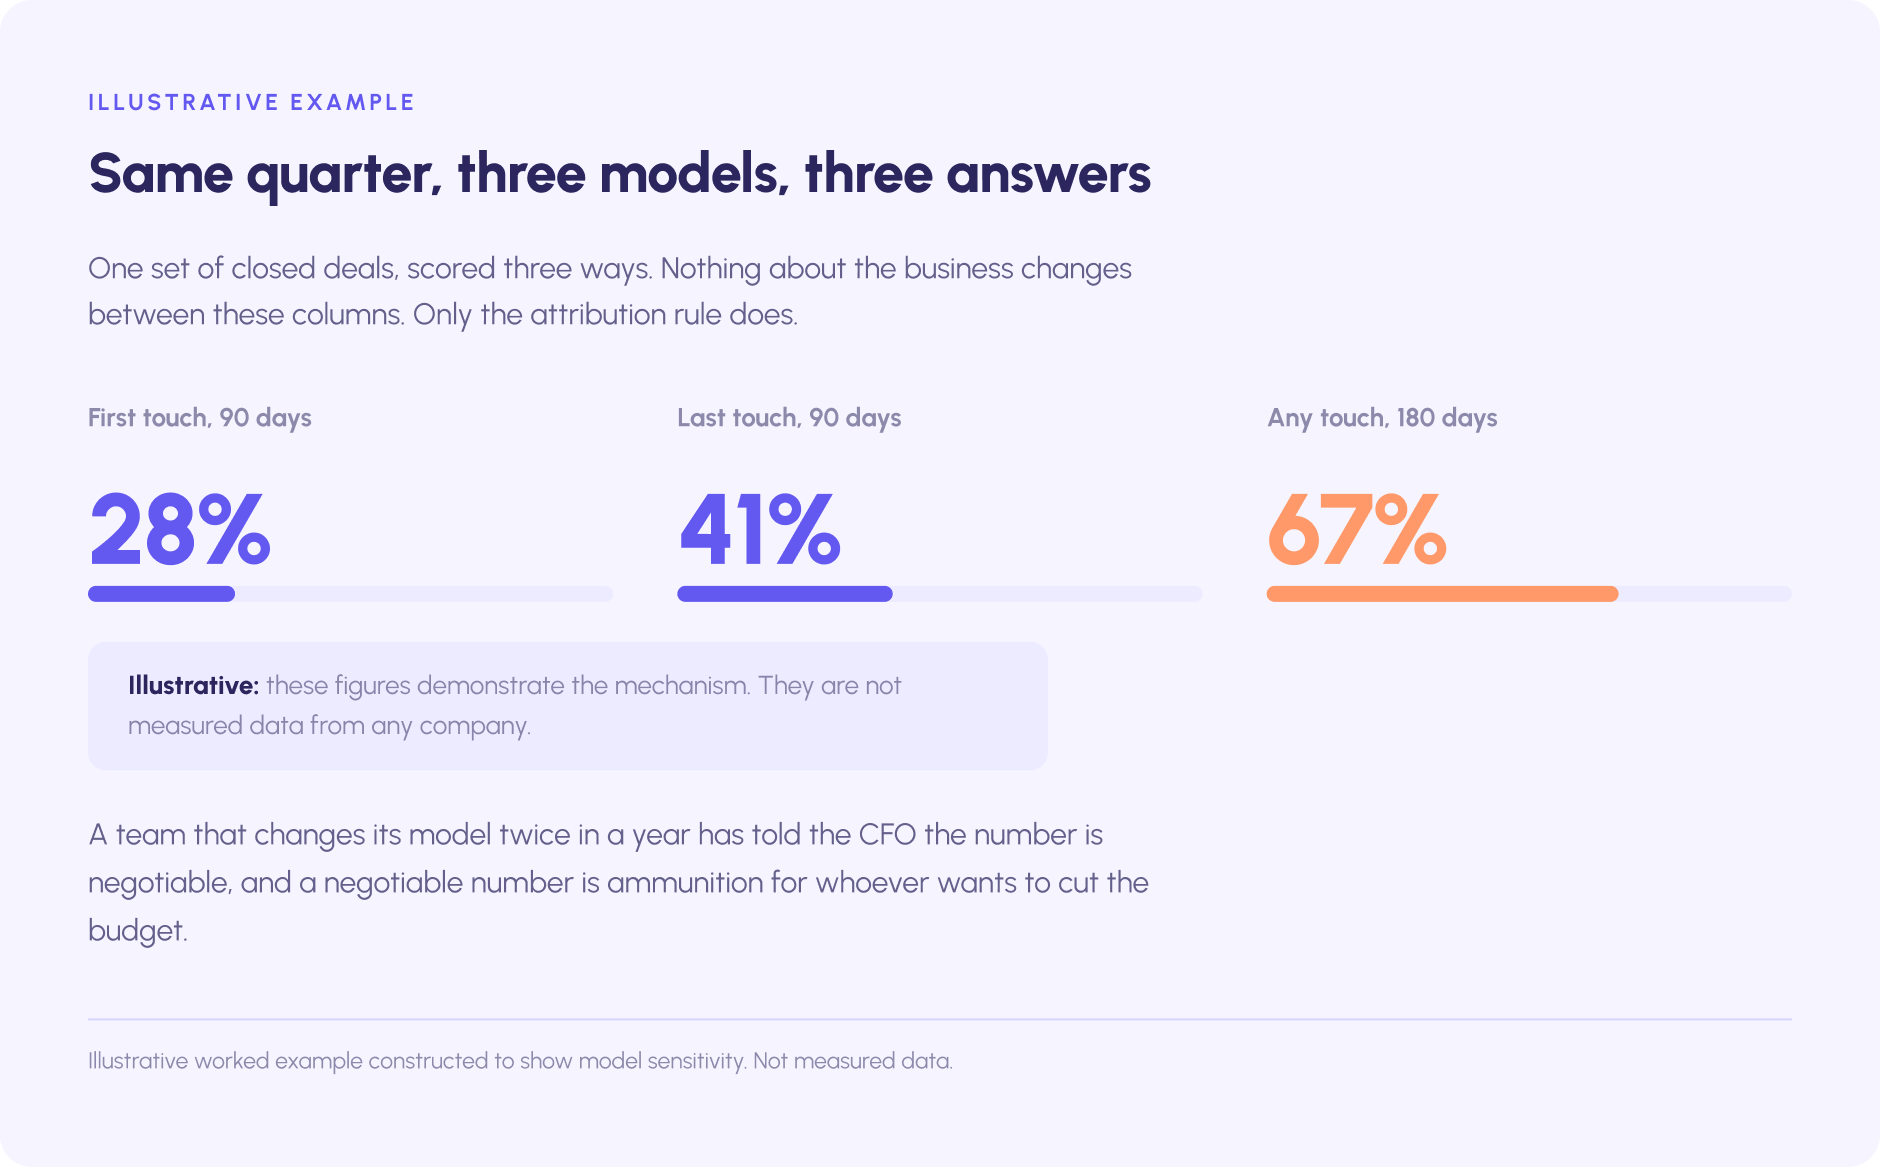
When the sourced number disappoints, the fastest fix is a different model. First-touch to last-touch, 90-day lookback to 180-day, "any touch" to "meaningful touch." Each change can be justified, and each one destroys comparability with the previous quarter. A team that changes its model twice in a year has told the CFO that the number is negotiable, and a negotiable number is ammunition for whoever wants to cut the budget.
Crediting the harvest, not the planting
Last-touch and most multi-touch models systematically over-credit branded search, retargeting, and direct traffic. Those channels capture demand that was created somewhere else: a podcast, a peer recommendation, a conference talk. Reporting them as the source of pipeline moves marketing spend toward the capture mechanism and away from the creation mechanism, and it flatters exactly the marketing channels that would have converted anyway. The pipeline then declines 30 to 90 days after the upstream investment is cut, and the decline is blamed on the market.

Reporting sourced upstairs and influenced downstairs
The sourced number goes to the board because it is conservative and defensible. The influenced number goes to the marketing all-hands because it is large and makes the campaigns look good. Both are real, and presenting each to the audience that prefers it teaches everyone that marketing has two sets of books. The same slide, both numbers, every time.
Demand generation as an accountability shield
The demand generation movement began as a legitimate correction to an obsession with generating leads at any cost. It has also become a place to hide. "Attribution is hard and the buying journey is complex" is a true statement that gets deployed as a reason not to measure anything, and the marketing team that says it has often not influenced a deal it can name.
Healthy marketing organizations hold both positions. They invest in the 95% and they report the 5%, and they do not use the difficulty of the first to avoid the second. That balance is what separates marketing as a revenue driver from marketing as a cost center.
Owning a number you do not control
The deepest objection to revenue marketing is a fair one: marketing does not run the close, so sales and marketing efforts are scored on a shared outcome that only one side finishes. A sales team that discounts, mis-forecasts, or ignores a quarter's worth of leads will drag marketing's revenue number down with no corresponding change in marketing's work.
The answer is to design the model so that shared numbers are shared in both directions, with sales measured on conversion of marketing-sourced opportunities and response time on marketing-sourced leads.
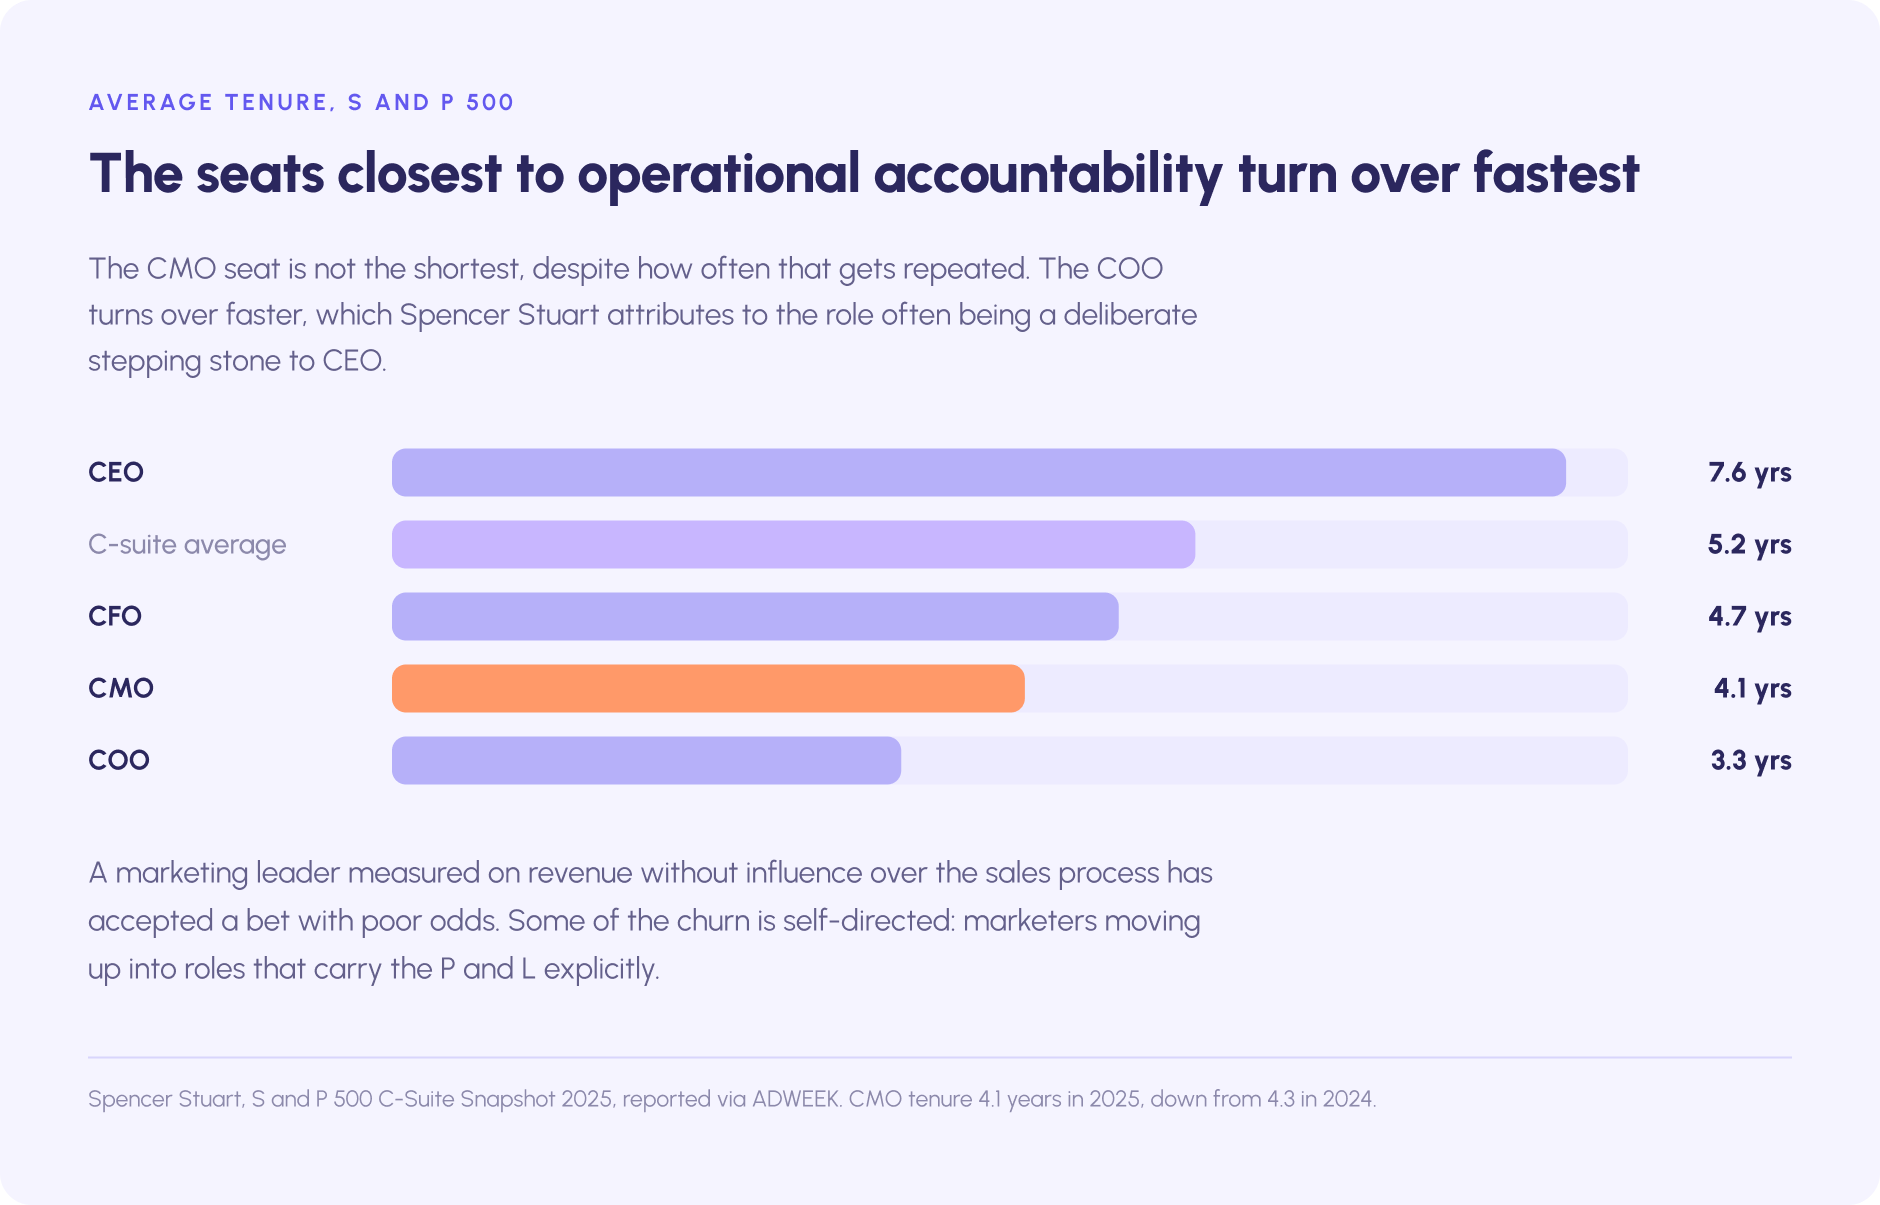
The same tension helps explain a structural fact about the profession. Spencer Stuart's S&P 500 C-Suite Snapshot for 2025 puts average CMO tenure at 4.1 years, down slightly from 4.3 the year before, against a C-suite average of 5.2 years.
Only the COO seat turns over faster, at 3.3 years, and Spencer Stuart attributes that to the COO role often being a deliberate stepping stone to CEO. The same firm found that 66% of Fortune 500 companies had a C-suite marketing leader in 2024, down eight percentage points in a year. Whether revenue accountability lengthens or shortens that tenure is unresolved. Some of the churn is marketers moving up into chief revenue officer or chief growth officer roles that carry the P&L explicitly.
What is clear is that a marketing leader measured on revenue without influence over the sales process has accepted a bet with poor odds.
What revenue marketing looks like when it works
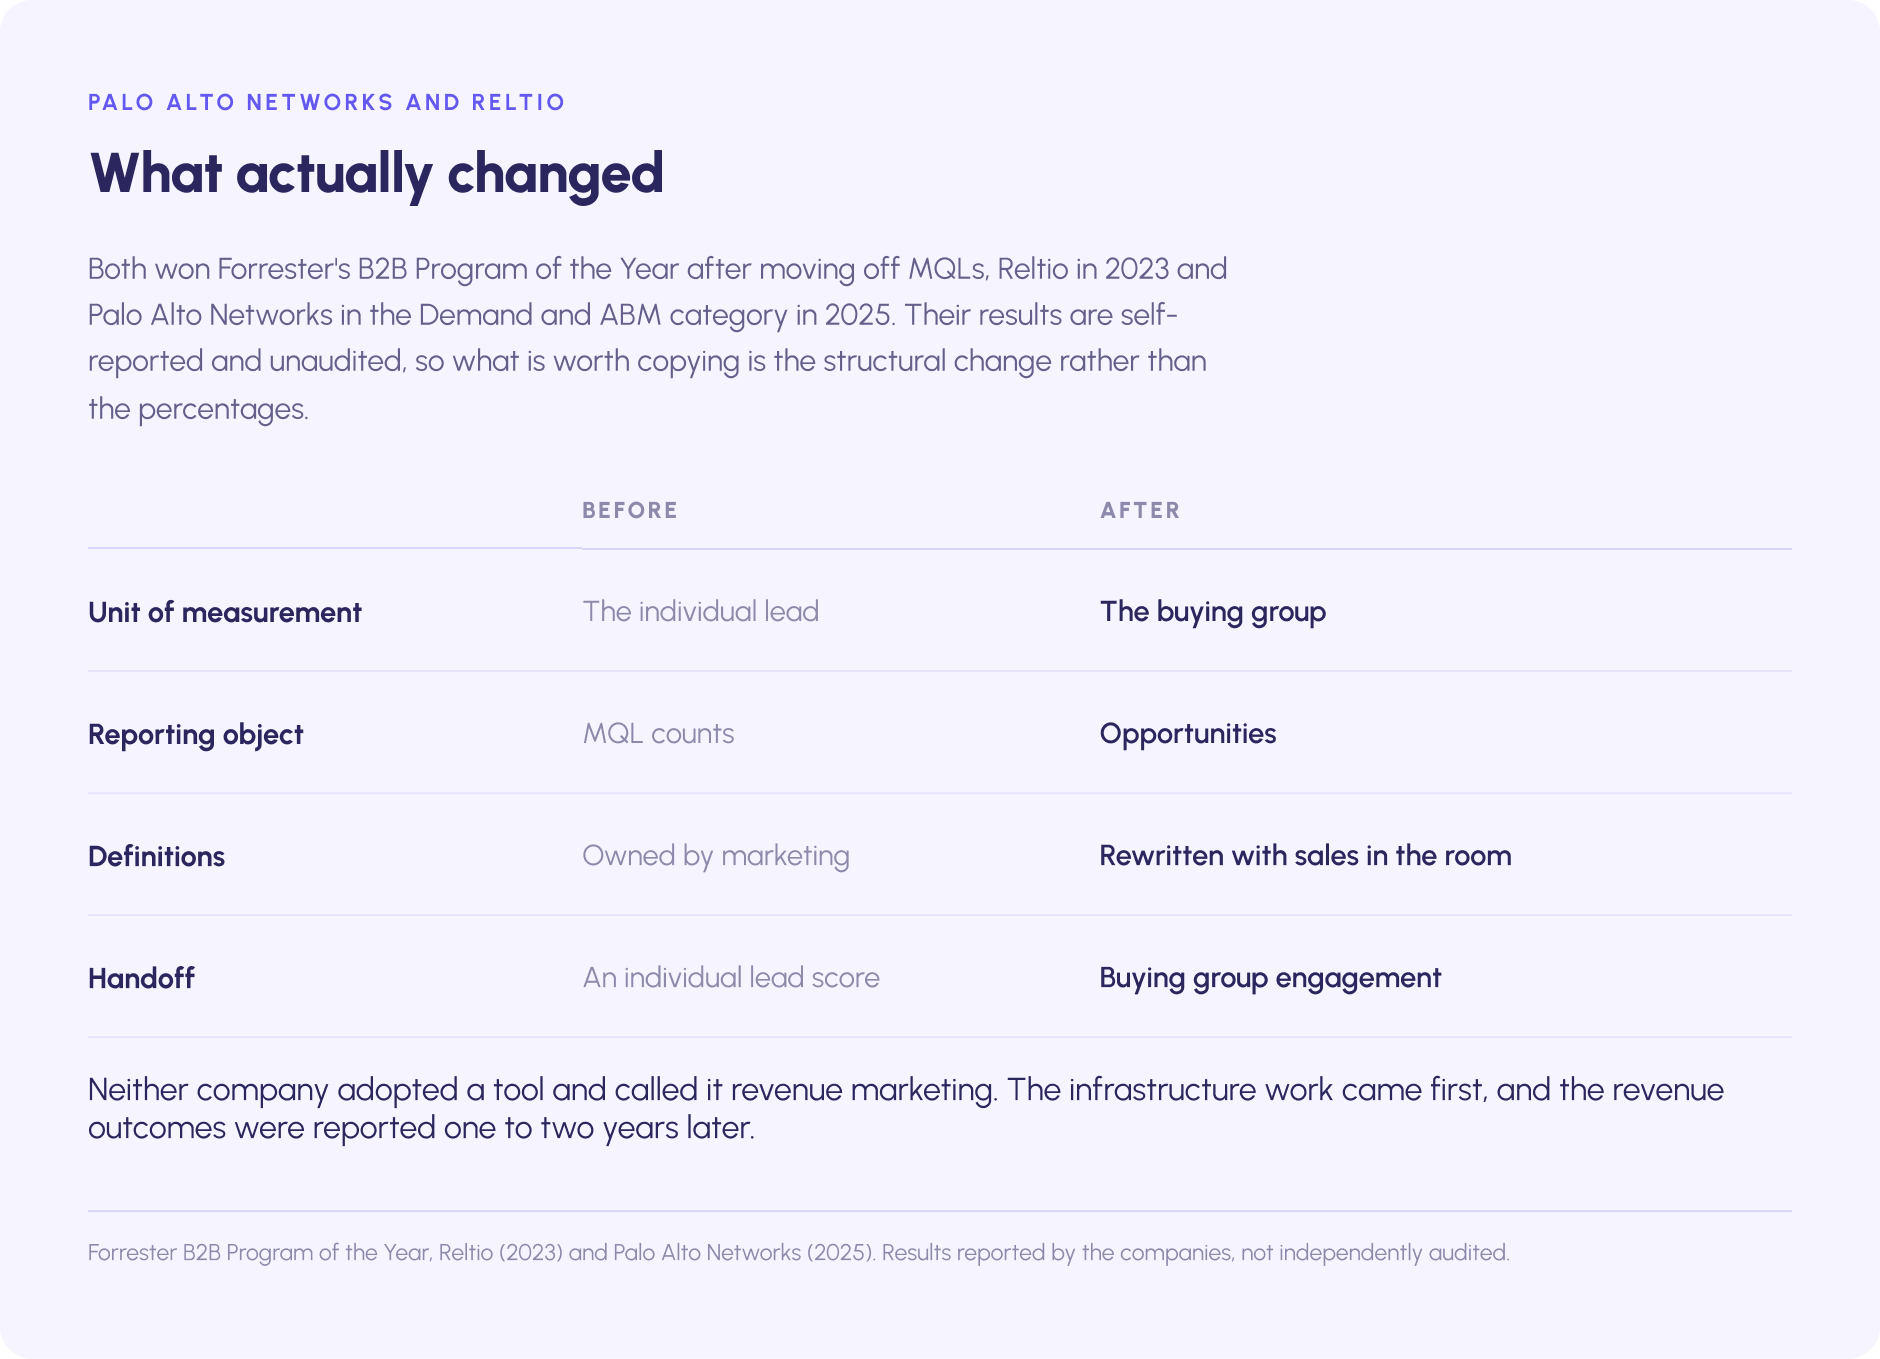
Two documented cases show the model in practice. Both come from Forrester's B2B Program of the Year awards, and both carry the usual caveat: the award is independent, the metrics are self-reported.
Palo Alto Networks
Palo Alto Networks won Forrester's 2025 B2B Program of the Year in the Demand and ABM category, after moving from individual MQLs to buying groups. According to Forrester's account of the program, led by Jeremy Schwartz (global lead management and strategy) and Lauren Daley (marketing operations), opportunities with multiple engaged contacts were eight times more likely to advance, the closed-won rate rose about 17%, and average deal sizes more than doubled. A separate LeanData retelling cites different multiples for the same program, which is a reminder to treat the figures as directional.
Reltio
Reltio won the same award in 2023 for moving its entire revenue process from MQLs to buying groups in roughly 60 days, company-wide, with no pilot. Figures relayed by CRO Eric Cross through a Nektar.ai interview include a 60% reduction in early-stage pipeline attrition, deals closing 22-23% faster, a 20% larger average deal, and forecast variance narrowing to 5-7%. The primary Forrester webinar is paywalled and the numbers have not been independently audited. Cross's summary of the change is the part worth keeping: the company stopped talking about sales and marketing and became one go-to-market team.
What the cases have in common
Neither company adopted a tool and called it revenue marketing, and neither reported faster revenue growth in the first two quarters. Both changed the unit of measurement (from person to buying group), rewrote the definitions with marketing and sales in the same room, and rebuilt reporting around opportunities and the revenue goals they feed. The infrastructure work came first. The revenue outcomes were reported one to two years later.
You will also encounter claims that revenue marketing organizations generate three times more marketing-sourced pipeline, or close deals 67% faster. Those figures circulate widely and none of them trace to a primary source we could find. Leave them out of your board deck.
Revenue marketing roles and careers
The job market has adopted the term faster than the discipline has settled, and the titles vary. What revenue marketers have in common is a target expressed in pipeline and revenue rather than in leads.
What does a VP of revenue marketing do?
A VP of revenue marketing owns marketing's share of the pipeline and revenue goals and the demand programs that produce them, and is the person who has to explain marketing investments to the board in revenue terms. GitLab publishes its version of the job description, which is a useful reference point because so few companies do: its VP of Revenue Marketing reports to the CMO and is accountable for creating and executing a scalable marketing strategy to hit new business pipeline and revenue targets, partnering with demand generation on the customer acquisition plan. Elsewhere the role reports to a chief revenue officer, and its scope depends on whether field, partner, and marketing ops sit under it.
What does a revenue marketing manager do?
A revenue marketing manager runs the marketing campaigns and programs that feed the pipeline target and is measured on pipeline created rather than leads captured. The skills that distinguish the role from a demand generation manager are CRM fluency, an understanding of which marketing channels produce revenue rather than volume, comfort with attribution data and its limits, and the ability to present to sales without being eaten. Salaries broadly track demand generation management, with a premium for operations depth, and vary widely by market, company stage, and whether the title carries a team. The title is used loosely enough that posted salaries span a wide band, so check current listings rather than trusting a quoted range.
Is revenue operations a good career?
RevOps has grown as a distinct function for a structural reason: every company adopting revenue marketing discovers it needs someone to own the data model and the definitions, and that work does not belong cleanly to either sales or marketing. The work is analytical and cross-functional, and it sits close to the executive team because it produces the numbers the executive team argues about. For people who like systems more than marketing campaigns, it is a strong path, and it is a common route into chief revenue officer roles.
Frequently asked questions about revenue marketing
What is the difference between revenue marketing and demand generation?
Demand generation is a set of marketing campaigns and programs that create and capture buyer demand across the customer journey. Revenue marketing is the accountability model those programs run inside, in which marketing owns a share of pipeline and revenue and reports on it alongside sales. Most companies claiming revenue marketing are running demand generation with a new dashboard, and the marketing efforts underneath are unchanged.
Who coined the term revenue marketing?
Dr. Debbie Qaqish of The Pedowitz Group coined "revenue marketing" in 2010 and introduced a four-stage maturity model in 2011. Her book Rise of the Revenue Marketer was published in 2013.
What are the most important revenue marketing metrics?
Pipeline created, marketing-sourced and marketing-influenced pipeline (stated with the attribution model and lookback), win rate and deal size by source, customer acquisition cost and CAC payback, and marketing-sourced revenue. Together they show how marketing efforts convert into business growth. Benchmarkit's 2025 data shows pipeline generated is the most commonly reported marketing metric, at 62% of B2B companies.
What is marketing-sourced revenue?
Closed revenue from deals where the first recorded touch, within an agreed lookback window, was a marketing-owned channel. It is the most conservative of the revenue metrics and the one finance trusts most, provided the definition does not change between quarters.
What is a good marketing-sourced pipeline percentage?
Published vendor benchmarks for B2B SaaS cluster around 25-45% sourced, with a median near 35%, and 60-85% influenced across the sales funnel. Inbound-led businesses run higher and sales-led enterprise businesses run lower. The number is so sensitive to attribution rules that comparing it across companies is close to meaningless.
Do you need an attribution tool to do revenue marketing?
No. You need a maintained CRM, agreed definitions, and a stated attribution model. A tool makes the reporting faster and the modeling more flexible; it does not create the prerequisites, and it does not turn marketing and sales into one team. Buy it after the first infrastructure quarter.
How long does it take to implement revenue marketing?
One quarter to fix definitions, CRM hygiene, attribution rules, and the revenue marketing KPIs; one to two quarters to run the new reporting alongside the old until the numbers are trusted; and one to two years before the revenue outcomes are visible, given B2B sales cycles. Companies that skip the first quarter usually repeat it later.
Does revenue marketing mean cutting brand spend?
Only when it is done badly. Around 95% of your buyers are not in market in any quarter, and revenue-measured teams tend to under-invest in them, which shows up as measurable revenue growth for a year and a shrinking sales funnel after that. Ring-fence a long-term budget with its own metrics and report it next to the pipeline numbers.
Is revenue marketing the same as RevOps?
No. RevOps is the function that owns shared data, systems, and process across marketing, sales, and customer success. Revenue marketing is the accountability model for marketing. RevOps builds what revenue marketing runs on.
Why do sales and marketing teams disagree about lead quality?
Because sales and marketing teams use different definitions of a lead at different points in the sales process, and because a large share of leads are never contacted in time or at all. A written definition, a two-way service level agreement, and lead response tracking turn the disagreement into a measurable gap.
.png)